- English
- عربي
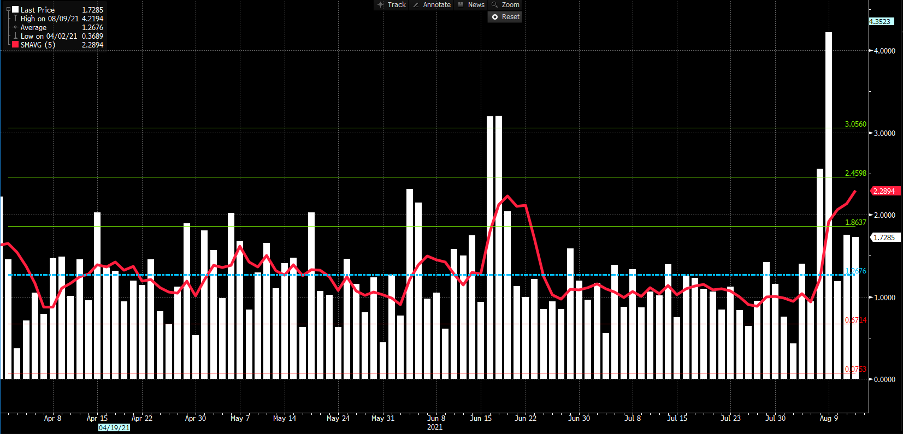
Using a simple percentage range histogram (daily high-low/prior days close) and then overlapping a 5-day moving average (red line), we see the 5-day percentage average sits at the highest since late March and one standard deviation above the 12-month average.

(Source: Bloomberg)
I prefer range as a visual on past volatility over realised volatility (RV), which is what a lot of market players will use to understand past movement. That said, 10-day RV has in itself picked up to 17.72% from 5.44% in late June. RV measures the movement on a close to close % change, however, we as traders don’t work on a close-to-close basis, but are caught up in the whole move, 24 hours a day. Either way, movement is here and clients have been incredibly active in this move, where XAUUSD has by some way been our most traded instrument on the day.
On so many technical indicators we’ve seen price come off incredibly oversold short-term conditions and positioning is now far cleaner. On the day the tape has shown a steady stream of buyers all the way into 1754 and this move seemingly encouraging short positions from clients and our long/short XAUUSD skew is now held perfectly 50/50.
The fundamental reasoning for the bid in Gold has been a modestly weaker-than-expected US CPI print (core CPI printed 0.3% vs 0.4% eyed), but more prominently, we saw huge demand in the US Treasury department issuance of $41b in 10yr notes. This has seen US bonds turn bid (yields lower) and with-it US real rates have dropped and we’ve seen the USDX print a bearish reversal, although is still holding its 5-day EMA – Like everyone else I am watching the USD here, and for signs of a short-term top – it’s too early to have any conviction on that yet.

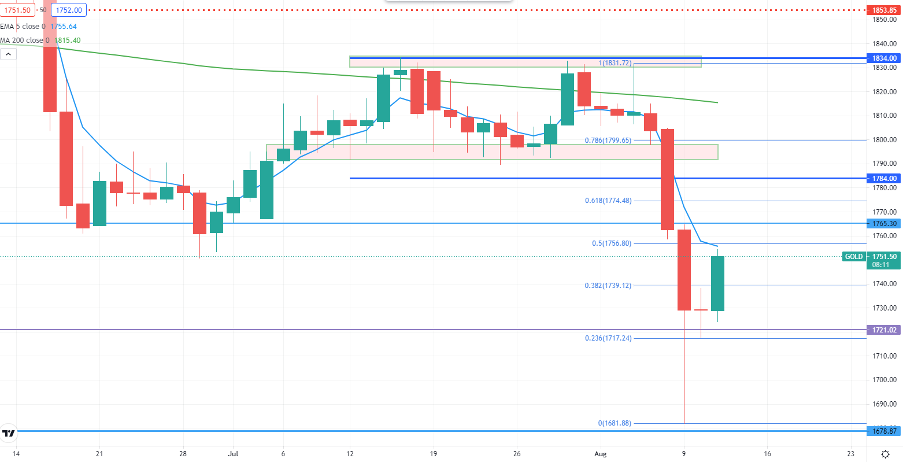
(Source: Tradingview)
The Gold bulls were hurt in Monday’s liquidation dump, but have picked themselves up, dusted themselves off and recognising the forced nature of the flow on Monday bought into weakness. Price looks to be closing out above the 29 June swing of 1750, so that is a tick in the bull’s box and there's no supply into the 38.2% fibo retracement of the 1831-1678 move in 1744. We’re now eyeing a momentum shift, with a bullish crossover in stochastic momentum on the daily.
Coming off oversold conditions is one thing but to see a Crypto like trend is another and there are a number of levels I have picked out that may see gold rollover. Conversely, if price can breeze through without any clear signs of overwhelming supply, then that would be a powerful statement in itself. We can also watch the USD moves, as the bears have regained some control here and as always, if possible, being long Gold in the weakest currency, or short in the strongest currency work best.

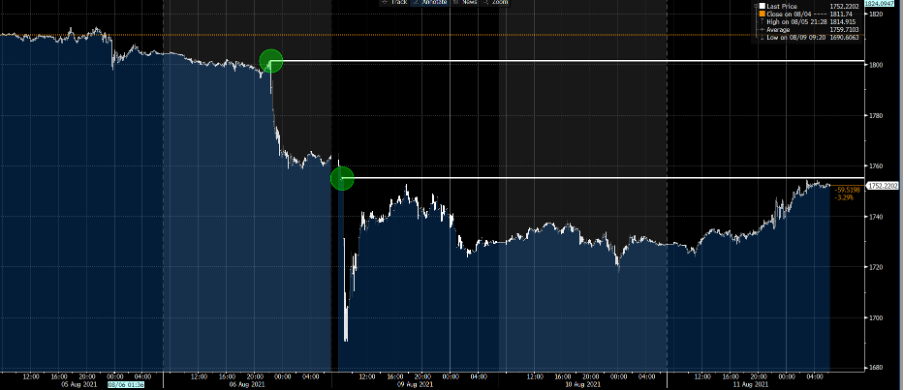
(Source: Bloomberg)
Levels to watch
1755 (lower green circle) – this is the level on Monday where price cracked, and we saw a rapid decline into 1678. When it comes to reacting to flow, this is a bit unusual as this was a forced move, where leveraged long futures positions were closed, and Asia-based CTAs (trend-followers) dumped exposures.
1755 is also the 5-day EMA and 50% fibo of the 1831-1678 move. So, again watching for price to turn here.
1764 – Monday’s high.
1778 – The breakeven level on the XAUUSD weekly straddle. One more for the mean reversion traders, but I’d be surprised if we push through here this week.
1800 (upper green circle) – obviously a round number, but this was the level gold resided just before we saw the stellar NFP jobs report before sellers dominated into the Friday close.
So, a bit of wood to chop if price is going to push above 1800 and hold, and this remains a trader’s market and 1755 looks like a key level for now. Trade the opportunity with Pepperstone.
Related articles
Ready to trade?
It's quick and easy to get started. Apply in minutes with our simple application process.
The material provided here has not been prepared in accordance with legal requirements designed to promote the independence of investment research and as such is considered to be a marketing communication. Whilst it is not subject to any prohibition on dealing ahead of the dissemination of investment research we will not seek to take any advantage before providing it to our clients.
Pepperstone doesn’t represent that the material provided here is accurate, current or complete, and therefore shouldn’t be relied upon as such. The information, whether from a third party or not, isn’t to be considered as a recommendation; or an offer to buy or sell; or the solicitation of an offer to buy or sell any security, financial product or instrument; or to participate in any particular trading strategy. It does not take into account readers’ financial situation or investment objectives. We advise any readers of this content to seek their own advice. Without the approval of Pepperstone, reproduction or redistribution of this information isn’t permitted.


