- English
- عربي
Instruments mentioned to potentially trade: SpotCrude, SpotBrent and NatGas
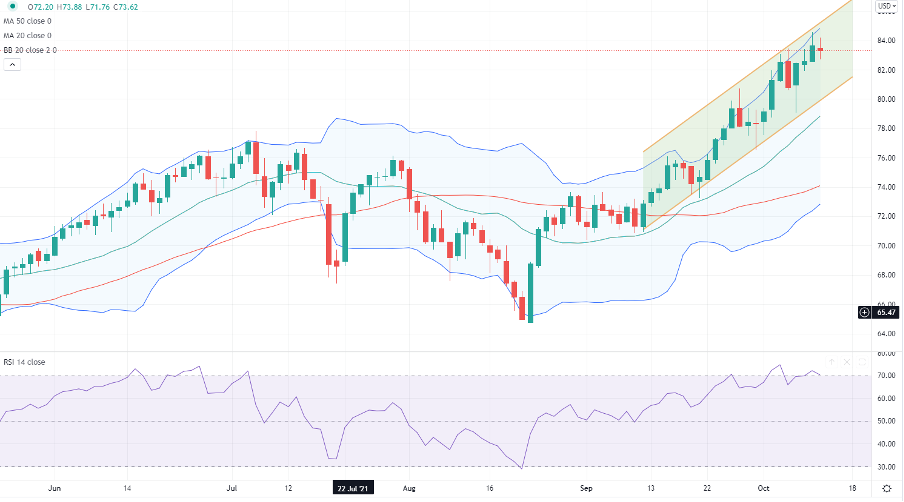
The moves into $84.58 in Brent and $82.15 WTI crude are part of the bigger issue of rampant buying playing through the energy complex, driven by coal and gasoline futures, with shortages leading to questions around the response ahead of the Northern Hemisphere winter. A more positive feel about economic re-openings has also had some impact on the perception of demand. Although, what we’re seeing is predominantly a supply-side shock.
Daily chart of Brent crude

(Source: Tradingview - Past performance is not indicative of future performance)
Inflation the key macro debate
More broadly, rising energy and food prices have been at the heart of the lift in inflation concerns with the IMF offering a warning to be “very, very vigilant” over rising prices – the group suggesting central banks act early should price pressures prove persistent. The Fed has started to respond more intently with Atlanta Fed President Raphael Bostic, a known hawk, saying inflation is broadening and is not transitory. Vice-chair Richard Clarida detailing that he sits in the transitory camp but sees upside risks to price pressures.
The risks to inflation have been a theme for weeks now in markets, and as always markets are two steps ahead of central banks. We’ve already seen rate hikes from a number of emerging market central banks, as well as in Norway and New Zealand, while the forward rates curves of many DM interest rate markets are pricing a series of further hikes.
We’ve seen a reasonable lift in various 2-year government bond yields as rate hikes get priced and this has influenced ‘carry’ in FX markets, promoting clear short covering in the likes of the AUD and attracting sellers of JPY as Japanese pension funds seek returns outside of domestic markets.
So, we’re at a very interesting point in the cycle – on one hand, most economists still see the supply side issues and bottlenecks abating in 2022, effectively clearing up one of the big issues that have boosted energy prices. Often the cure for higher prices is higher prices themselves as we see demand destruction and a belief in alternative sources – a factor that has partially boosted the crude price of late. On the other hand, trend-following funds (CTA’s) continue to buy strength and the bid remains in the market.
The possible response from OPEC
Moves in NG and coal aside, perhaps the real catalyst for a more aggressive decline should come from OPEC. Some are also watching output plans from US shale producers, and we watch the weekly DoE inventory data and the US rig count for more intel here – any view that US producers are to increase output should weigh on prices. However, with Brent at the highest levels since 2018 one does question if OPEC nations break rank and start to produce more than has been agreed, where discipline will be assessed in the 4 November OPEC meeting. Or, whether we see OPEC look to work as a collective, formally announcing a further group increase to monthly output levels.
If the market starts to believe this is the probability, then it should limit upside and bring out better sellers.
Our own client flow in SpotCrude and SpotBrent is modestly net long, as is the case in NatGas. I’d certainly be watching NatGas (NG), as will be the case for other energy markets like coal futures as a leading indicator for crude. NG is now testing the August uptrend and a break here takes price to $5.00 and potentially the 50-day MA and lower Bollinger Band around $4.80 – A rally off the trend and it may keep the bid in crude prices.
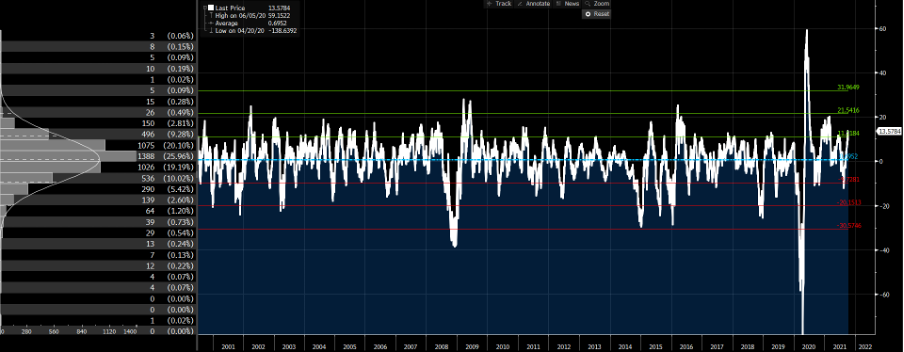
WTI crude vs the 50-day – with average, 1, 2 & 3 std deviations bands

(Source: Bloomberg - Past performance is not indicative of future performance)
Has the move gone too fast, too soon? One way to look at this is how far price has rallied from the 50-day moving average. In SpotCrude, we see the price at a 13.6% premium from the 50-day MA, which is above one standard deviation from the average seen since 2000. This is a level where we’ve typically seen price struggle to push higher from. That said, I’d be far more confident of trading SpotCrude short on a >15% premium – at this stage, SpotCrude prices would need to be above $82, so a further squeeze higher above here would offer an increased statistical probability of mean reversion short positions.
Models and statistical factors aside, we’ve seen indecision on the daily chart of spotcrude, with a Doji candle coming in after Monday’s fade. This doesn’t indicate a collapse but there is hesitancy to push prices higher here. The bull channel it held since 10 September remains intact, indicating at this point that buyers should support weakness.
Personally speaking, I’d be wanting a bit more strength to take out shorts – this would marry nicely with statistically overbought levels and a run-up into the 4 November OPEC meeting.
Related articles
Ready to trade?
It's quick and easy to get started. Apply in minutes with our simple application process.
The material provided here has not been prepared in accordance with legal requirements designed to promote the independence of investment research and as such is considered to be a marketing communication. Whilst it is not subject to any prohibition on dealing ahead of the dissemination of investment research we will not seek to take any advantage before providing it to our clients.
Pepperstone doesn’t represent that the material provided here is accurate, current or complete, and therefore shouldn’t be relied upon as such. The information, whether from a third party or not, isn’t to be considered as a recommendation; or an offer to buy or sell; or the solicitation of an offer to buy or sell any security, financial product or instrument; or to participate in any particular trading strategy. It does not take into account readers’ financial situation or investment objectives. We advise any readers of this content to seek their own advice. Without the approval of Pepperstone, reproduction or redistribution of this information isn’t permitted.


