- English
- عربي
DXY:
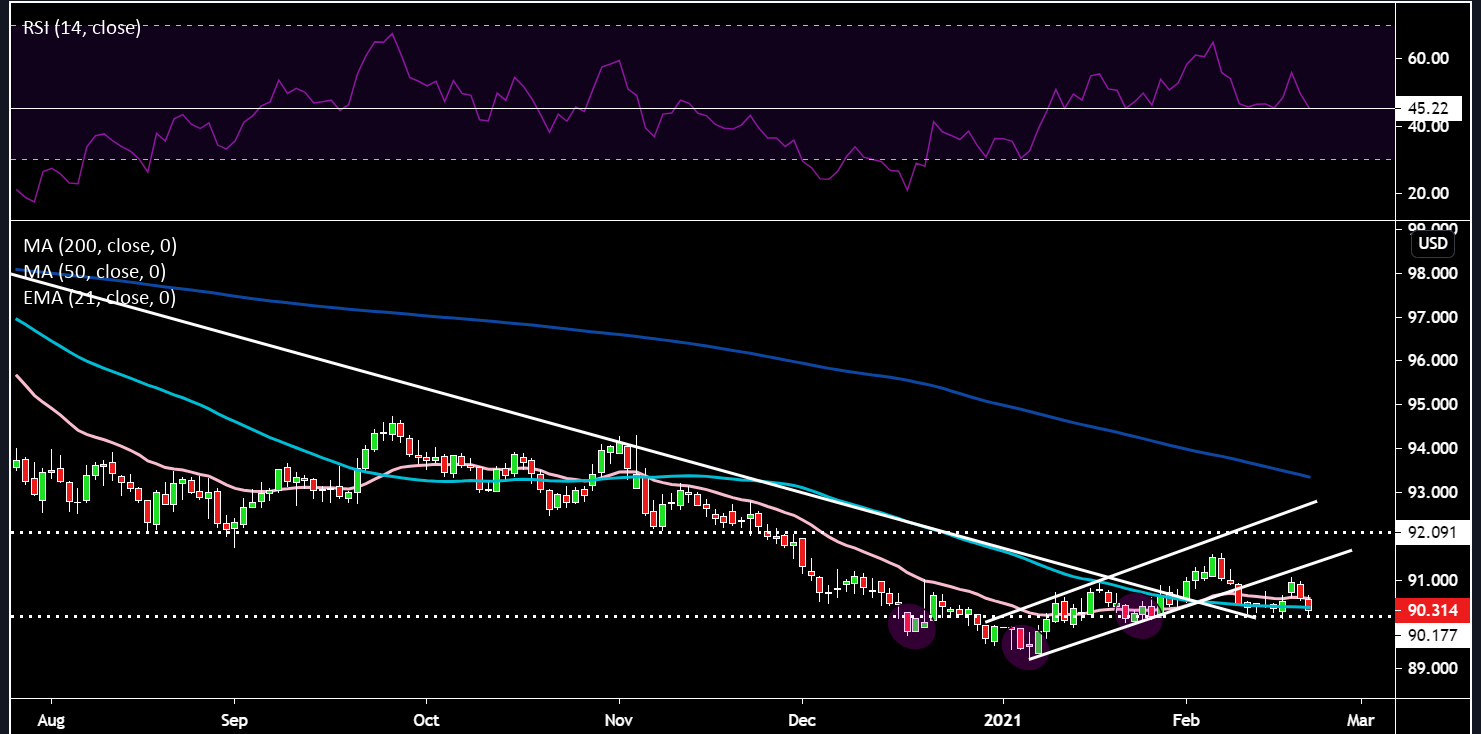
The dollar index traded like a penny stock, up, down, up yesterday. It was quite perplexing to see real yields up and a mild equity market correction provide no bid to the dollar. There was a big miss for initial claims which highlights the weakness still present in the Labour market. This will help quicken the pace at which the stimulus package is released by government. Let’s see what PMI’s bring. Fed minutes reiterated the dovish tilt with conditions being met for a tapering not being met for “some time”. However, the Fed’s Kaplan was slightly more hawkish stating as the US weathers the virus, it would be healthier to wean from the extraordinary Fed policy as soon as possible. Interestingly, despite all the dovish rhetoric from Jerome Powell and co, the OIS market has pulled forward its rate hike expectations from January 2024 to August 2023. Most believe AIT will save us from a 2013 redux taper tantrum, however, AIT anchors front end rates, but what about longer tenors? These are rising fast and AIT doesn’t help further out the curve. Will Fed allow a natural repricing or will it stamp on the back of the curve via YCC (yield curve control) or more QE?
The technicals aren’t great for the greenback with price just below the light blue 50-day SMA and is sitting close to important support around 90.17. The RSI has rolled over and is back at the 45 support which has kept the bullish trend intact. If the late January low is taken out (90.05), then dollar bulls will need to reassess.
GBPUSD:
The incredible vaccine rollout in the UK has surprised many (32.75% of the adult population in England have now received at least one dose of the vaccine), so much in fact that they are willing to look right through the very weak retail sales data that came out this morning (-8.2% vs -2.5% exp MoM). PMI data had beats across the board. Overnight we got the UK February GfK Consumer Confidence print which was its highest reading since Covid really hit the UK – this feeds into the narrative of pent up demand and a strong economic recovery due to the significant involuntarily savings. Next Monday poses a risk to long cable traders as we will hear from Boris Johnson on his lockdown exit strategy. This will be important as their could be a divergence between the market’s expectation of the pace of reopening vs the actual reality. This has been the main driver behind sterling’s strength so, disappointment on this front would see some sellers come in. Given investors are still relatively underweight UK equities, this provides an additional source of inflows and for additional long positions to build up over time. UK Chancellor Sunak is reportedly extending the furlough scheme until summer. We will hear confirmation of this on March 3rd, but it seems highly likely.
On the technicals, cable has broken to the topside of its ascending channel, moving averages all pointing northwards and hit 1.40 in the early hours of trade. The RSI has just crept into overbought territory and the round number of 1.40 may attract some profit taking. So maybe a pause and minor dip towards the pink 21-day EMA around 1.379 or 1.375 (former horizontal resistance) would be good levels to reload some long positions. Still think this cross is a good candidate for a buy the dips approach.

EURGBP:
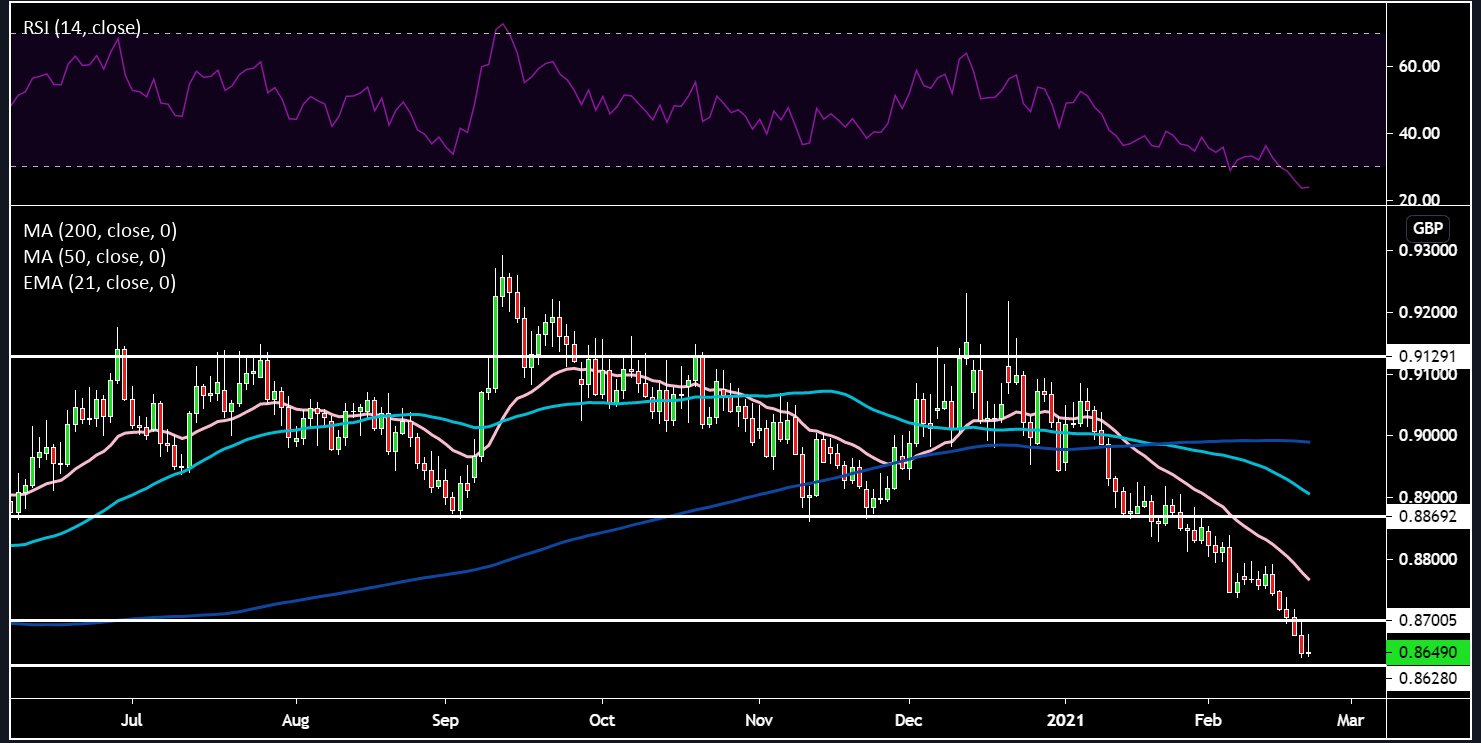
The pound continues to strengthen against the euro as the vaccine spread between the two remains wide. One could say the BoE is becoming more hawkish than the ECB too which won’t do the single currency any favours. In the latest ECB account they were concerns about the slow progress on the EU package. They also reiterated being vigilant with regard to developments in the exchange rate, but then countering this with “the impact of exchange rate movements on inflation might be overestimated in standard models”. Ultimately, the EU is a large exporter so the exchange rate will always be monitored closely by the ECB in my opinion. The political situation between the EU and UK still remains quite prickly with a financial service agreement still to be agreed. Economic calamity as many would have you believe due to border nightmares have been avoided with freight volumes at 99% of levels seen last year (prior to covid so no distortions) and falling rejection rates for cargo. This is the best pair to express a bullish pound view, given the dollar could put up a bit of a fight as the year progresses.
Price action has been heading in one direction – down. The light blue 50-day SMA is solidly below the dark blue 200-day SMA. With any rallies being shorted. It looks like some profit taking is happening today as the move has become a little extended in the short term with the RSI solidly in overbought territory. Additionally, there is some price support around the March lows of 0.8628, which will need to be taken out if we are to see a further slide in price.
EURUSD:
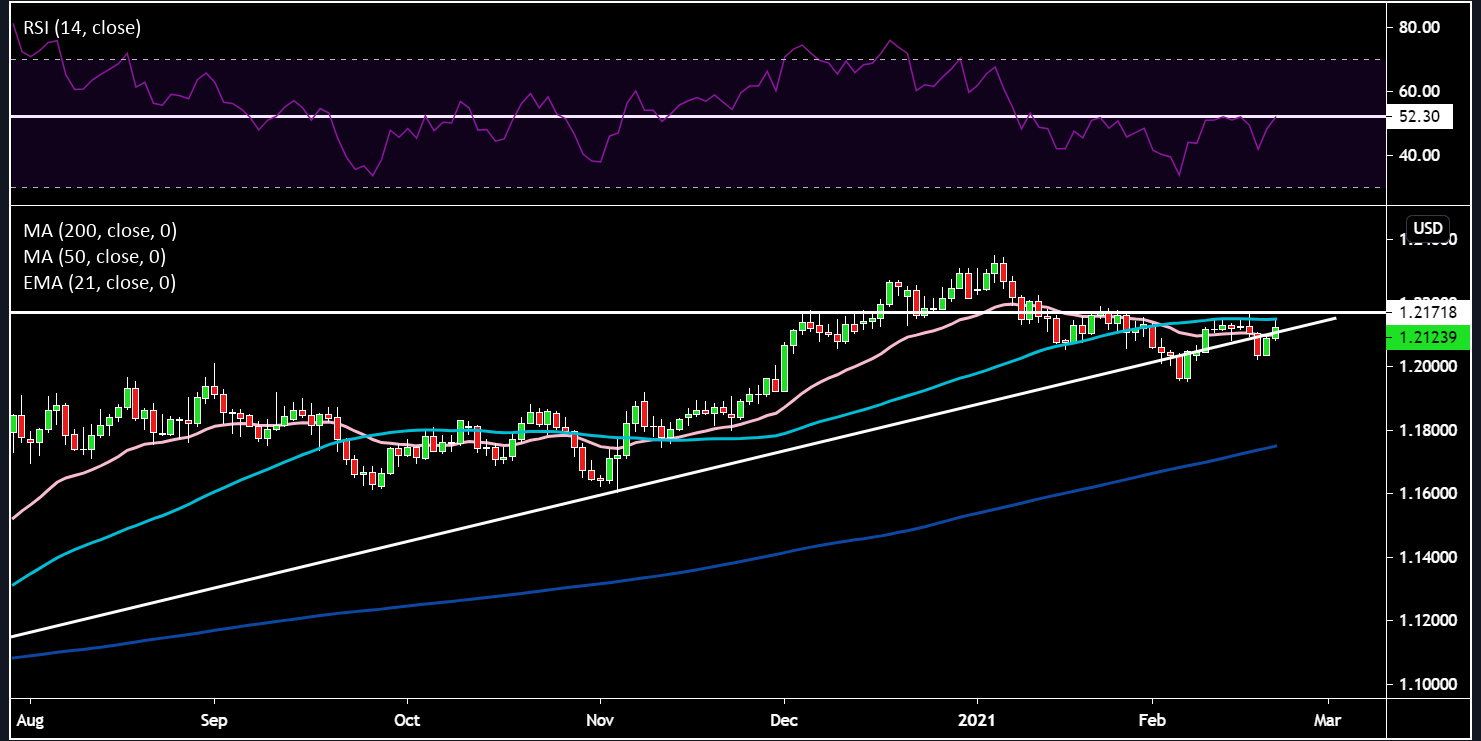
Another currency pair that doesn’t get me very excited. The US is outpacing the EU on the vaccine front and higher yields have caused downside pressure. The cross remains range bound and directionless. Price is trying to regain that uptrend line, however, there is a lot of resistance from the light blue 50-day SMA, horizontal resistance (1.217) and the RSI is coming up to previous resistance around the 52 level. All about what the dollar does from here on out.
USDJPY:
Moving onto Asia, a cross which has been delivering outsized moves of late on the back of yield differentials between the US and Japan, as Japanese investors lick their lips over the higher yield. Price got to the 106 region (top of ascending channel) and suffered some high altitude sickness and has retreated back just below the dark blue 200-day SMA. The 105.227 level of support has held for now as a buy the dips approach continues to be implemented by traders. The RSI has rolled over but is far away from raising concerns over a trend break.

USDCNH
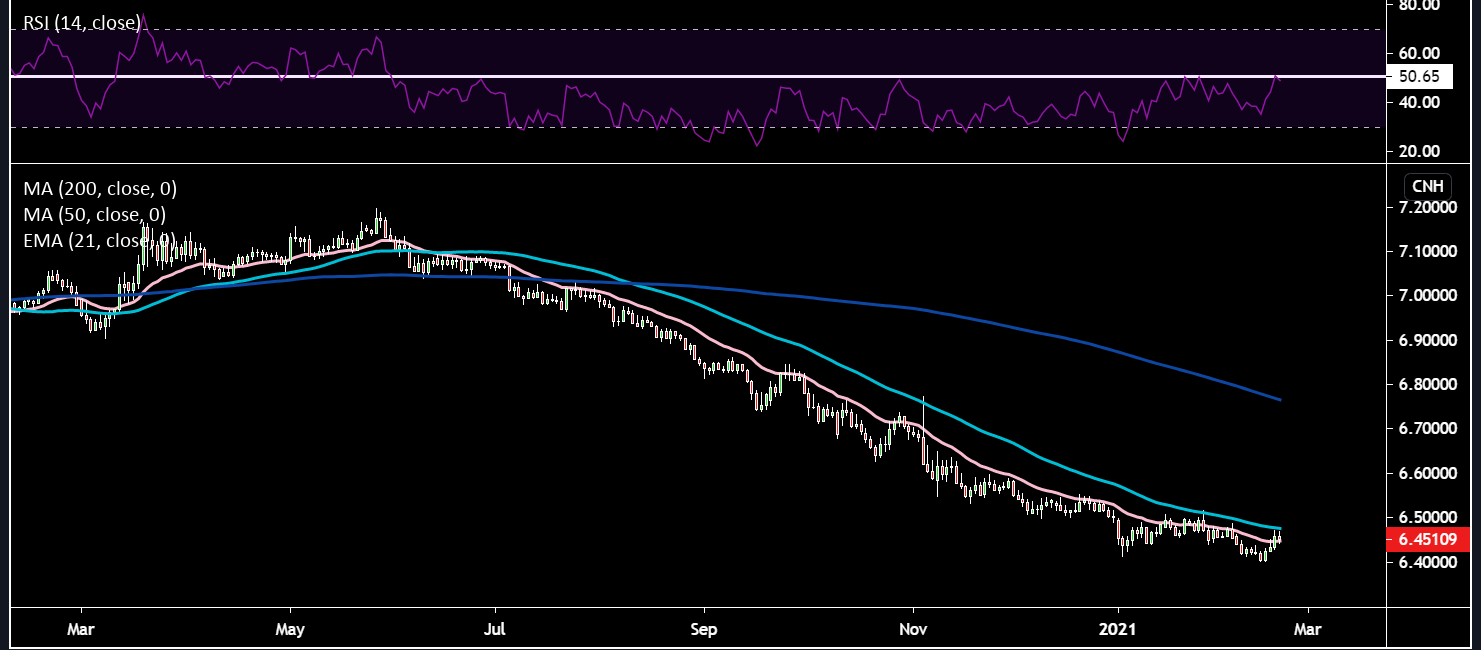
This is an important cross as it has implications for risk sentiment. The yuan is seen as a proxy for the rest of the EM complex. So weakness here could spill over to Africa and Latam etc. It does look like a small double bottom could be forming here. If price overcomes the light blue 50-day SMA, we could see some quick moves to the upside, but dollar will need to flex its muscles. 6.40 remains line in the sand to the downside. The RSI has stalled too at the 50 level where upward moves have also struggled at in the past.
Gold:
Gold has been under a lot of pressure as real yields have risen. Today its trying to put in a bid on a weaker dollar as well as some oversold profit taking before the weekend. The death cross of 50-day SMA below 200-day SMA is an ominous signal. Gold also seems to be losing out to other more industrial metals such as silver and copper. $1775 support is a big level which if we lose points to more price declines with the next level at $1750.

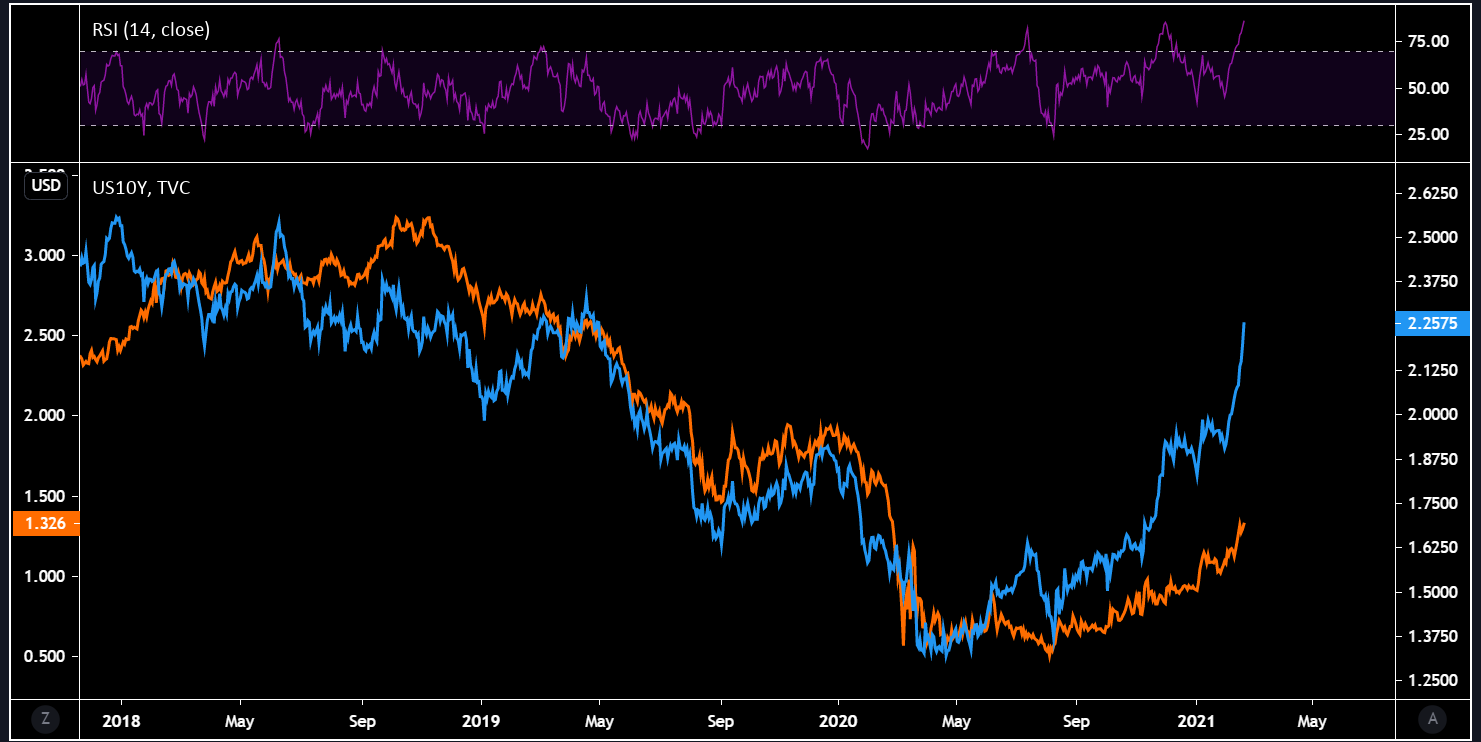
Copper/Gold Ratio overlaid with US 10-Year yield:
Copper is on an absolute tear at the moment and is the strongest in nearly a decade. The ratio of copper to gold has gone almost vertical as copper surges and gold sells off. Historically, this indicator has been used as a valuable tool to signal an improving economy and therefore higher rates. However, since the unprecedented monetary policy taken in March a wide divergence has been taking place, making one question this important relationship. Is it broken due to all the distortion which took place as a result of the monetary experiments or are we going to see this gap closed. Either copper/gold will catch down to yields, yields catchup to copper/gold or lastly a bit of both meeting somewhere in the middle. If yields are to catchup then copper/gold is indicating the US 10-Year yield should be north of 2%, wonder how the Fed would feel about that. I’ve multiplied the copper/gold ratio by 1000 to make the numbers easier to read. The RSI is reaching very overbought levels which have previously resulted in a pullback, but still this would call yields at least 30 bps higher. Good one to keep an eye on.
Related articles
Ready to trade?
It's quick and easy to get started. Apply in minutes with our simple application process.
The material provided here has not been prepared in accordance with legal requirements designed to promote the independence of investment research and as such is considered to be a marketing communication. Whilst it is not subject to any prohibition on dealing ahead of the dissemination of investment research we will not seek to take any advantage before providing it to our clients.
Pepperstone doesn’t represent that the material provided here is accurate, current or complete, and therefore shouldn’t be relied upon as such. The information, whether from a third party or not, isn’t to be considered as a recommendation; or an offer to buy or sell; or the solicitation of an offer to buy or sell any security, financial product or instrument; or to participate in any particular trading strategy. It does not take into account readers’ financial situation or investment objectives. We advise any readers of this content to seek their own advice. Without the approval of Pepperstone, reproduction or redistribution of this information isn’t permitted.
.jpg)

