- English
- عربي
.jpg?height=93&quality=100)
DXY:
This week contained ample economic data for traders to absorb from flash PMI’s, bond auctions, Q4 GDP final revisions, jobless claims and the recently released. Initial jobless claims came in at 684k (730k exp) and continuing claims printed at 3870k (4000k expected) and Q4 GDP growth was revised modestly higher. The bond auctions weren’t great, particularly so for the 7-year maturity which tailed quite significantly and spilled over into the 10-year yield. However, it was a significant improvement on February’s auction. We just received the core PCE print (Fed’s preferred inflation metric) which came in at 1.4% vs 1.5% exp, this has seen some indecisive choppy price action on the more shorter timeframes. Next week we receive US ISM manufacturing data and Non-Farm payrolls which are expected to both be very strong. Real yields remain in a tight range, with a push through the current range high of -0.54% helping to propel the dollar higher. DXY index is weighted 57% by the euro, so upside dollar price action will be heavily skewed by a weaker euro.
The dollar is a bit softer today which could be down to some profit taking into the weekend after a strong run. Viewing the technicals, a key point is that price has now closed above the 200-day SMA. The DXY seems to be taking a bit of a breather now as it hits some topside resistance in the form of the 93 level and the underside of the uptrend line from January. For bulls the price candle needs to close above the 200-day SMA into the weekend to push back selling pressure. However, a bearish signal has formed on the charts in the form of negative divergence on the RSI, which has now begun to rollover. It made lower highs while price made higher highs, a sign of waning momentum. Maybe a retest of the 92 price support (just above the 21-day EMA) as well as the RSI 55 level is in order before fresh longs are deployed. Net specs short positioning on the dollar has been reduced dramatically over the last 2 weeks, tonight’s CFTC data will provide a further update on this potential new short covering trend.
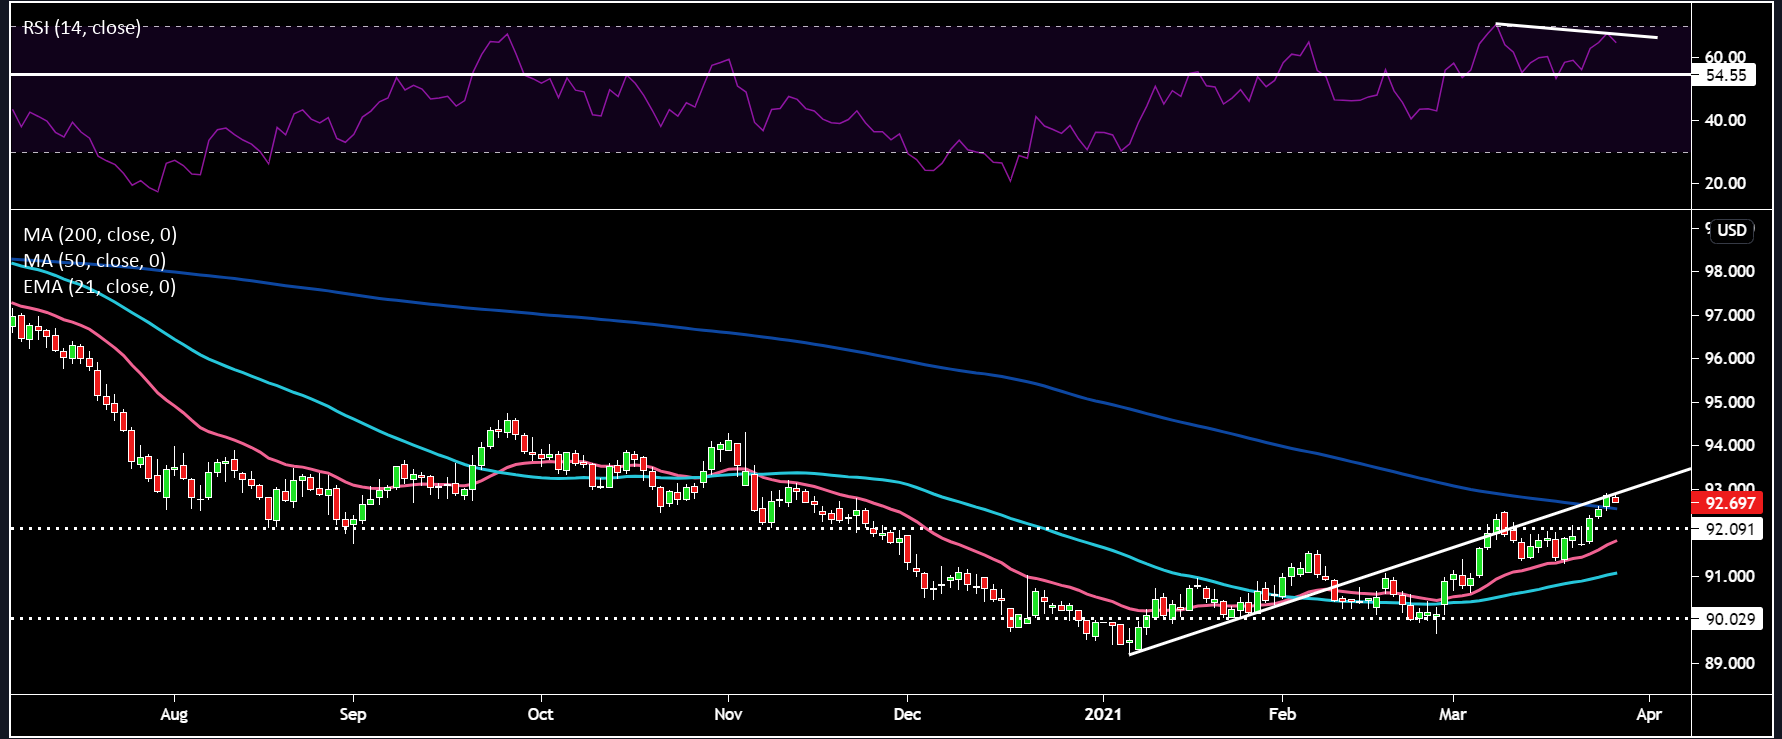
Dark Blue Line: 200-day SMA; Light Blue Line: 50-day SMA; Pink Line: 21-day EMA (same for all other charts)
EURUSD:
The single currency has been under pressure for most of the week despite solid flash PMI data across the region, although some of this data is likely stale given that France and Germany recently renewed restrictions . Today, German Ifo data was also robust. A top German public health official stated there are clear signals that this wave could be worse than the first two, which is an ominous sign for the 3rd wave in Europe. The key issues for the euro are the same: 1) Increasing restrictions as a result of a deteriorating virus situation 2) Failure to improve the vaccine rollout 3) EU recovery funds still not deployed 4) Widening US-EU bond spread and growth outlook. Positioning data although now under 100k with the latest data pointing to circa 90k, it is still chunky given the fundamental outlook for the euro.
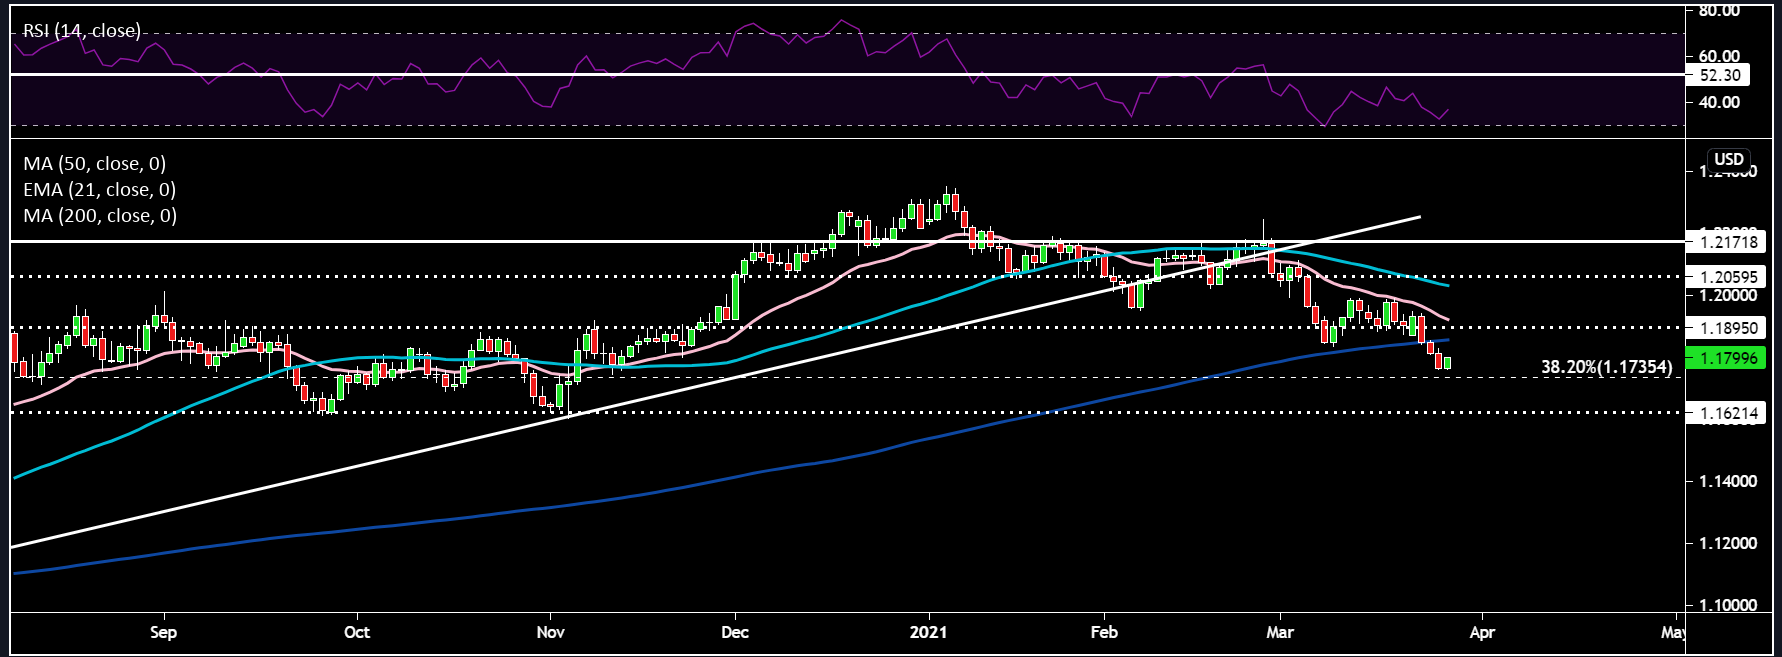
The technicals are not better with a key break of the 200-day SMA and 2 consecutive closes below this important market indicator. Price looked to be enroute to the 1.175 region (just below is the 38.2% Fibonacci level) but some bids came in today to help the euro. One bullish signal for EURUSD, is the RSI showing some positive divergence in the sense that price has made lower lows while the momentum indicator has made higher lows, potentially showing weaker selling pressure. Still think this cross remains underwater with sporadic upside rallies. Topside resistance would be the 200-day SMA (1.185) and the 1.189 level. To the downside targets would be the 1.173 region of the 38.2% Fibonacci level and the 1.162 earlier price support.
GBPUSD:
On the data front it was mixed with decent labour prints, solid flash PMI’s, significantly softer than forecast inflation data and mixed to weak retail sales data today. Speaking of the economy we had some interesting remarks from the BoE’s chief economist Andy Haldane who shared his thoughts about the UK economy. He stated that he senses the economic recovery will come quickly as people are desperate to get out and spend an excess savings pot of around £150 bn that they’ve built up during the pandemic. On the geopolitical front, the EU and UK have just reached agreement in principle on a financial services MOU, which will ease concerns about cross border business. Nicola Sturgeon of the SNP was found to have mislead parliament an inquiry found. Chipping away at her popularity, and placing her goal of an independence referendum further in doubt. Vaccine supplies coming out of the EU remains uncertain given the curbs the EU commission seem keen to impose. However, negotiations and collaboration between the EU and UK seems to be prevailing currently. One to watch though given the UK’s strong vaccine rollout narrative driving strength in the pound.
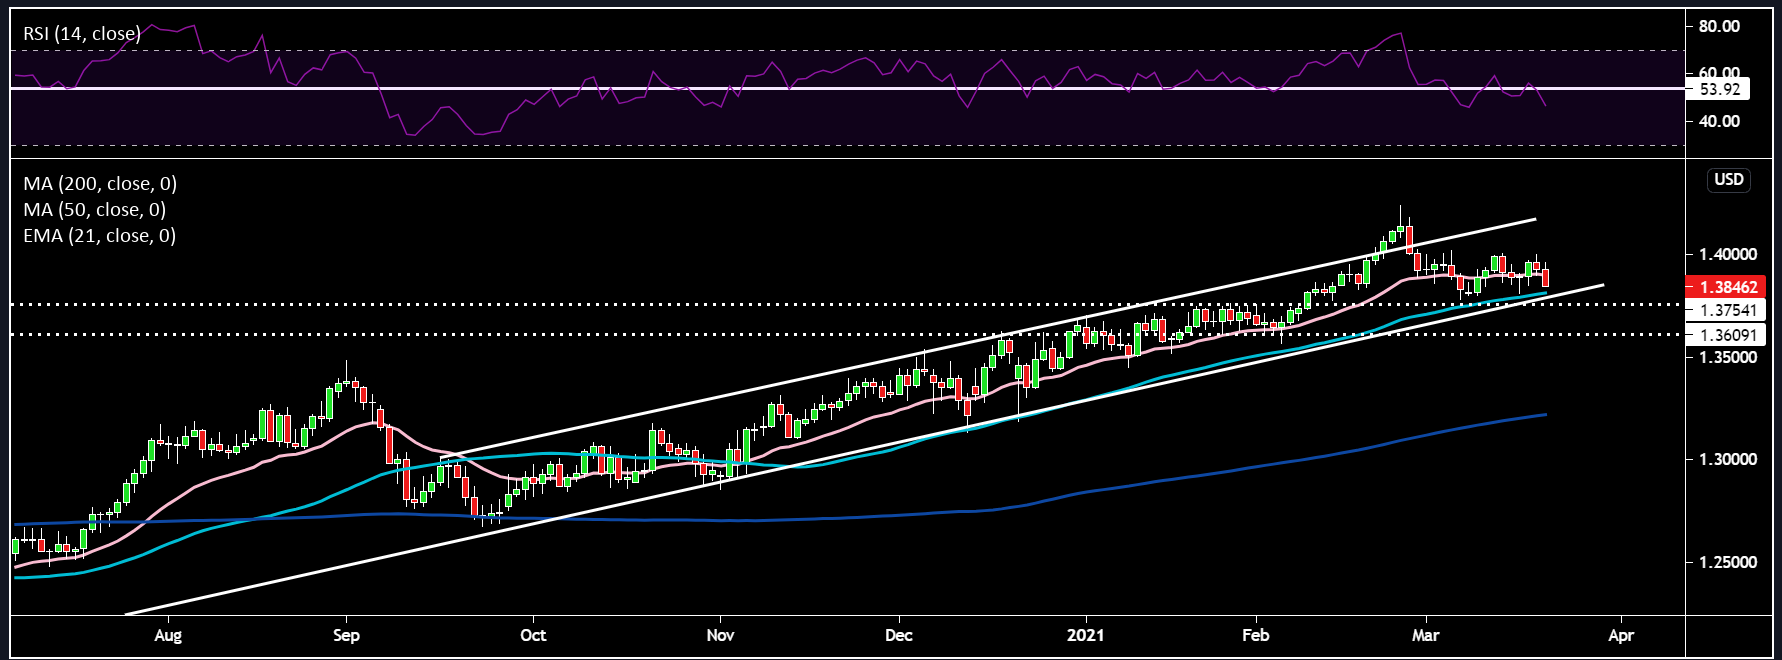
Cable did make quite a significant technical break of its 50-day SMA and uptrend line from the March 2020 lows. However, price is now itching to get back into that ascending channel with price just below the lower line. There is a lot of resistance around the 1.38 region, so this will be key for the bulls to regain control into next week. The 21-day EMA still remains above the 50-day SMA and the RSI seems to be eyeing the resistance around the 54 level. Let’s see if the buy the dips narrative can regain control. On the downside 1.36 remains a key level to watch.
USDJPY
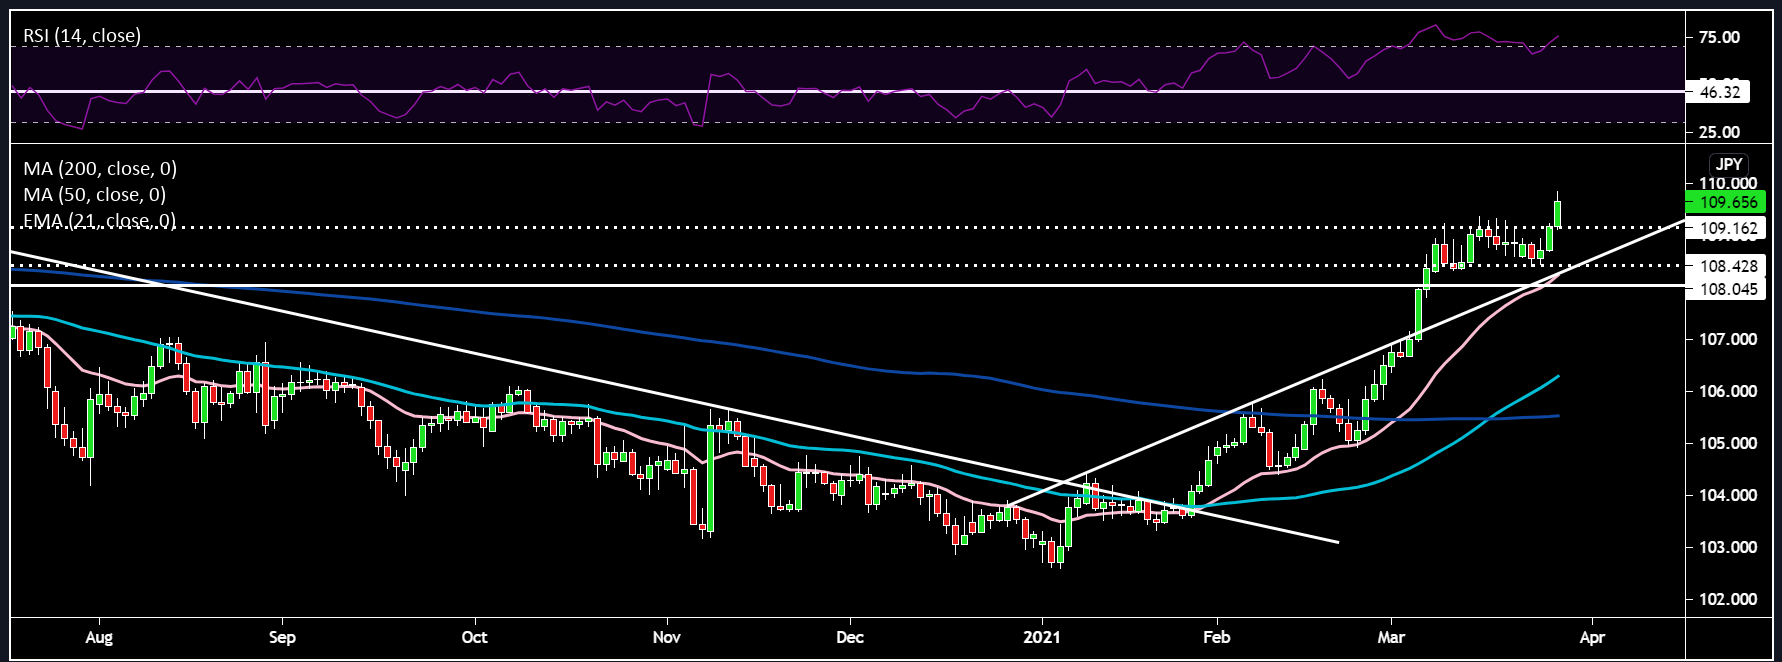
This cross continues to pique my interest given its large intraday moves. With the 110 level now firmly in sight. USDJPY continues to push higher given its close correlation to US yields. The RSI is pushing further into overbought territory, so price might get a bit sticky as it gets ever closer to the big 110 level. Price has now conclusively broken out of its tight 108.4-109 price range. If price pulls back there is good support around 109, 108.4 and the 21-day EMA of 108.2. Still think this remains a good buy the dip candidate.
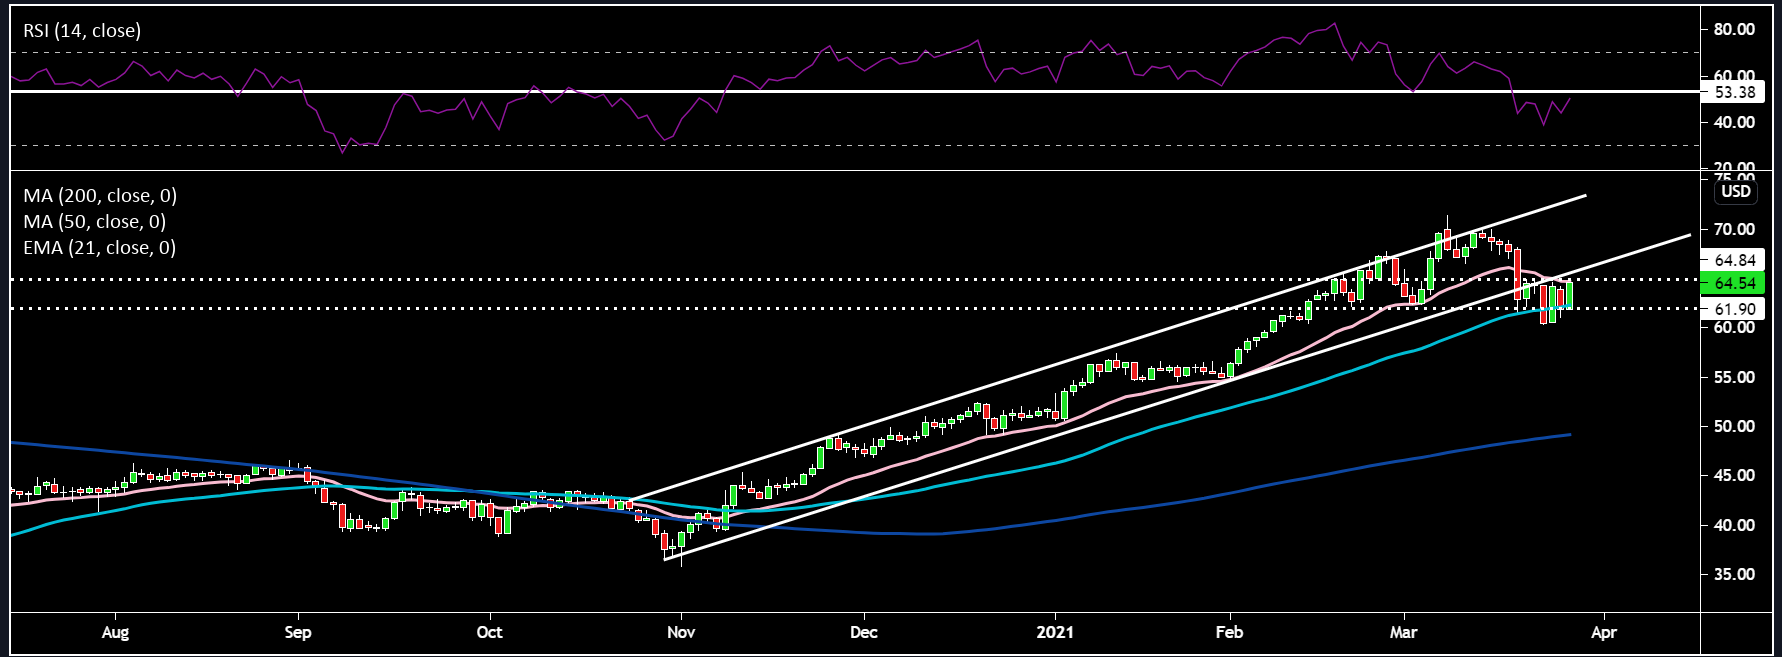
Oil:
The black liquid has been hogging the limelight this week as a large tanker has become stuck in the Suez Canal, causing a traffic jam on the seas. There are a number of factors at play in the oil complex currently. On the demand side we have EM and EU virus cases rising, limiting mobility and aeroplane travel. As well as refinery maintenance occurring leading to a slightly softer demand picture. Supply side dynamics are currently focused around the situation in the Suez Canal as 1-2 mln barrels of oil are withheld from the market each day. There’s uncertainty regarding when the tanker will be able to be moved, some are saying next Wednesday. On the geopolitical front Saudi Arabia proposed a peace initiative to the Houthis in order to try and reduce the drone attacks, however, with recent drone attacks after this announcement it seems like it fell on deaf ears. There is also all that floating storage from last year as we hit tank tops that is now being unwound back into the market. Another factor increasing supply is Iranian oil gushing into China despite US sanctions. API and the DOE both showed chunky oil inventory builds despite expectations for a draw – DOE +1.912mm (-900k exp) and API - +2.927mm (-900k exp). The big event for next week will be OPEC+’s meeting on Thursday. Sources out this week are leading the market to believe that another rollover to current supply cuts is the most likely outcome. With price quite a bit weaker since their last meeting this seems almost a given in my opinion.
Market participants see the recent volatile price moves as hot money moving in and out positions as opposed to a change in the fundamental picture. Price action remains stuck between $62 and $65. With a breakout either side attracting more directional momentum. Price is up almost 5% today and is hovering just under $65, the 21-day EMA and the lower line of the ascending channel. The RSI is just below the 53 resistance too.
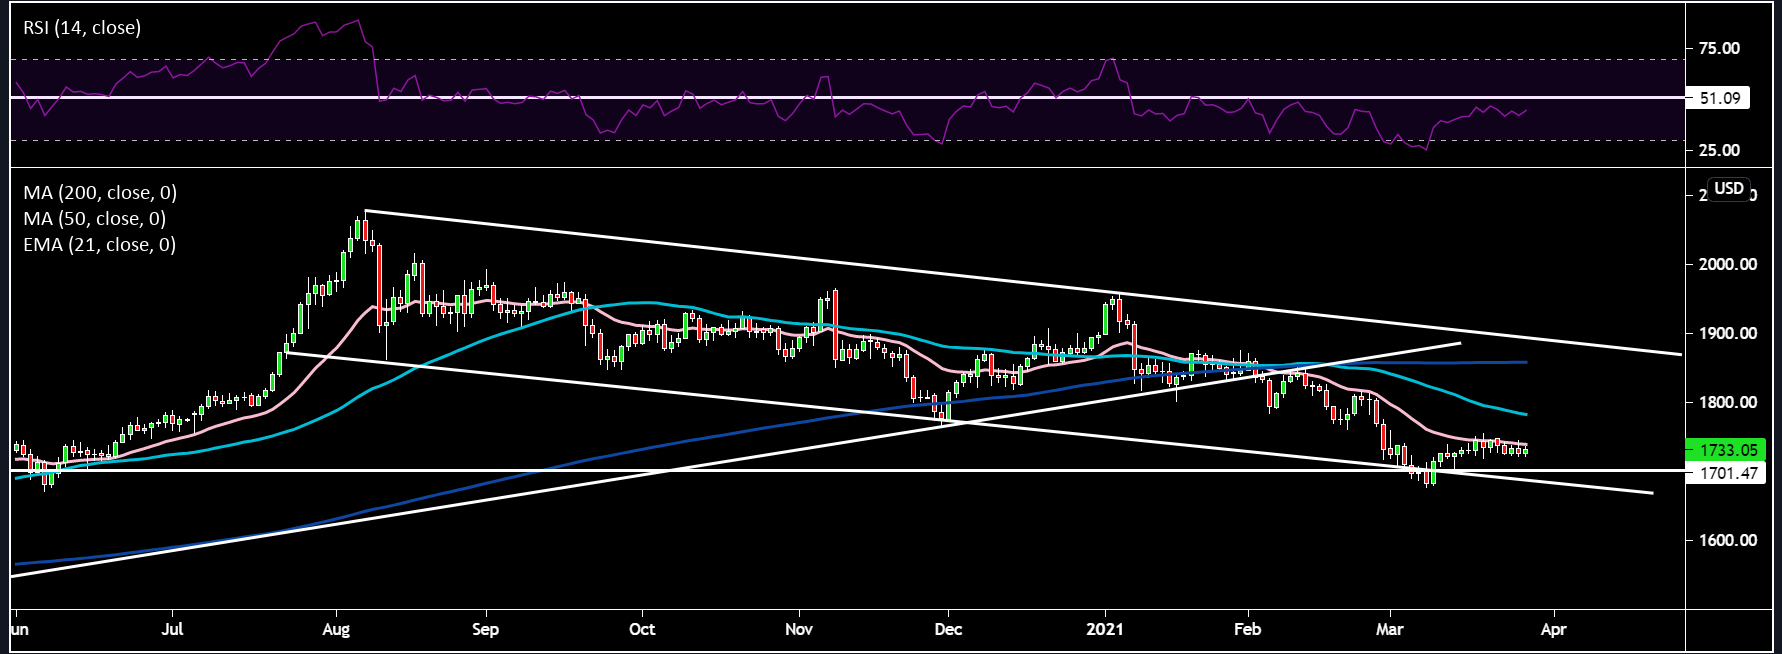
Gold:
Gold remains in a mini tight range between $1720 and $1740, capped by the 21-day EMA. Price does look like it wants to come back to the $1700 level for a test of support. I’d put gold’s resilience despite a stronger dollar down to some risk-off save haven flows and a lower real yield. Price is looking for direction as it remains below RSI resistance of 51. Weaker inflation data in the form of PCE won’t have helped gold bulls either.
Related articles


Ready to trade?
It's quick and easy to get started. Apply in minutes with our simple application process.
The material provided here has not been prepared in accordance with legal requirements designed to promote the independence of investment research and as such is considered to be a marketing communication. Whilst it is not subject to any prohibition on dealing ahead of the dissemination of investment research we will not seek to take any advantage before providing it to our clients.
Pepperstone doesn’t represent that the material provided here is accurate, current or complete, and therefore shouldn’t be relied upon as such. The information, whether from a third party or not, isn’t to be considered as a recommendation; or an offer to buy or sell; or the solicitation of an offer to buy or sell any security, financial product or instrument; or to participate in any particular trading strategy. It does not take into account readers’ financial situation or investment objectives. We advise any readers of this content to seek their own advice. Without the approval of Pepperstone, reproduction or redistribution of this information isn’t permitted.