- لغة عربية
- English
- 简体中文
- 繁体中文
- ไทย
- Español
- Tiếng Việt
- Português
A look at the decline
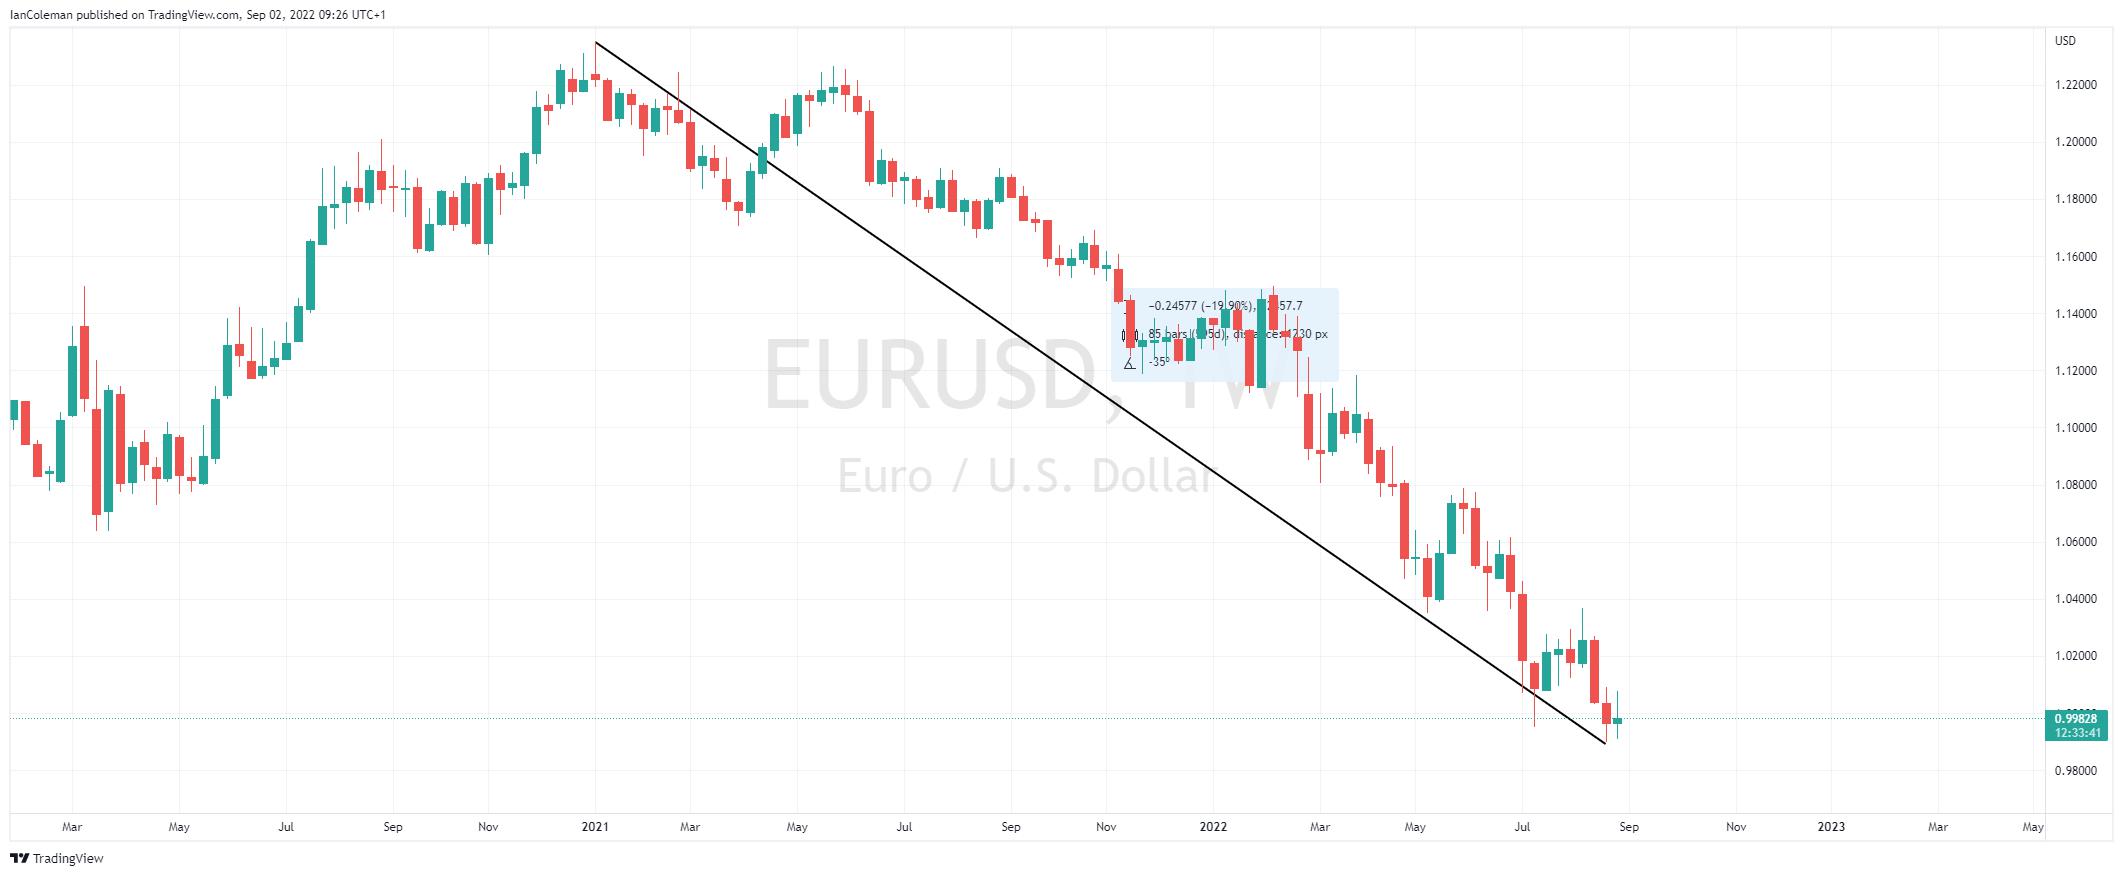
From the January 2021 peak of 1.2350 to the August 2022 low of 0.9899, we have seen a selloff of 2451 pips or just under -20% (-19.90%) in the major currency pair, the EURUSD.

Figure 1 Trading View EURUSD selloff
The fundamental drivers for the USD Dollar
We need to wind back the clock to before the US dollar 2021 base. In March 2020 the Covid-19 virus hit the headlines in Europe. The immediate panic that ensued had a positive effect for the US dollar as investors look to park their cash in safe-haven currencies, like the US dollar.
With aggressive global Central Bank action, this rally was short-lived, and the US dollar declined.
At the beginning of 2021, some normality was returning to our lives and coupled with this, investors’ expectations of a reversal in Central Bank action.
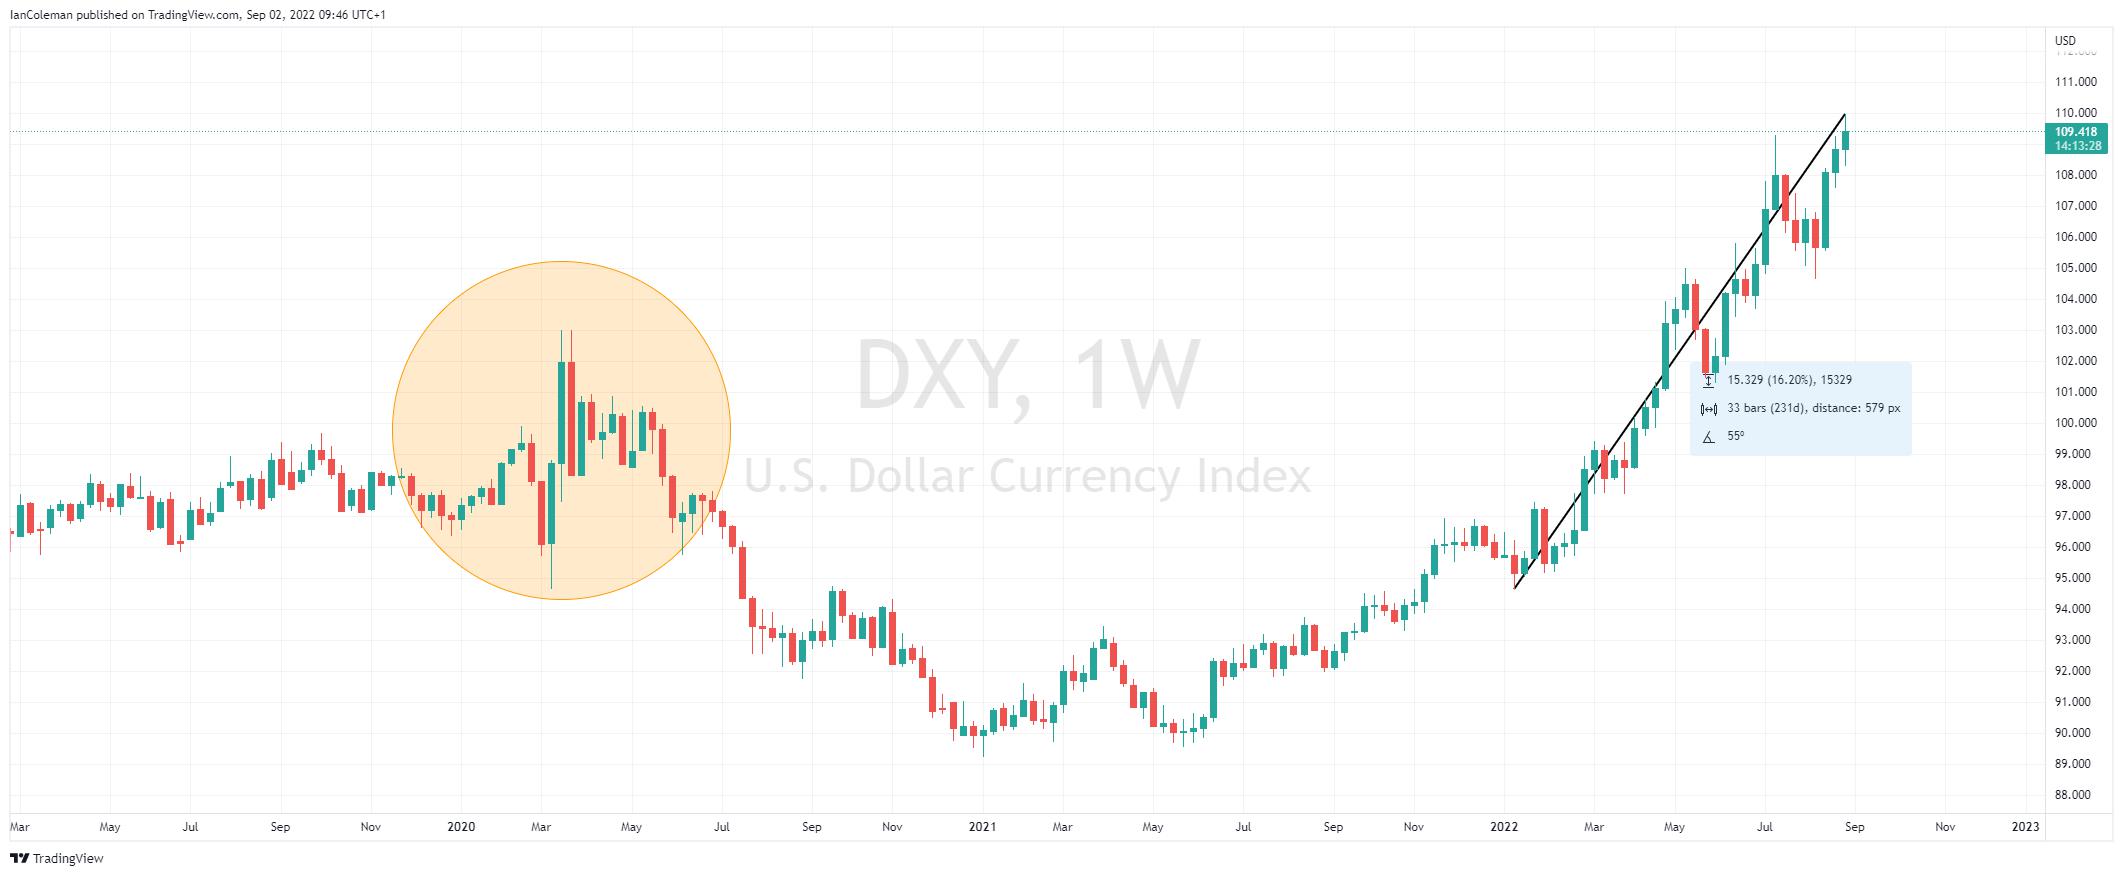
We have seen an aggressive boost to the value of the US dollar in 2022, with higher commodity prices, high inflation, and an aggressive interest rate policy from the Fed.

Figure 2 Trading View DXY 2022 rally
The fundamental drivers for the Euro
The Euro has been the hardest hit by the Ukraine war. It has resulted in an energy crisis that could plummet the Eurozone into a deep and prolonged recession.
Christine Lagarde, the ECB president, is juggling high inflation while trying not to dampen growth.
This has resulted in some thinking that the European Central Bank is behind the curve in raising rates.
A look at EURUSD from a technical viewpoint.
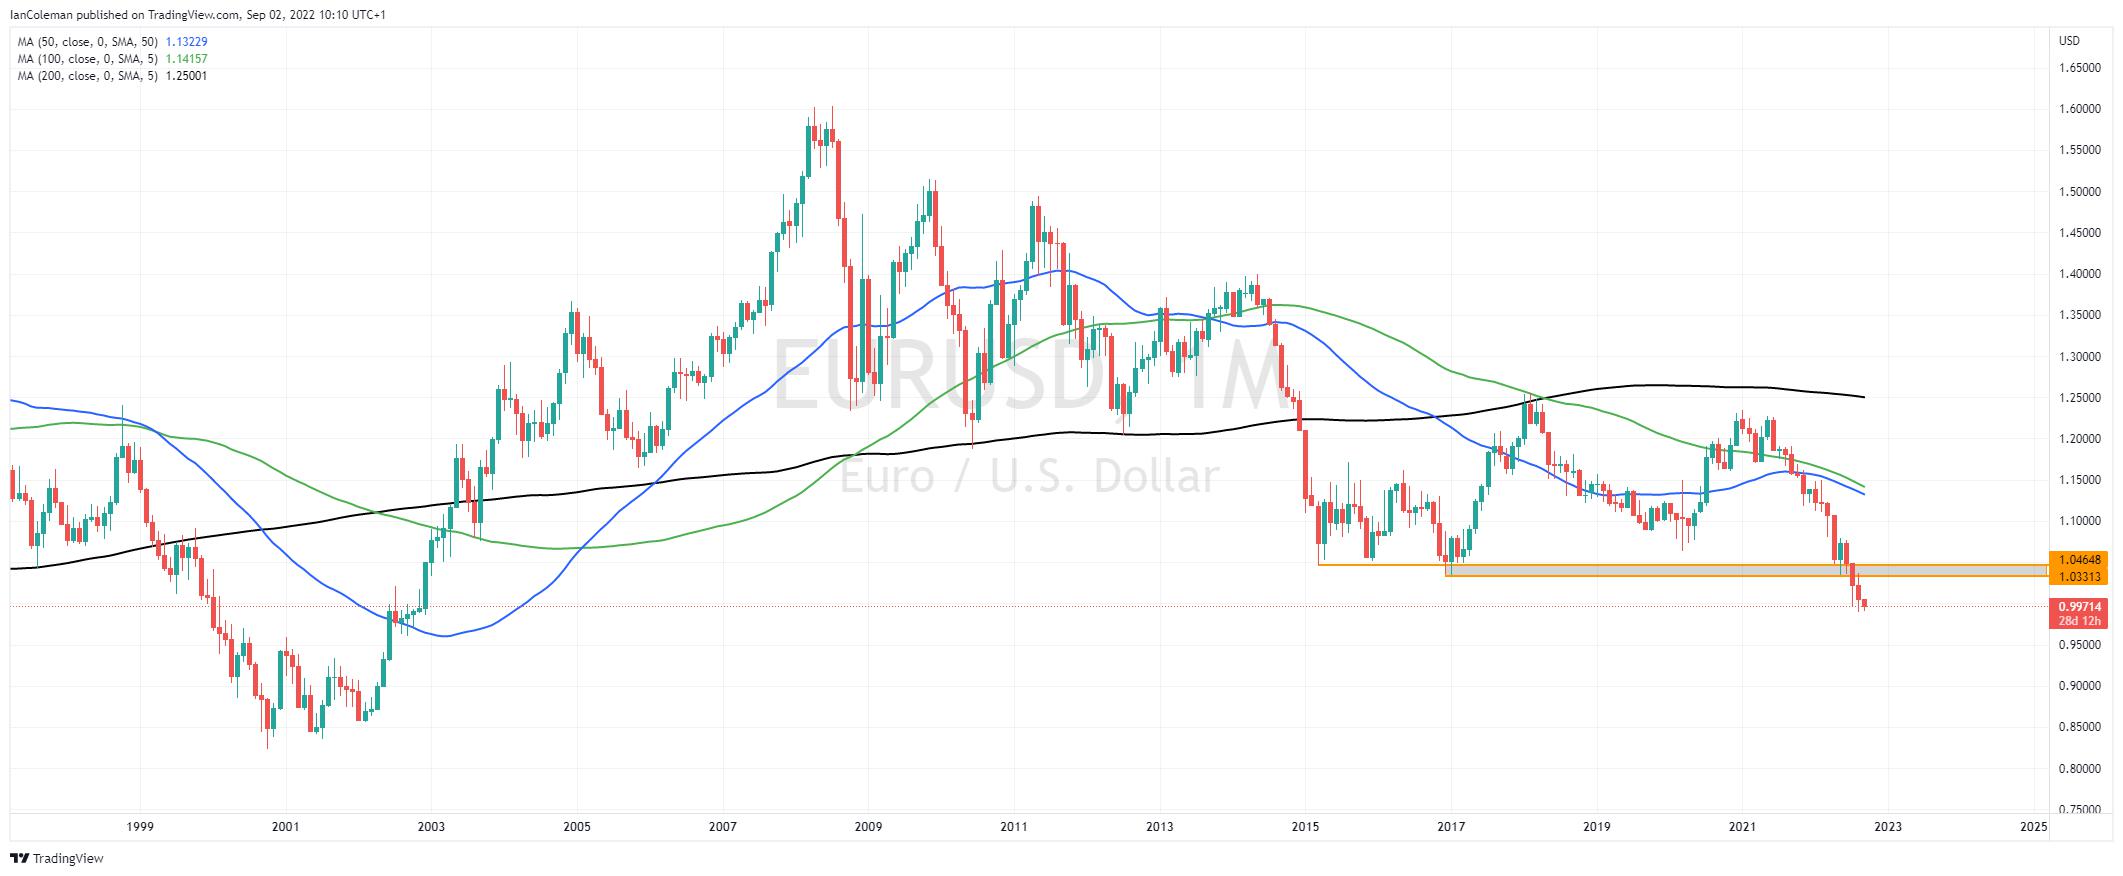
The negative price action in August resulted in EURUSD trading to the lowest level since December 2002, 236 months ago.
Using smoothing indicators, such as moving averages (the 50 Blue, 100 Green and 200 Black), we can clearly see EURUSD is a downward trend.
Although there have been some signs of the US dollar rally faltering, A break of the 1.0330 – 1.0470 range is needed before investors might consider a turn in long-term sentiment.

Figure 3 Trading View EURUSD monthly chart
On a final note, It’s worth keeping an eye on sentiment as many people are likely finding the dip a bargain to buy. Eventually, there will be a squeeze which could see a sudden run higher in prices.
Related articles
لا تُمثل Pepperstone أن المواد المقدمة هنا دقيقة أو حديثة أو كاملة، وبالتالي لا ينبغي الاعتماد عليها على هذا النحو. البيانات، سواء كانت من جهة ثالثة أو غيرها، لا يجب اعتبارها توصية؛ أو عرض لشراء أو بيع؛ أو دعوة لعرض لشراء أو بيع أي أمان، منتج مالي أو صك؛ أو المشاركة في أي استراتيجية تداول معينة. لا تأخذ في الاعتبار الوضع المالي للقراء أو أهداف الاستثمار الخاصة بهم. ننصح أي قارئ لهذا المحتوى بطلب نصيحته الخاصة. بدون موافقة Pepperstone، لا يُسمح بإعادة إنتاج أو إعادة توزيع هذه المعلومات.


