- لغة عربية
- English
- 简体中文
- 繁体中文
- ไทย
- Español
- Tiếng Việt
- Português
Some basic information about ANZ
ANZ stands for The Australia and New Zealand Banking Group Limited. The short code is ANZ. They are Australia’s second largest bank by assets and fourth largest by market cap. We are going to break down ANZ share price from a fundamental and technical standpoint.

Figure 1 Trading View ANZ Market Cap
The 2020 rally in the ANZ share price
The Australian Banking sector performed robustly in 2020, and ANZ was no exception to this rule. ANZ shares witnessed a rally of +110% from the March 2020 low of 13.99 AUD to the high print of 29.41 AUD in June 2021.
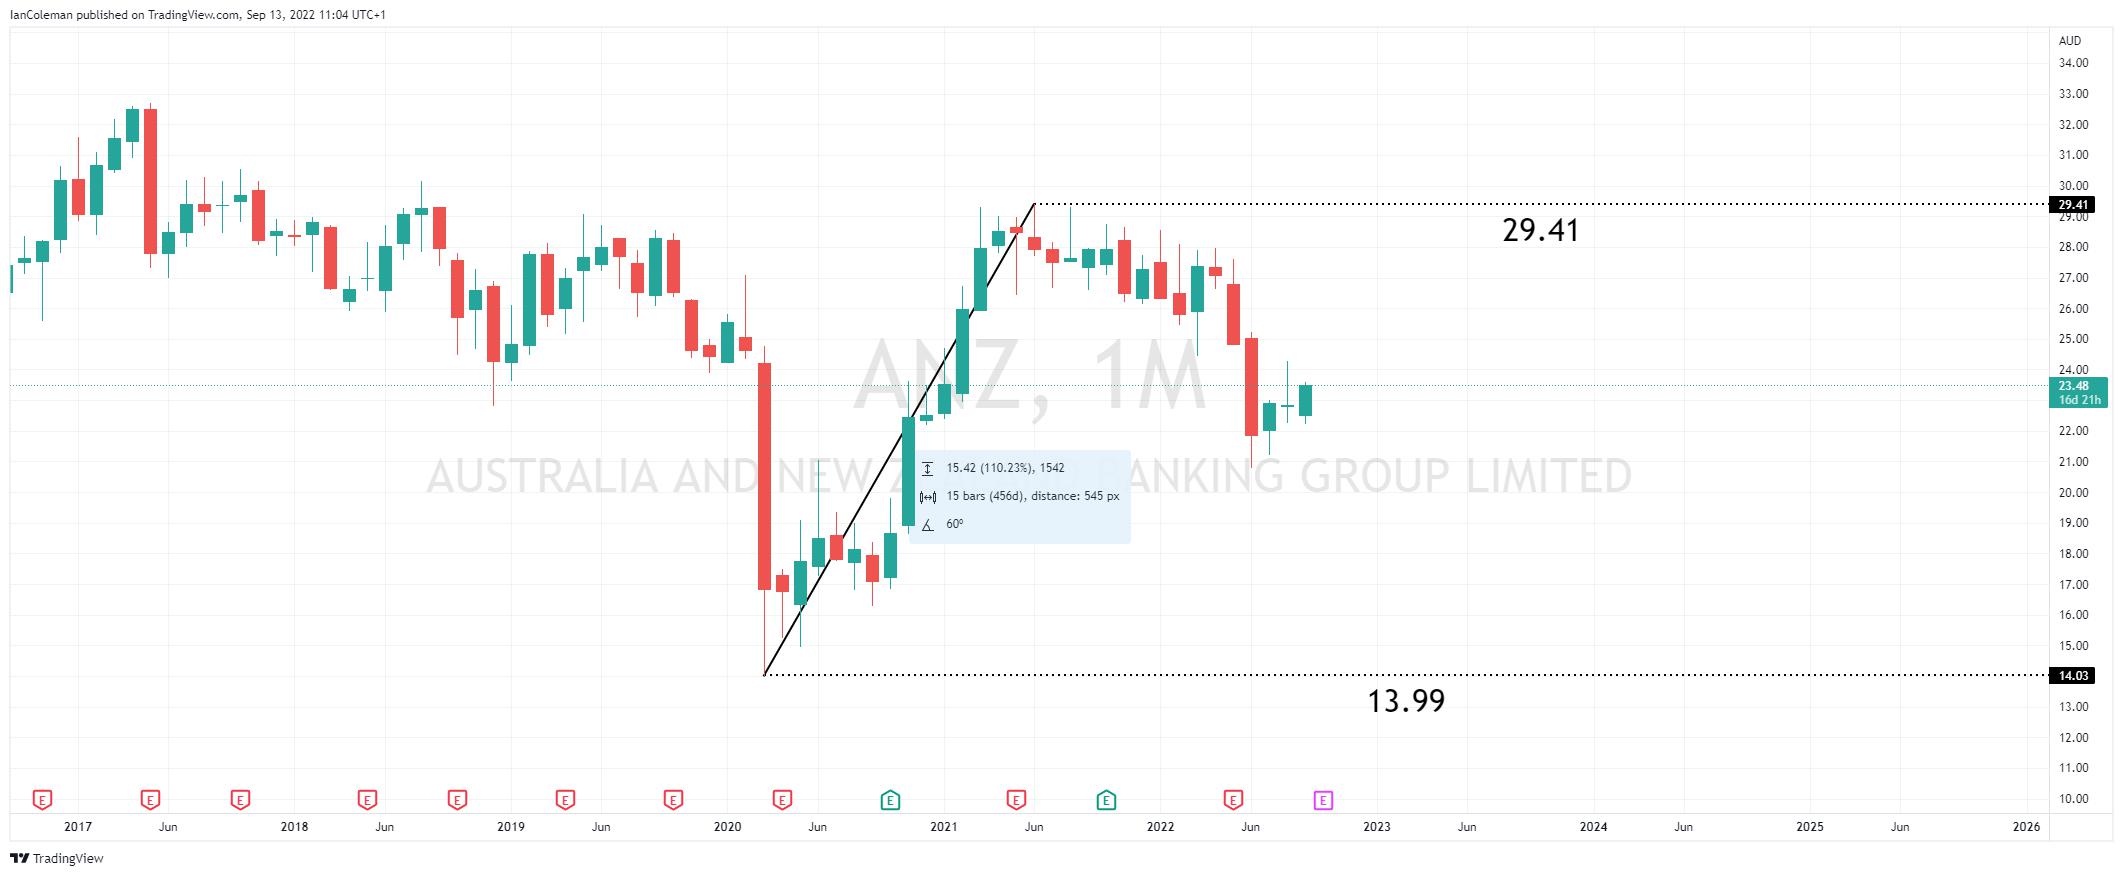
Figure 2 Trading View ANZ 2020 rally
It should be noted that ANZ has only beaten earnings expectations twice in the last 12 reports. The next report is due on the 22nd of October 2022.
The 2022 half year results were published on the 4th of May 2022, just before the last decline in the ANZ share price.
ANZ announced a Statutory Profit after tax for the half year ended 31 March 2022 of $3,530 million, up 10% on the previous half. Cash Profit from continuing operations was $3,113 million, down 3% when compared with the prior half. ANZ’s Common Equity Tier 1 Ratio was strong at 11.5% and Cash Return on Equity was 10%. The proposed Interim Dividend is 72 cents per share, fully franked.
A look from a technical perspective
Looking at the monthly chart from a technical perspective, we can note an Expanding Wedge pattern. This has an eventual bias to beak to the upside. Trend line resistance is currently located at 28.07. A breach there, and the measured move target is 39.96.
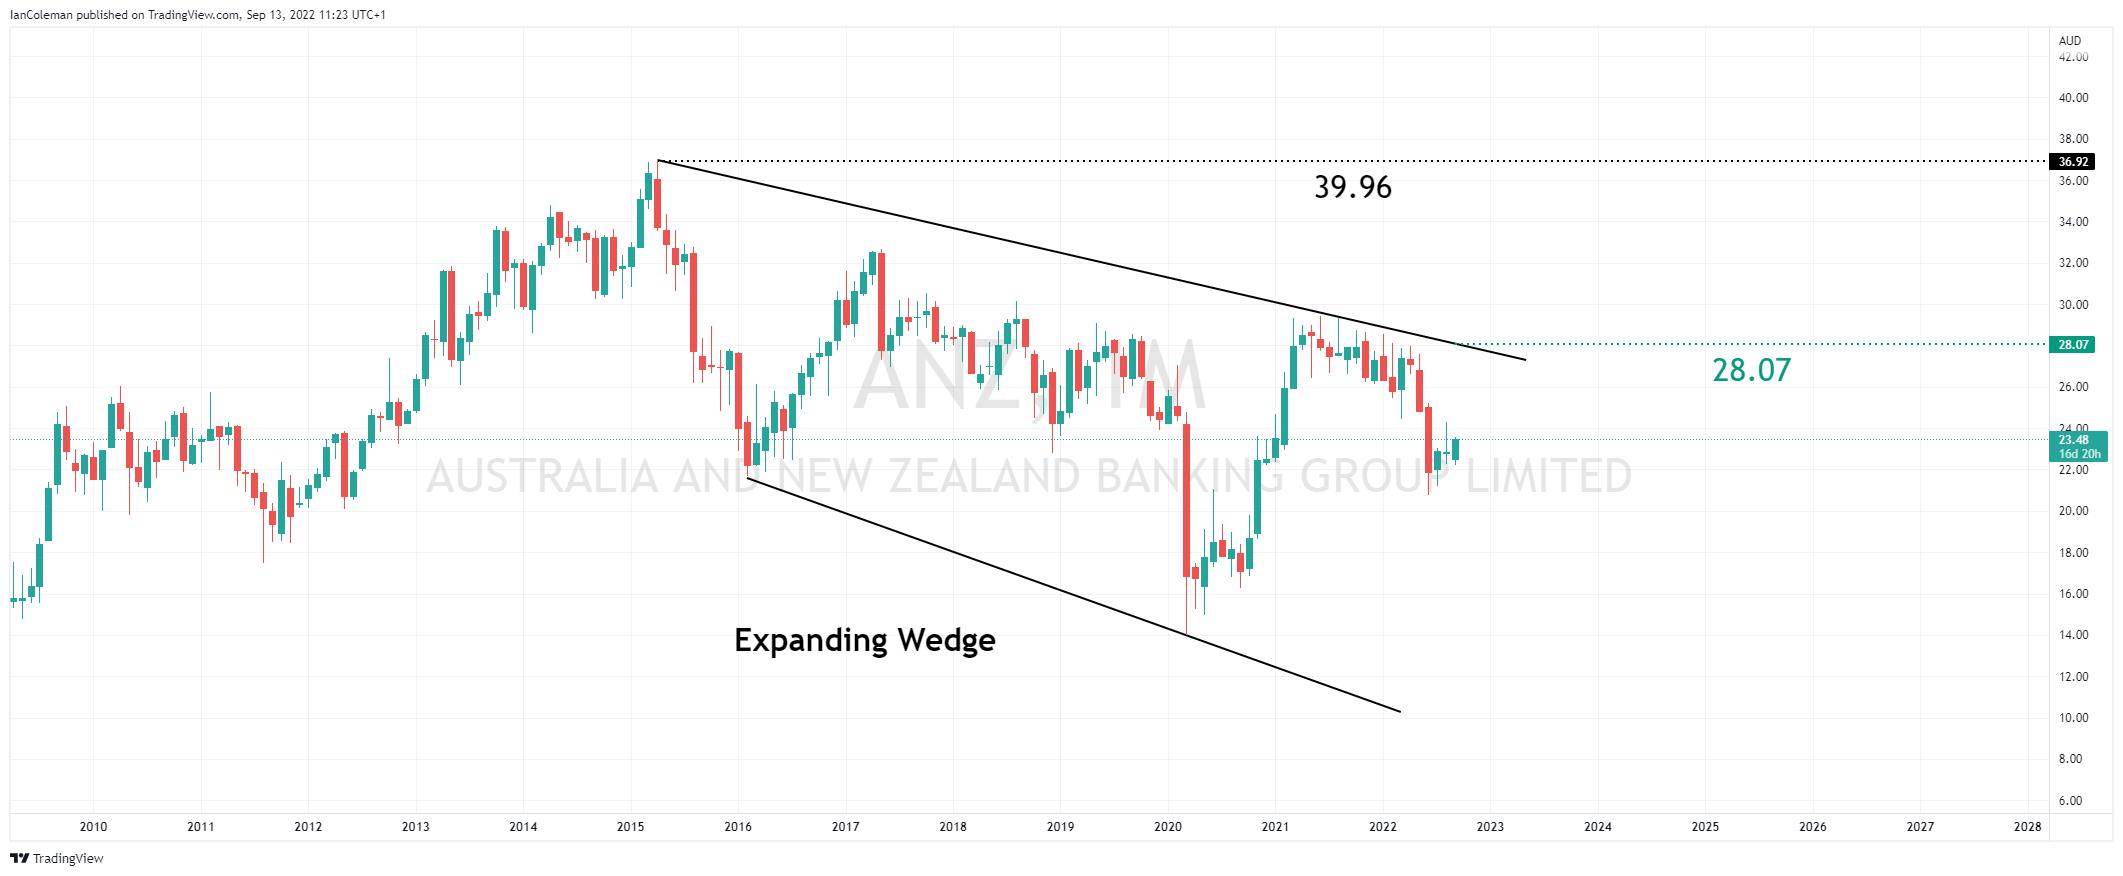
Figure 3 Trading View Monthly ANZ Expanding Wedge
We have seen a move to the upside from levels close to 21.05. This was a previous swing high from June 2020. What acted as resistance, now acts as support.
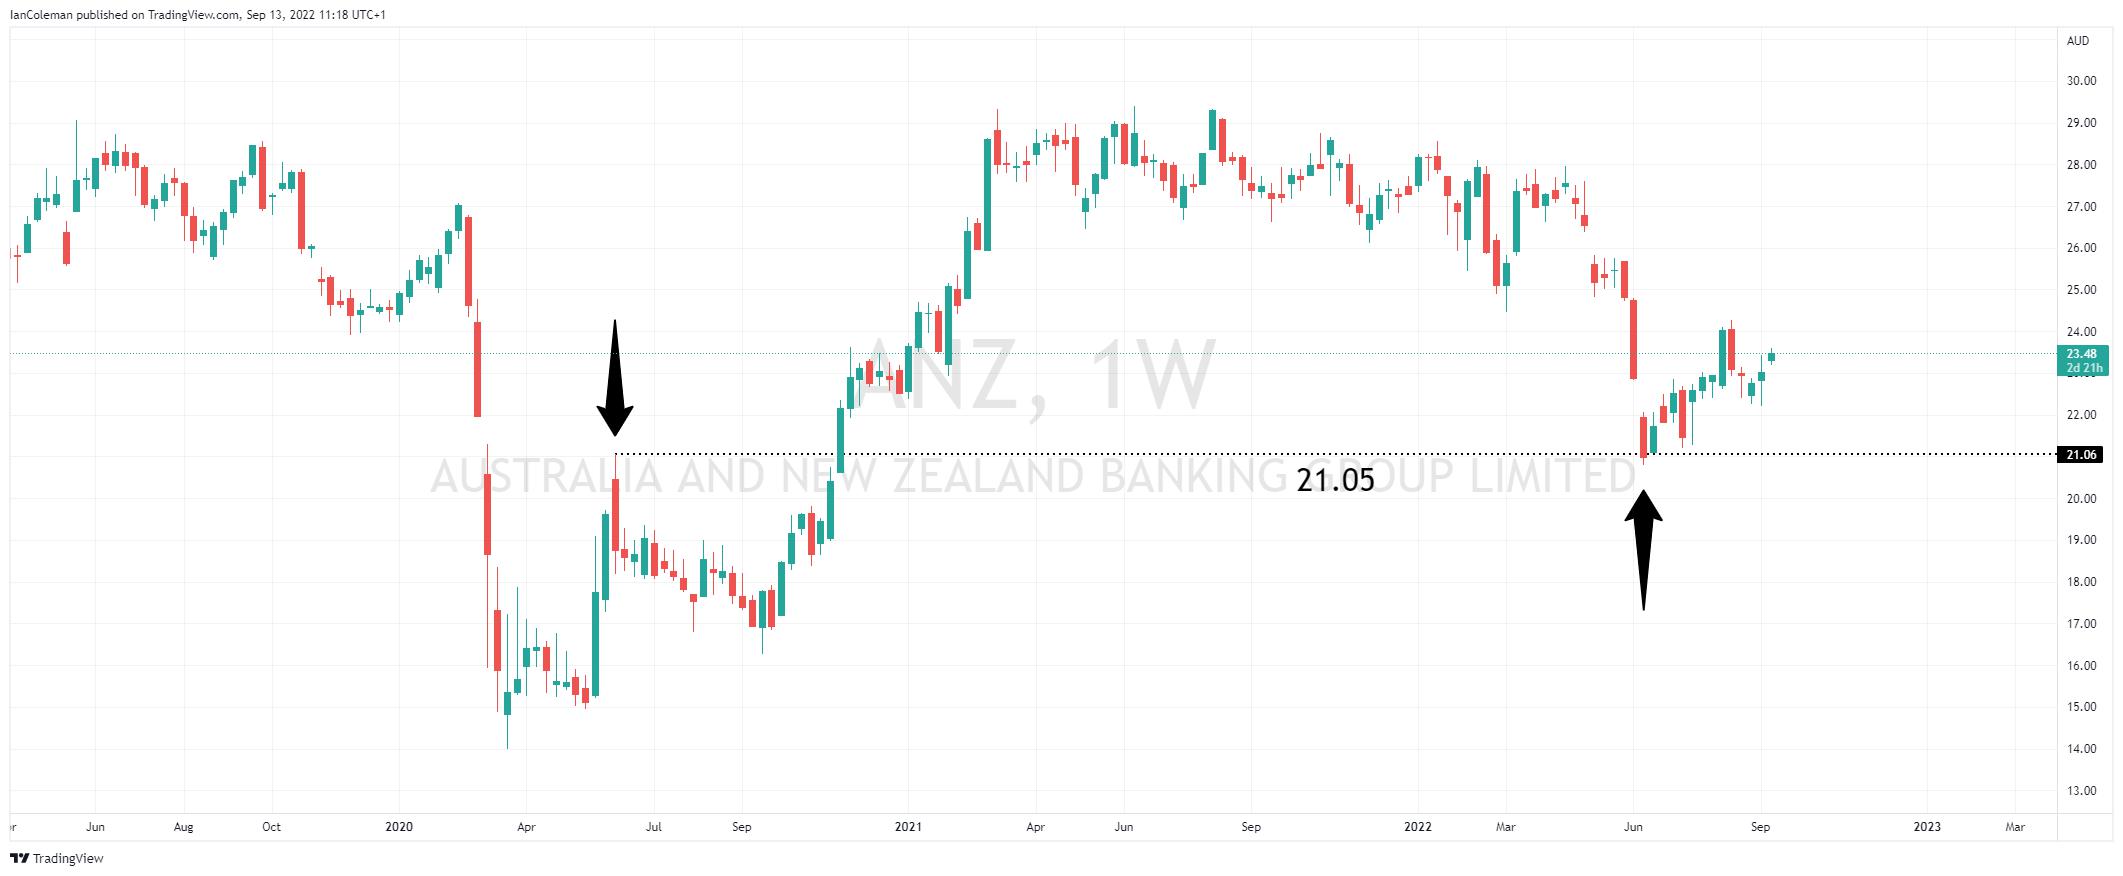
Figure 4 Trading View Weekly ANZ 21.05 being pivotal
A look from an Elliott Wave perspective, and the last move higher can be seen in 5-waves. That would suggest that the current move lower is corrective.
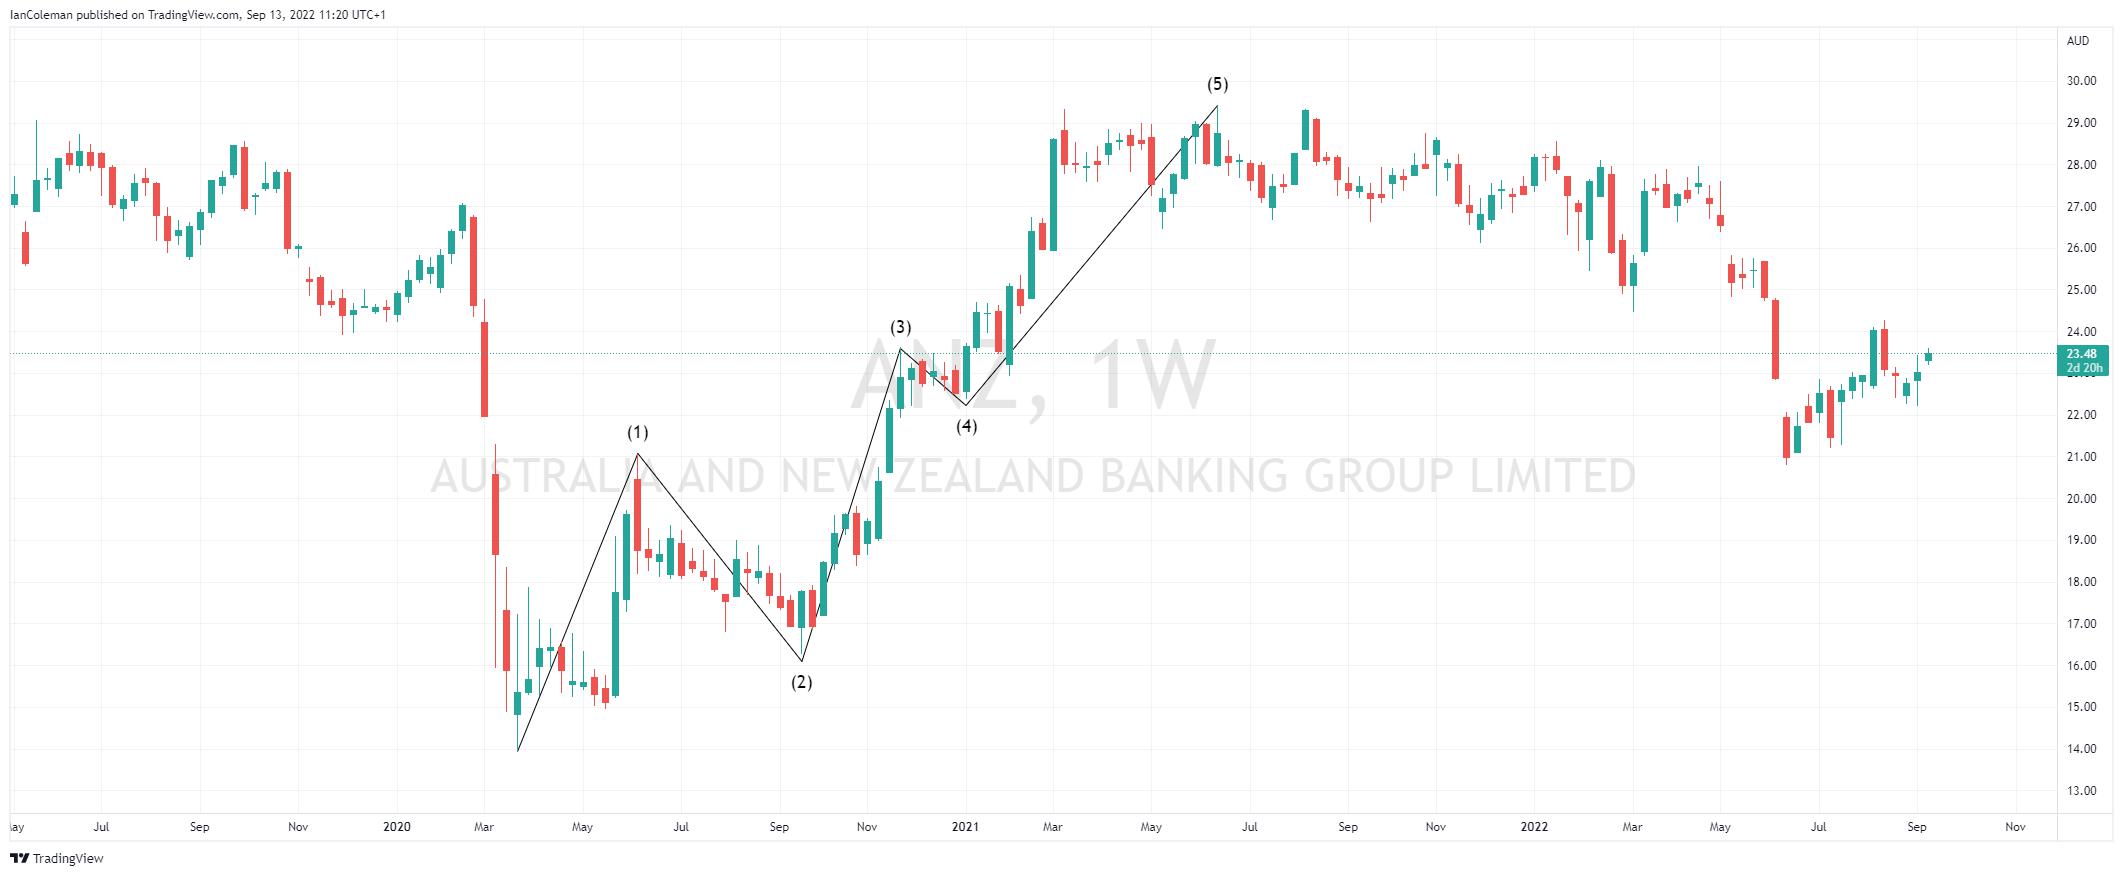
Figure 5 Trading View Weekly ANZ 5-wave pattern
Corrective formations are normally in a 3-wave pattern. There is the potential for a bullish Bat Cypher formation to complete between 15.71 and 15.55.
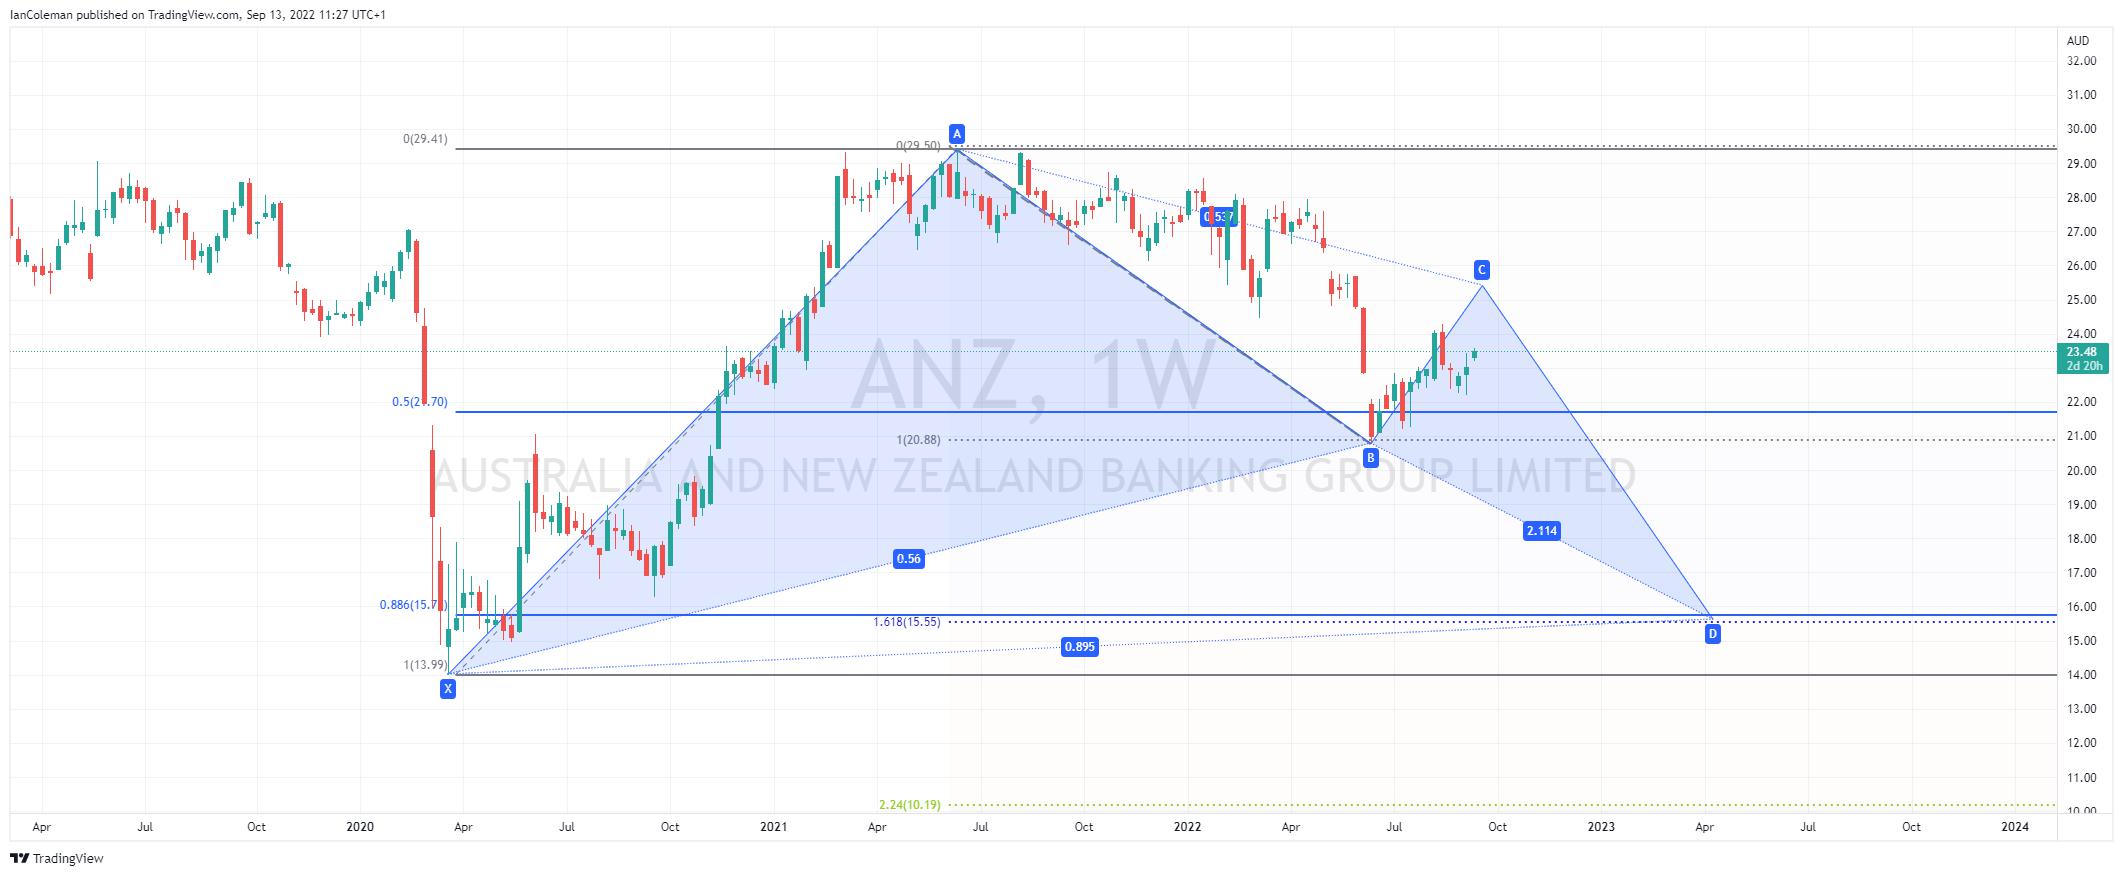
Figure 6 Trading View Weekly ANZ Possible Bat formation
Related articles
لا تُمثل Pepperstone أن المواد المقدمة هنا دقيقة أو حديثة أو كاملة، وبالتالي لا ينبغي الاعتماد عليها على هذا النحو. البيانات، سواء كانت من جهة ثالثة أو غيرها، لا يجب اعتبارها توصية؛ أو عرض لشراء أو بيع؛ أو دعوة لعرض لشراء أو بيع أي أمان، منتج مالي أو صك؛ أو المشاركة في أي استراتيجية تداول معينة. لا تأخذ في الاعتبار الوضع المالي للقراء أو أهداف الاستثمار الخاصة بهم. ننصح أي قارئ لهذا المحتوى بطلب نصيحته الخاصة. بدون موافقة Pepperstone، لا يُسمح بإعادة إنتاج أو إعادة توزيع هذه المعلومات.


