Wall St: Not Just A Magnificent Seven Story Anymore

Having rallied, broadly, in line with each other for much of 2023, the handful of equities in question – Apple, Amazon, Alphabet, Meta, Microsoft, Nvidia and Tesla – have performed in a far from uniform way since the turn of the year.
_mag_7_2024-02-07_18-18-59.jpg)
While Nvidia continues to benefit from the ever-increasing frenzy around AI, and Meta has performed strongly, boosted by blowout Q4 earnings, and the announcement of the firm’s first ever dividend payment, other names in this grouping have performed in a decidedly more ordinary manner.
Both Alphabet and Apple have failed to outperform the S&P 500 on a YTD basis, the former owing to significantly poorer than expected Q4 advertising revenue, and the latter amid a handful of broker downgrades, amid ongoing demand worries, particularly in China. The standout laggard, however, is Tesla, which stands as the worst performer in the S&P 500, trading over 25% lower YTD, amid a plethora of issues ranging from waning EV demand to long-running concerns over corporate governance.
Many, therefore, are beginning to wonder whether the ‘magnificent seven’ should be renamed the ‘super six’, ‘fab five’, ‘fantastic four’, or any other moderately cringeworthy moniker that could reasonably be used for a group of booming megacap equities – answers on a postcard, please!
On a more serious level, and keeping that grouping as a seven for now, it’s noteworthy how the tech behemoths haven’t outperformed the broader market to anywhere near the same degree as seen during 2023.

This hints at a broader theme, in that the equity rally seen so far in 2024 has been significantly more broad based than that which came last year. A simple look at the performance of various sectors this year evidences this well.
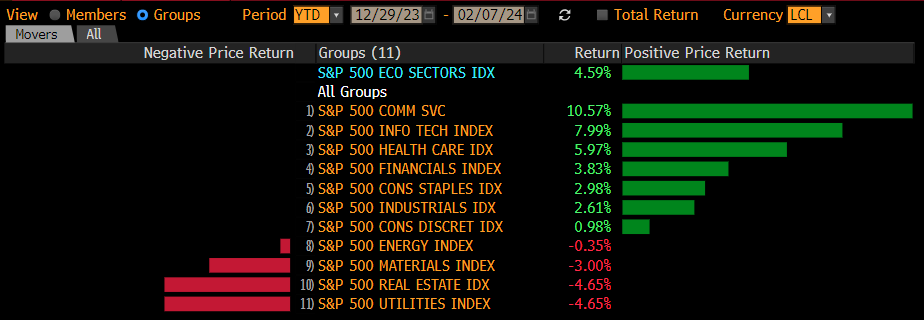
On the whole, that sector breakdown is largely what you would expect in the current macro environment – where the US economy looks set to stick the much-anticipated ‘soft landing’, and Fed policymakers have struck a relatively hawkish tone, pushing back on the idea of cuts in Q1, sparking a repricing of the USD OIS curve, and a kick higher in yields across the Treasury curve.
Naturally, financials should benefit from such an environment, while you’d also expect real estate and utilities to soften, as has occurred. In any case, it’s nice to get a long-overdue reminder that, despite recent form, the US equity market isn’t only about tech.
There are other signs that also point to a differing dynamic under the market’s surface, and better overall breadth. While there are many ways to measure such a concept, perhaps the simplest in any given index is to simply look at the proportion of constituents trading above a given moving average; I’ve used the 200-day MA here, simply due to its prowess in gauging longer-run momentum.
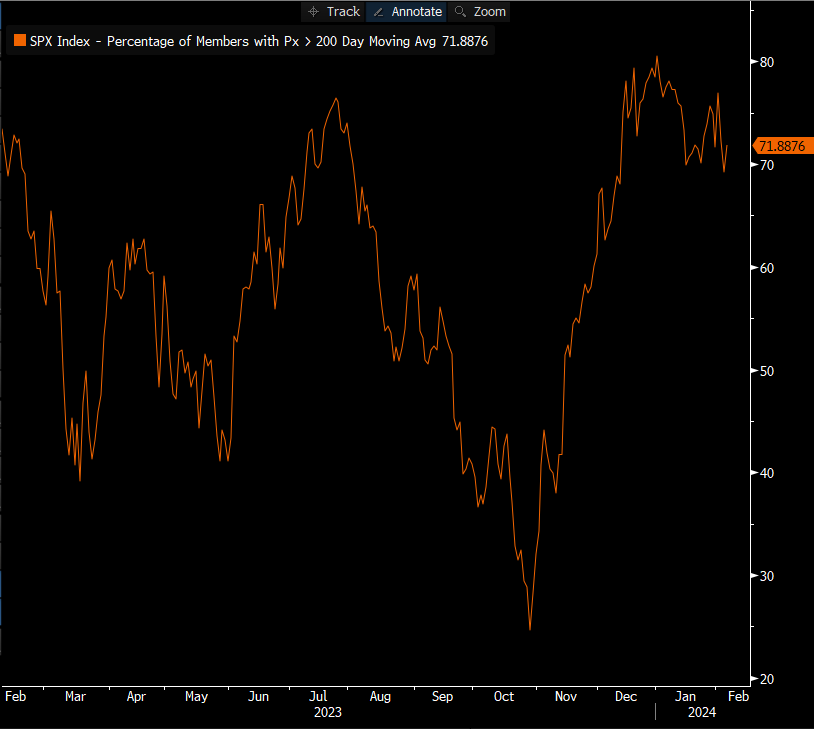
Clearly, the above shows the rally being relatively broad based, with well over 70% of S&P 500 members trading above said long-run average. Other indicators tell a similar story, including the advance-decline ratio, and the % of index members printing new all-time highs, with around 10-15% of index members having printed new 52-week highs on a daily basis since the middle of last month.
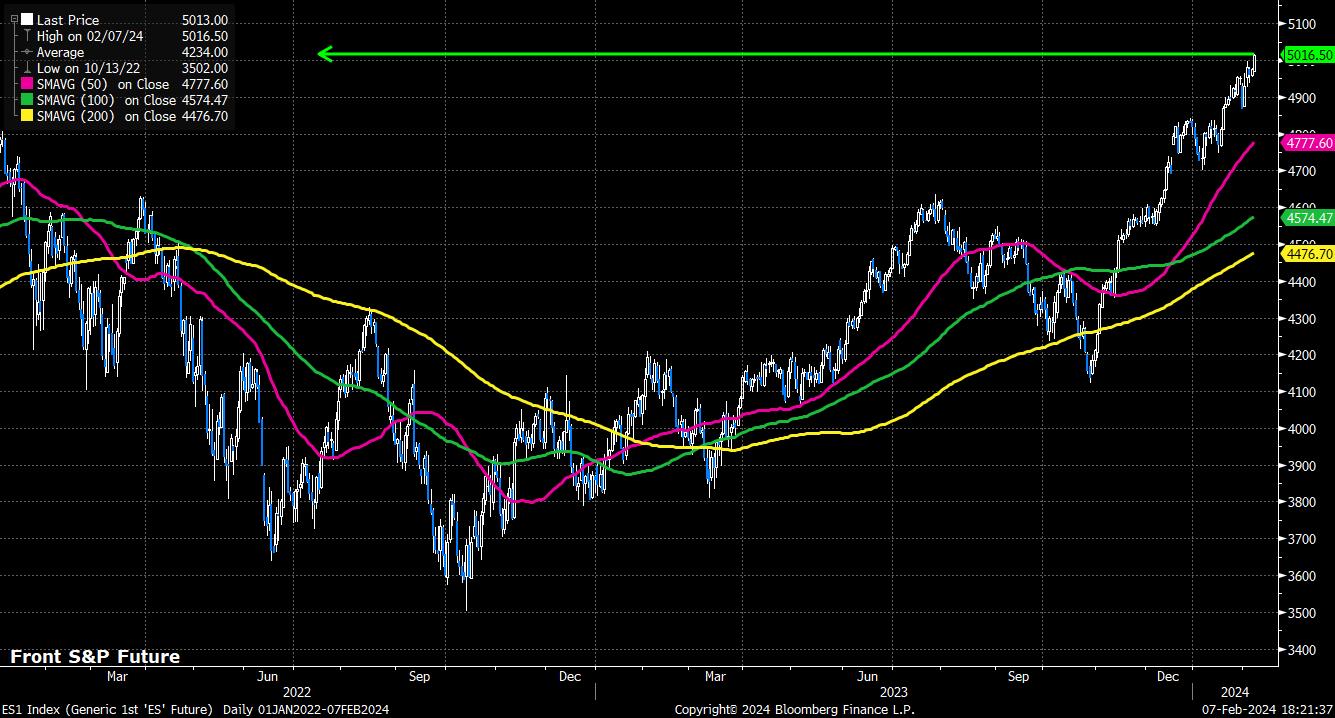
There is a case, however, to say that while all of the above is interesting, all one really needs to look at is price to gauge where the market may be heading. On that note, both the S&P 500 and Nasdaq 100 trade at fresh record highs, with the front S&P contract now trading north of the 5,000 mark for the first time ever. As has often been stated in these columns, there are few more bullish signs than a market printing fresh records.
Related articles


Pepperstone不代表這裡提供的材料是準確、及時或完整的,因此不應依賴於此。這些資訊,無論來自第三方與否,不應被視為建議;或者買賣的提議;或者購買或出售任何證券、金融產品或工具的招攬;或參與任何特定的交易策略。它不考慮讀者的財務狀況或投資目標。我們建議閱讀此內容的讀者尋求自己的建議。未經Pepperstone的批准,不允許複製或重新分發此信息。