Takeaways From A UK Data Deluge

First things first, we start with the latest jobs figures. Per the latest ONS figures, unemployment fell to 3.8% in the three months to December, an 0.1pp decline from the prior three month period, and substantially below consensus estimates of a rise to 4.0%, indicating that the labour market remains, at face value, relatively tight.
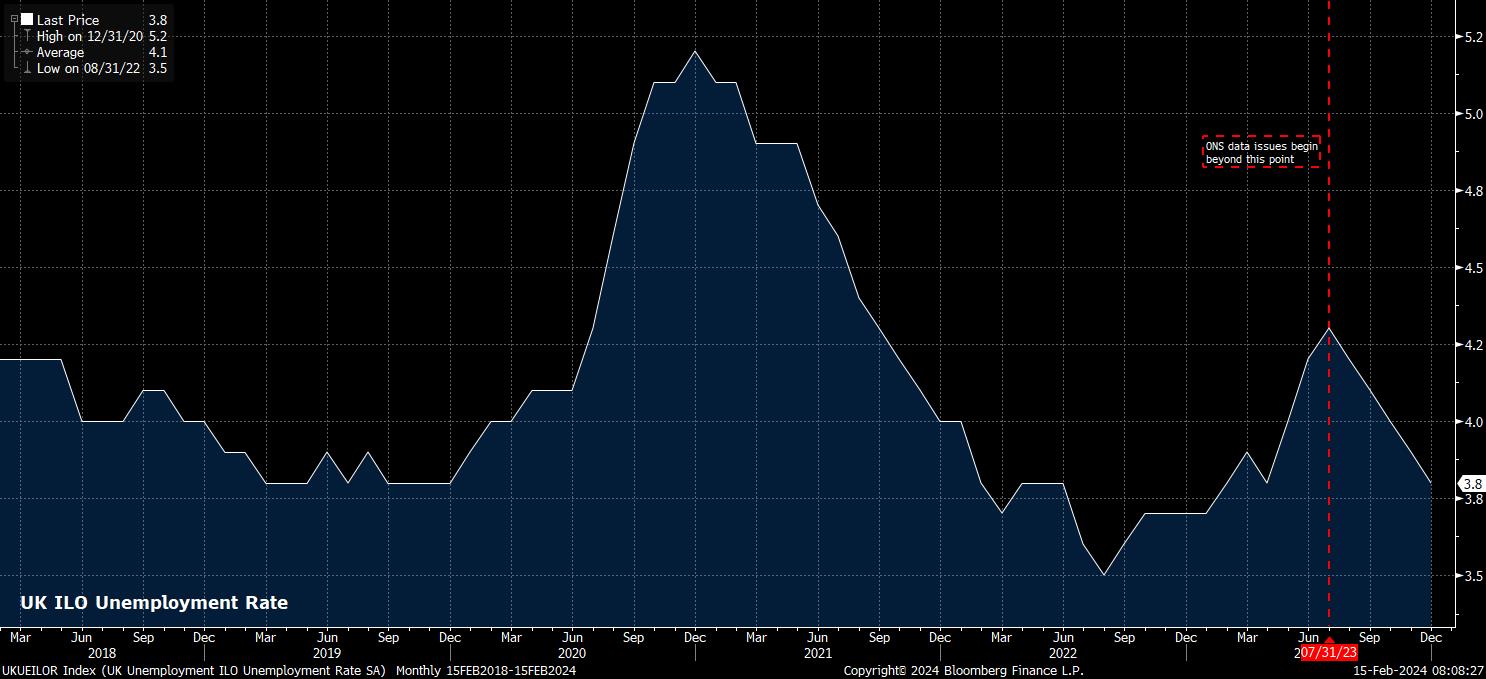
The ‘face value’ remark there is important as, since last September, the ONS employment data has been incredibly volatile, and highly unreliable, owing to falling survey response rates sparking a change in the methodology behind the compilation of the Labour Force Survey (LFS). While the agency are no longer calculating ‘experimental’ figures, the fully revamped LFS will not be published until next September, leaving UK economists, policymakers, and market participants ‘flying blind’ about the true state of the labour market for an entire year, at a crucial time as inflation falls back towards target, and the economy enters the latter stages of the cycle. This is, frankly, nothing short of farcical.
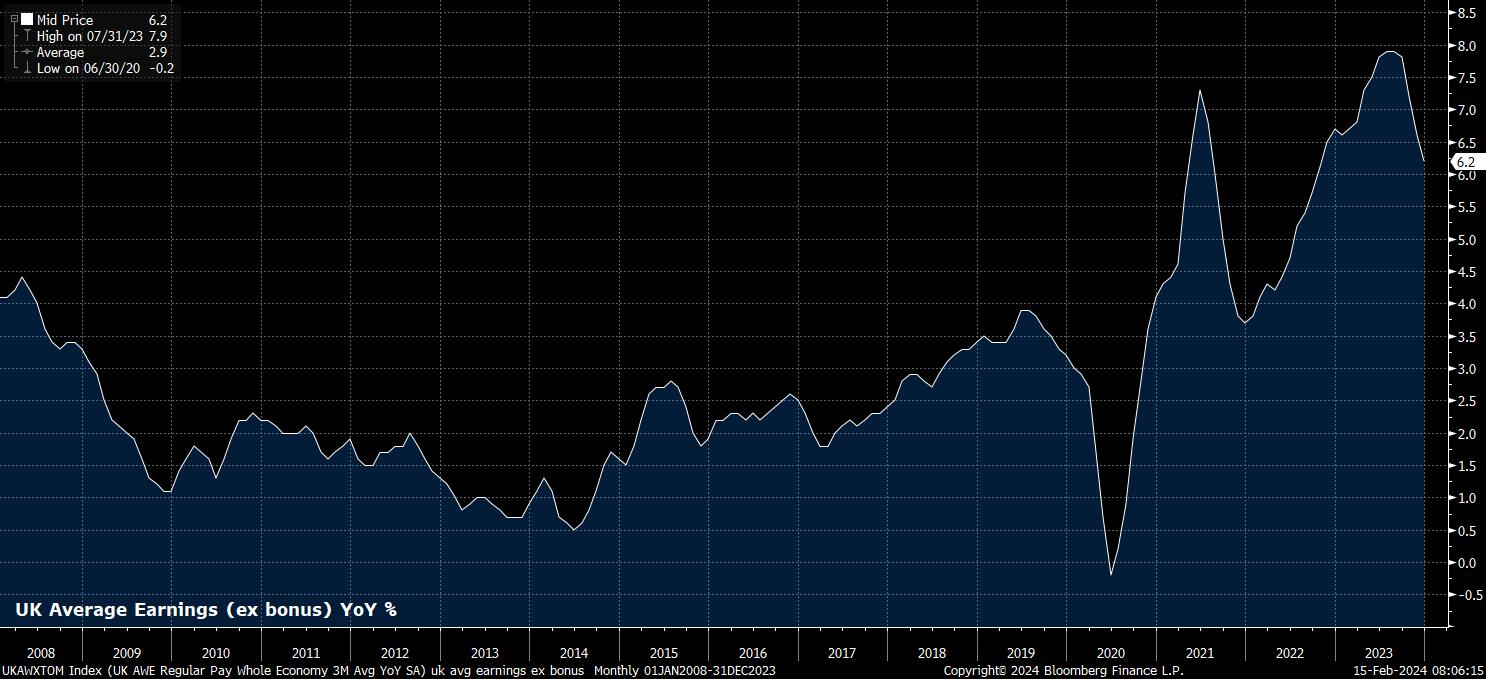
Thankfully, the earnings component of the jobs data is not impacted by the aforementioned data collection issues, helping to provide at least some idea of potential inflationary pressures that may well be continuing to bubble away.
Unfortunately, the December labour market figures showed that said pressures are still bubbling significantly more than most would desire, with earnings continuing to rise at a pace incompatible with a return to the BoE’s 2% inflation aim. Total earnings rose 5.8% on the year as 2023 drew to a close, while earnings excluding bonuses rose 6.2% YoY – both, to be clear, a cooling on the pace seen in December, but both also rather too high for the liking of policymakers on Threadneedle Street.
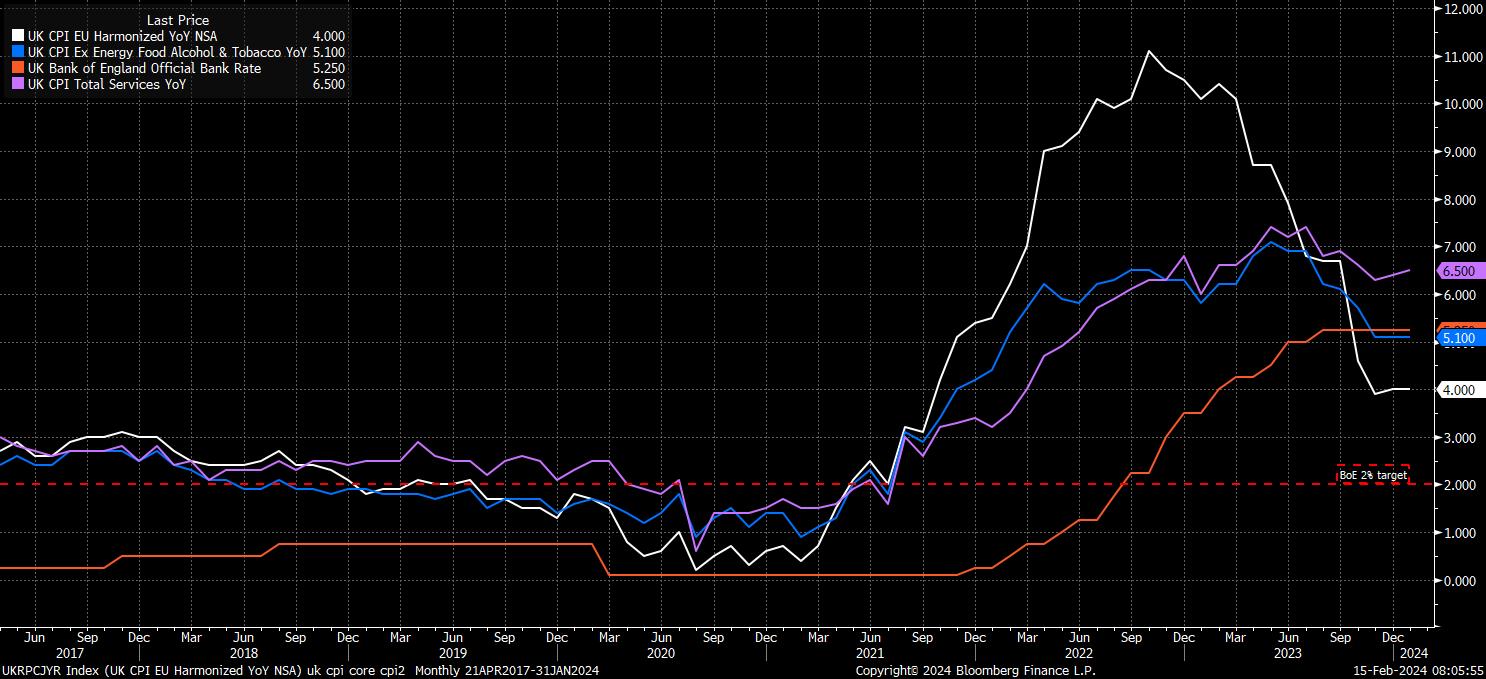
Nevertheless, on the note of inflation, the January CPI report did bring some better-than-expected news in terms of price pressures.
Headline CPI rose 4.0% YoY to start 2024, unchanged from the pace seen in December, and a touch cooler than the uptick to 4.1% that consensus had expected. Meanwhile, the all-important core CPI measure was also unchanged at 5.1% YoY, though the CPI services gauge – something keenly watched as a gauge of ‘stickiness’ by the MPC’s hawks, did rise 0.1pp to 6.5% YoY.
While some may be discouraged by CPI having remained at double the MPC’s target for the second month running, it is important to contextualise the data. In fact, the inflation figures are somewhat more positive than they would appear at first glance, particularly considering the plethora of upward impulses – including the energy price cap rise, increase in alcohol prices, and unfavourable base effects from 2023 – that all influenced the figures.
Nevertheless, it is, still, far too early to declare victory over inflation, and far too premature to be sure that the UK is ‘out of the woods’ when it comes to price pressures making a resurgence.
As Tuesday’s data showed, earnings pressures remain elevated, while services inflation has remained north of 6% since August 2022, and shows little sign of significant progress back towards target. The same can be said for core CPI, which has now been north of the 5% mark for two years, and where disinflationary progress also appears to have stalled. Headline CPI is likely to return, briefly, to 2% in the spring, though sustainable achievement of the price target is likely to remain elusive, with risks to the inflation outlook still skewed to the upside.
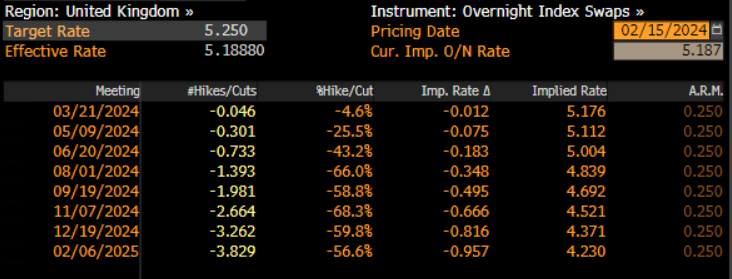
Markets, then, may still be rather over-excitable in pricing around 80bp of cuts from the BoE by the end of the year, though current expectations that the first cut will come in August – of course, when a Monetary Policy Report will be published – seem fairer.
Perhaps one reason for the relatively dovish policy expectations is the relatively poor GDP figures that were also released this week, with STIRs having rallied a touch in reaction to the data.
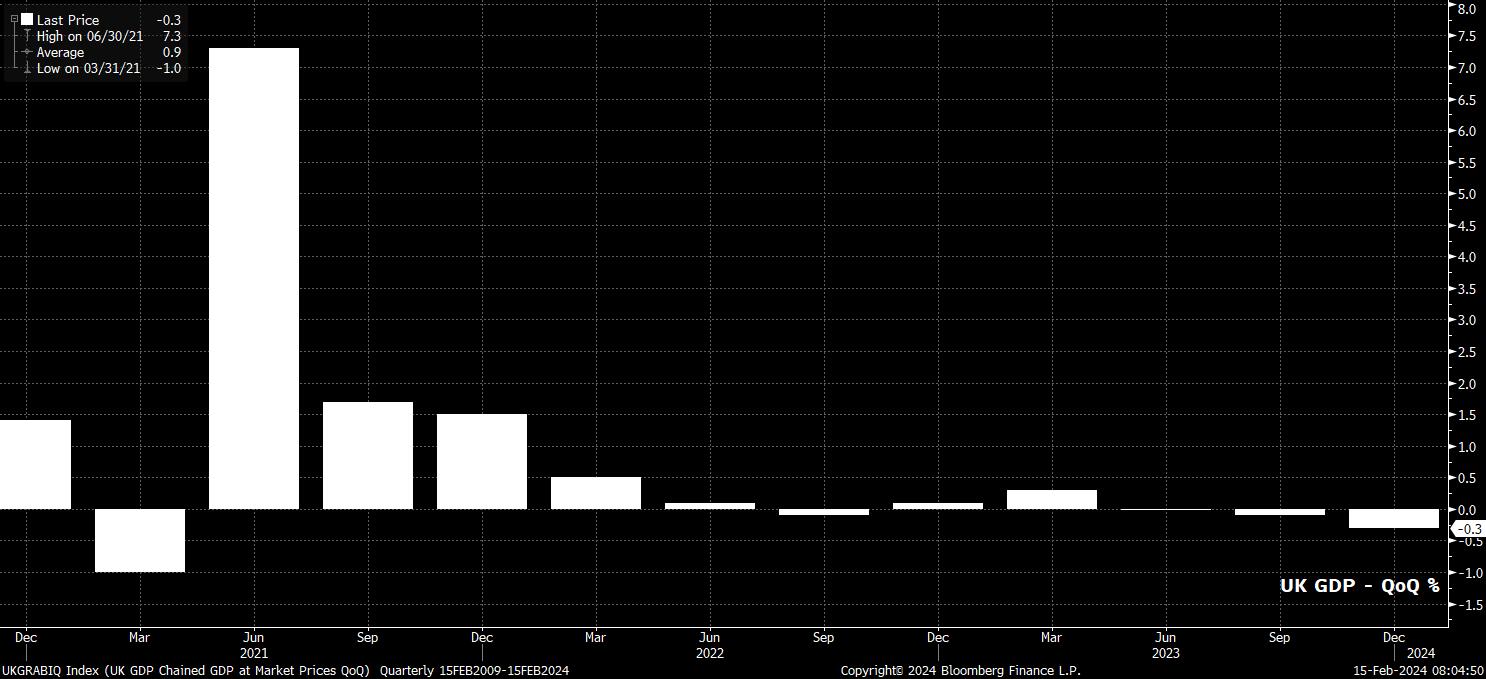
The first estimate of fourth quarter growth surprised to the downside, pointing to the economy having contracted by 0.3% QoQ in the final three months of 2024, confirming that the UK economy slipped into a technical recession (two straight quarterly contractions) at the end of last year.
Of course, this, and the subsequent media frenzy over the big, scary ‘R’ word begs the question as to whether we should really care? In short, no we shouldn’t.
There are a handful of reasons for this.
Firstly, GDP is a lagging indicator, which is subject to many revisions in the years following the initial estimate being released. Hence, there is a strong chance that the recession declared today, will be revised away at some point in the future, long after headlines about it have fallen off the front pages. The so-called ‘double-dip’ recession in the early-2010s is a classic example of revisions rewriting the narrative.
Secondly, it’s important to consider the magnitude of the ‘technical recession’ that has now been declared. Not only is said slowdown incredibly shallow in nature, it is also likely to be relatively short-lived. On a broader level, the print does little to change the overall narrative of a UK economy which, at best, is growing at an anaemic rate, and at worst is stagnating.
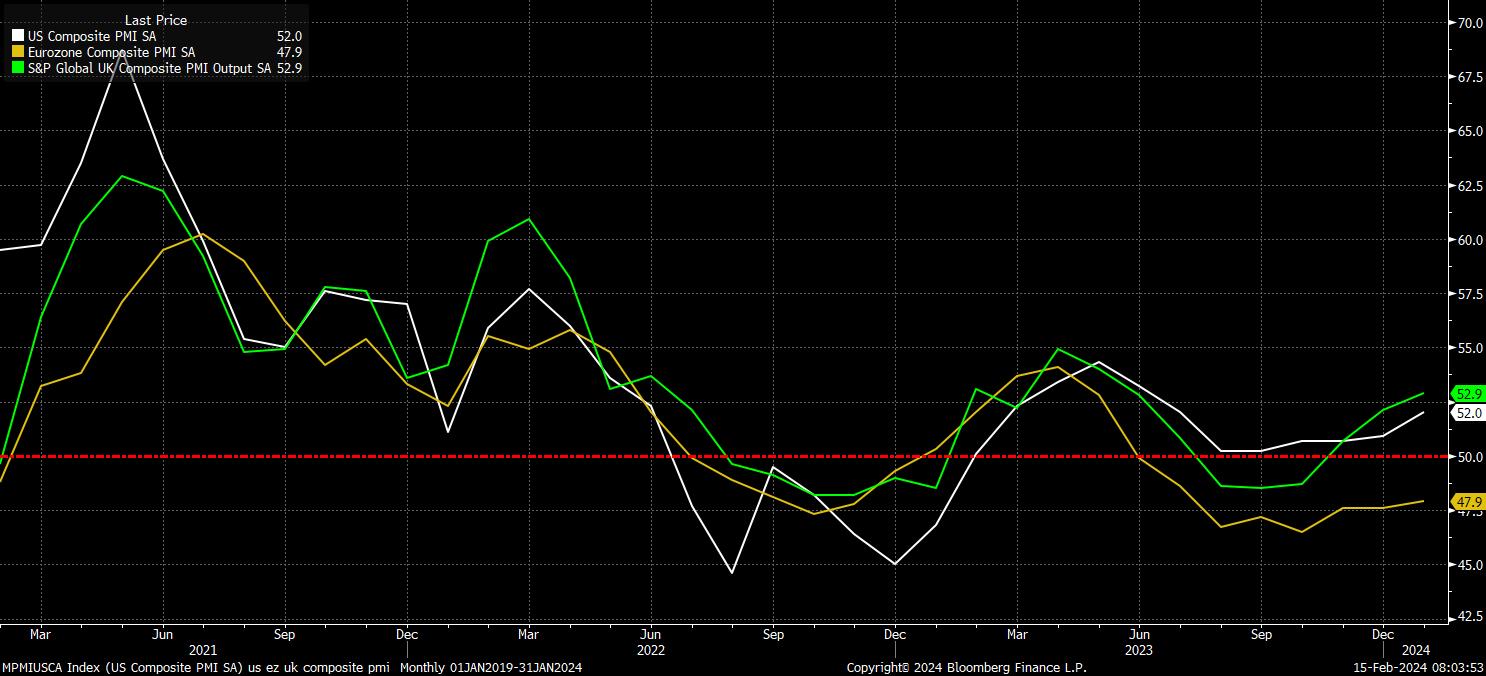
Finally, on GDP, is the fact that the data – by its very nature – is out of date as soon as it’s released. Hence, setting aside the rather nonsensical definition of a technical recession for a moment, even a cursory glance at a selection of more up-to-date activity gauges, such as the latest PMI surveys, will show that economic activity has actually seen a solid uptick of late, and begun the year in relatively solid fashion. Taking this final point into account, the GDP data on its own is highly unlikely to have a material impact on the BoE outlook, outlined above.
All that said, this week’s data bonanza still has one print left to be delivered. This is January’s retail sales report, where both headline and ex-fuel sales are expected to rebound from their worst December readings on record, likely rising 1.5% MoM and 1.7% MoM respectively.
Before you pop the champagne and celebrate, though, it’s worth remembering that this rebound is likely to be mechanically driven, and happen almost by default – in essence, retail spending was simply so bad over the festive period, that it would be an incredibly difficult feat for January’s figure to be worse.
This all leads nicely on to what this week’s data has done, and may still do, to the quid.
_2024-02-15_08-03-31.jpg)
I suppose that the short answer to that question is – not a lot.
While the GBP has come under pressure, the bulk of cable’s decline over the last few days came by virtue of the substantially hotter-than-expected US CPI figures, which saw Treasuries sell-off across the curve, USD OIS reprice in a hawkish direction, and the greenback print fresh YTD highs against a basket of peers (with the DXY tagging the 105 handle).
The ‘organic’ reaction to UK data has, truthfully, been relatively subdued, owing largely to the lack of significant impact that any of the prints is likely to have on the MP’'s near-term outlook – the next move remains a cut, and said first rate cut is still likely to happen some time in the summer.
Nevertheless, for those of a technical analysis persuasion, it is at least worth noting that this week has, at long last, seen the pound break to the downside of the 1.26 – 1.28 range that had been in place since mid-December, with cable also having broken below, on a closing basis, its 200-day moving average. The balance of risks continues to point to further declines in the short-term, principally due to continued USD demand, with the YTD low at 1.2520 now all that stands between spot and a downside test of the pivotal 1.25 figure, where the 100-day moving average also lurks.
Related articles


Pepperstone不代表這裡提供的材料是準確、及時或完整的,因此不應依賴於此。這些資訊,無論來自第三方與否,不應被視為建議;或者買賣的提議;或者購買或出售任何證券、金融產品或工具的招攬;或參與任何特定的交易策略。它不考慮讀者的財務狀況或投資目標。我們建議閱讀此內容的讀者尋求自己的建議。未經Pepperstone的批准,不允許複製或重新分發此信息。