Daily Fix: A week ahead and the RBA trading playbook

- China September manufacturing PMI (today 11:00 AEST): The market is expecting a slight improvement to 49.6.
- Reserve Bank of Australia meeting: more on this below
- US ISM manufacturing (2 October at 00:00 AEST): Consensus is calling for improvement here, with the index expected at 50.1 (from 49.1). Watch the new orders and new exports orders subcomponent to assess the underlying quality.
- US non-manufacturing (services) index (4 October at 00:00 AEST): The consensus is calling for a slower pace of growth, with the index due to print at 55.0 (from 56.4).
- US non-farm payrolls (4 October at 22:30 AEST): Consensus is for 145,000 jobs, an unemployment rate of 3.7%, and average hourly earnings of 3.2% YoY.
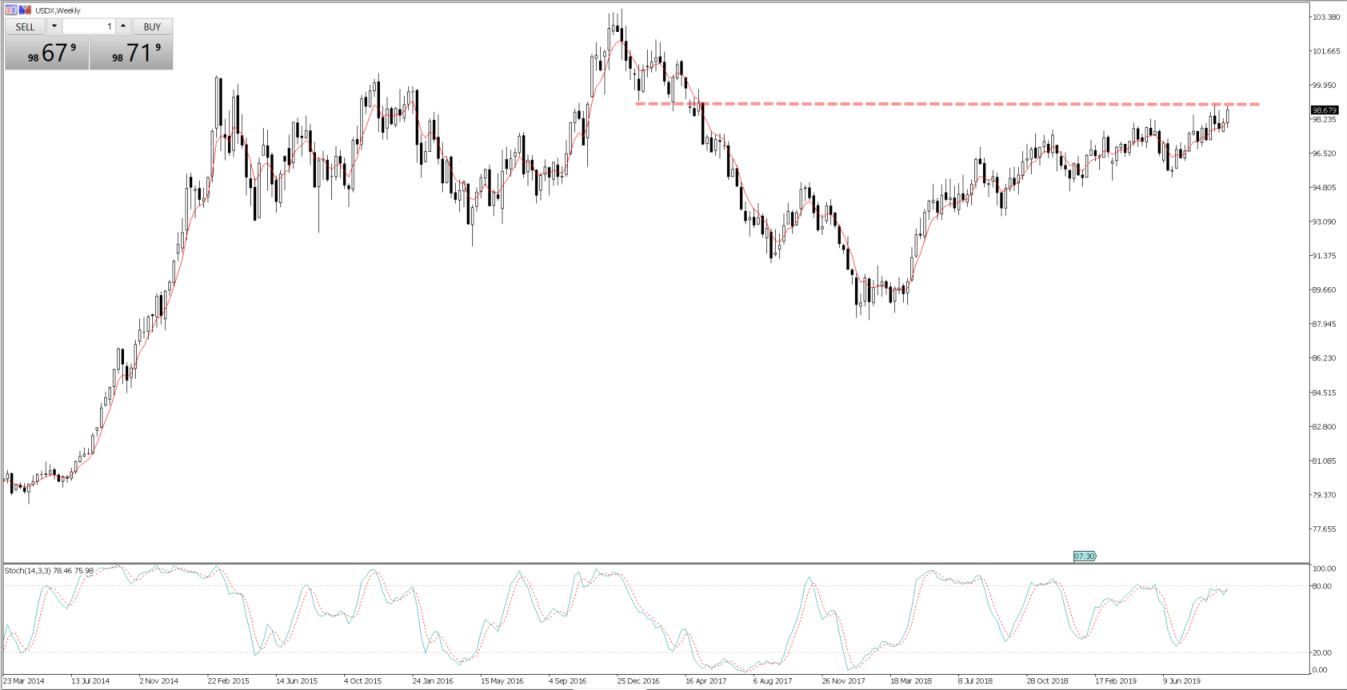
Chinese mainland markets are closed for most of the week, so this may affect moves in the USDCNH and not just equity indices. I’m especially interested in the US ISM manufacturing print, as manufacturing contracted last month for the first time since August 2016. A rebound here may fuel the view that things are less bad and US data is coming in consistently better than feared. While hypothetical, a rebound in manufacturing — married with solid expansion in services data and an upbeat payrolls report — and we could see the USD index (USDX) break out to the highest levels since 2017, with EURUSD convincingly through the double bottom of 1.0926.
Daily chart of the USDX
Federal Reserve speakers: A heavy week of Fed chatter, with a number of members due to speak. The main event will be Vice Chair Richard Clarida, who’s due to deliver speech Friday (08:35 AEST). He’s considered the central architect of Fed policy. However, with rates markets pricing a 43% chance of a Fed cut in the 30 October FOMC meet, these speakers will influence that pricing and could have an impact on the USD, gold and S&P 500. Any narrative around the Fed’s balance sheet and the need for higher reserves could be positive for risk assets. And the idea of a new round of QE is certainly growing.
"Source: Bloomberg"
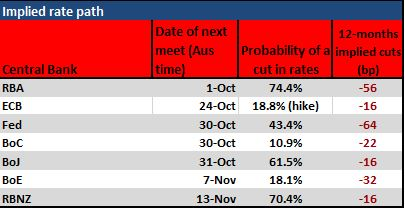
Rate expectations: Here, I’ve looked at what’s priced for the next central bank meeting and the implied probability of a cut. We can also look across the swaps curve and see what’s priced (number of basis points) for the coming 12 months. We can assume the market doesn’t actually expect the European Central Bank hike, but this is more symbolic that the bank has reached the lower bounds. QE is the increasing focal point.
Implied rate path
RBA trading preview: I’ve had several conversations with clients in the past few days relating to tomorrow’s RBA meeting and whether it could be a volatility event. There’s a view to sell AUDs on the idea the RBA is to cut, so I’ve put a few considerations and a more holistic oversight for the risk-to-reward dynamics here.
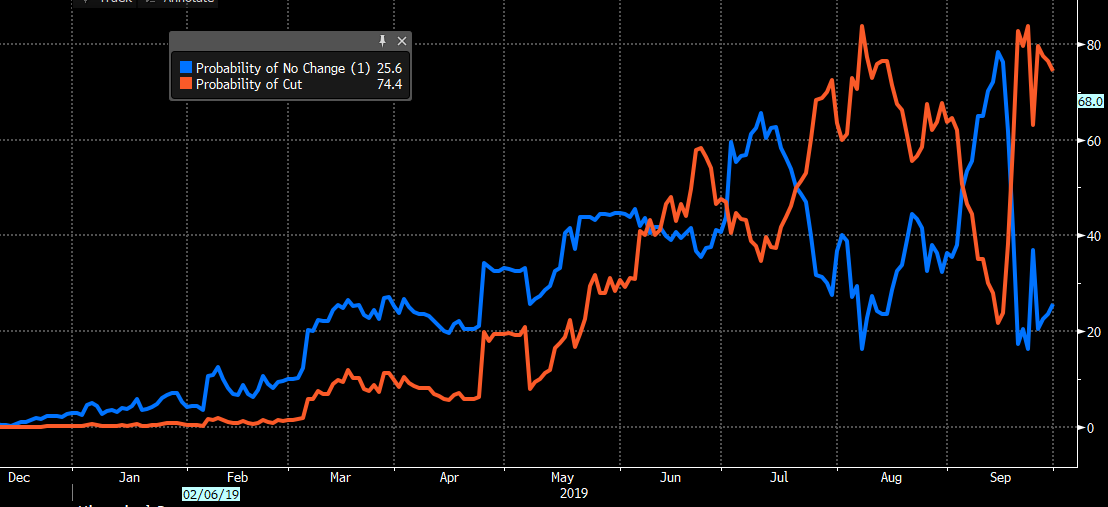
Firstly, understand what’s priced in. Here, we see the rates market has factored in a 74.4% chance of a cut, which has increased of late. The RBA’s September minutes, sufficient slack in the recent employment data, and all four big banks calling the cut will do that. But given what’s priced, if the bank cuts, the AUD downside should be limited. So, the extent of any selling will also be driven by the RBA’s tone and outlook, and whether the market offers an urgency to cut again this year — a fate the market feels is currently a 50:50 proposition.
If rates are left on hold, then you could see a relatively more aggressive spike higher, although that could quickly reverse if the statement portrays a bank that’ll almost certainly cut in November.
While the case for cutting is clear, I ask if they want to cut, then why wait? I’m concerned the bank holds off but gives a view of one to come in November. My preference, then, is to sell rallies into 0.6825/50. I’ve closed off my AUDNZD sell call from last week, and will re-assess post-RBA.
"Source: Bloomberg"
Economists call: A cut is the clear consensus view here — with 20 of 26 economists, including all four big Aussie banks, calling a 25bp cut. It isn’t often you see a 70%+ probability priced and all four banks on the same page, and the RBA doesn’t follow suit. It can’t be ruled out, but it’d be a surprise.
"Source: Bloomberg"
Positioning: There are many ways to look at positioning. But if we take the weekly Commitment of Traders (CoT) report, we see the speculative (non-commercials) holds a net short position of 47,155 contracts. While this doesn’t obviously imply a rapid liquidation if we see rates on hold, it does suggest the spike higher if rates are left at 1%, and will be more pronounced than if rates are cut by 25bp.
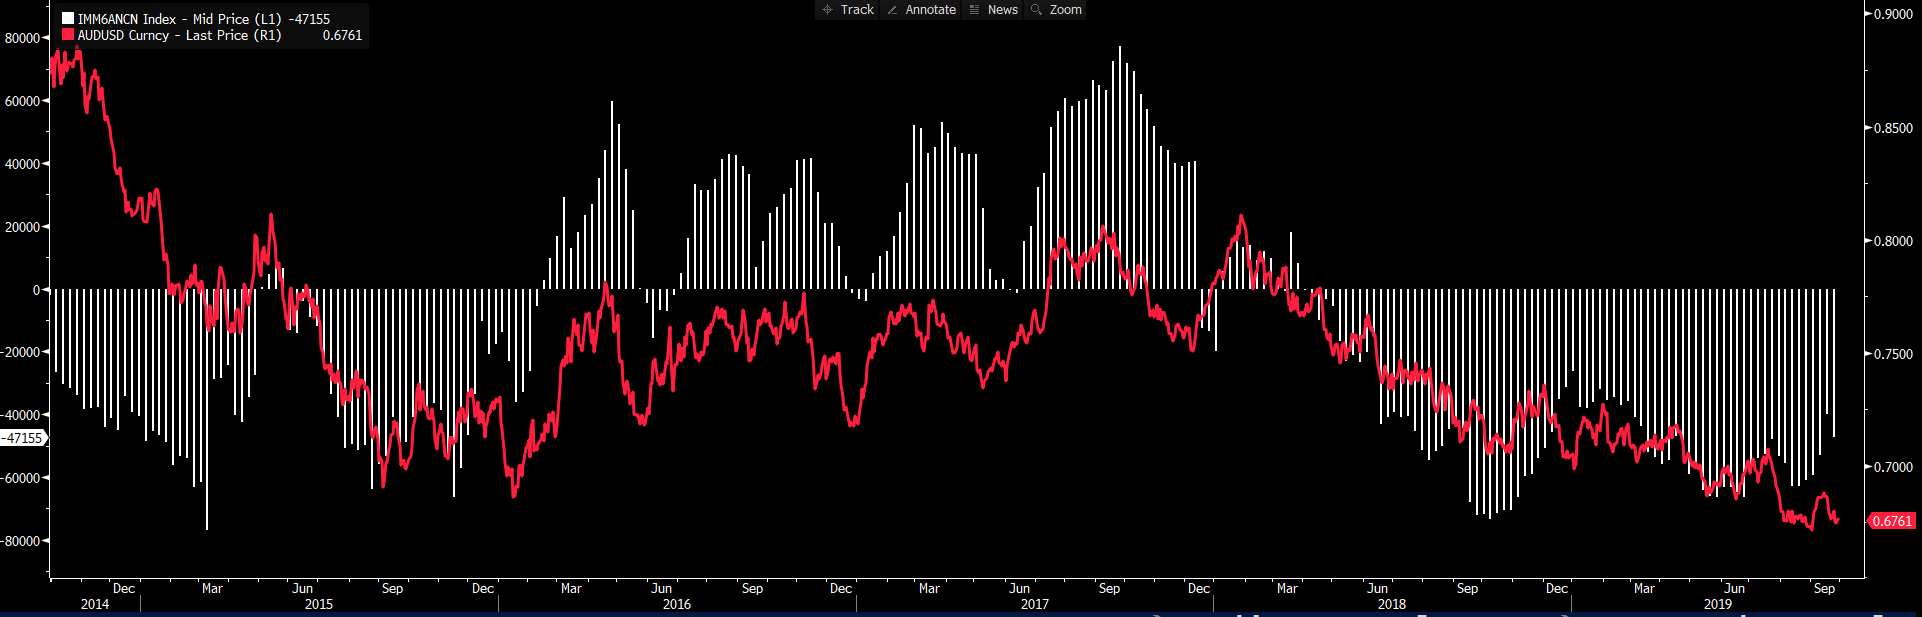
"Source: Bloomberg"
Options skew (risk reversals): I’ve looked at AUDUSD one-week risk reversals. This looks at the skew in one-week put versus call volatility. While we aren’t trading options as such, if implied volatility is high there’s increased demand for those options as traders see a bigger move in the underlying and a greater chance of the options settling in the money. Below zero (the white horizontal line) readings indicate a higher demand for put options over calls, which is traditionally the case. So, we see that put/call skew details that traders see downside in AUDUSD, but it isn’t at extremes.
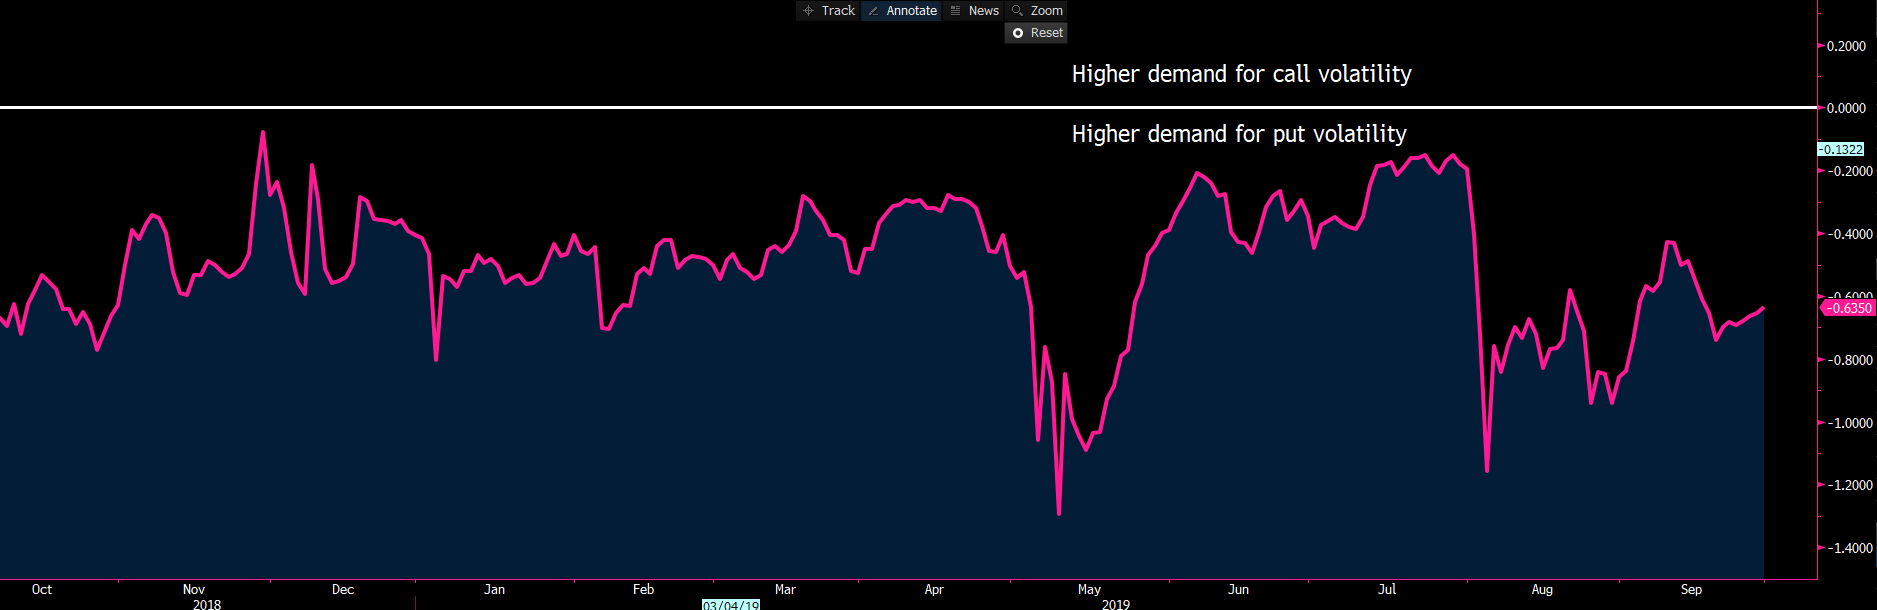
"Source: Bloomberg"
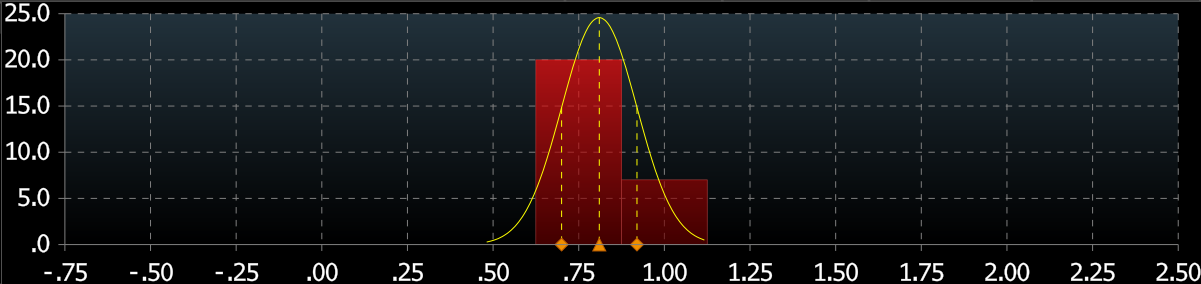
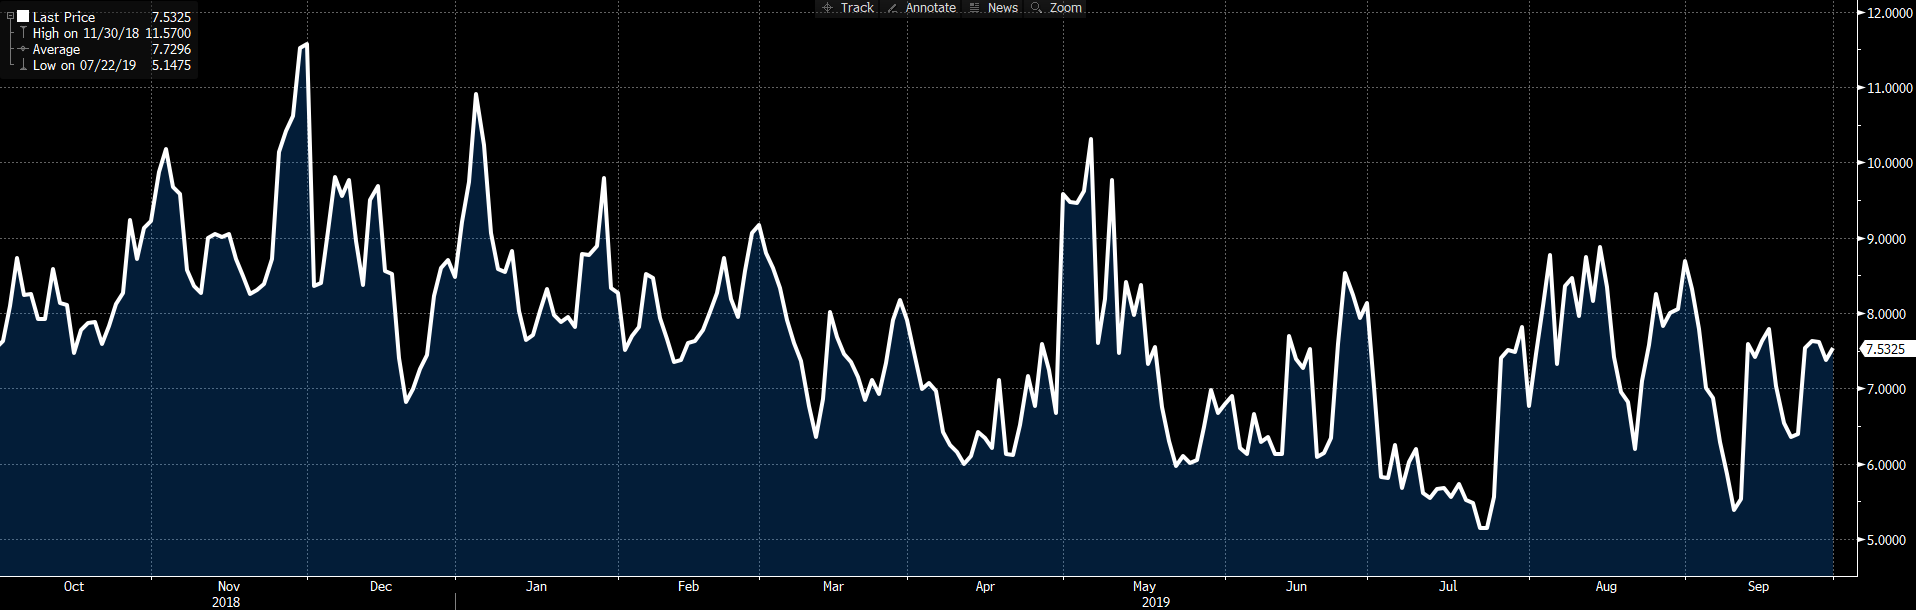
Implied volatility: AUDUSD one-week implied volatility sits at 7.53%, which isn’t overly high at this stage given the risks through the week. To give a sense of the implied move, we see the market pricing a 59-pips move higher or lower (or a 118p range) through the week, with a 68.2% level of confidence. I can increase the confidence level, look at 10-delta options, and see the market feels (with a 90% degree of confidence) that AUDUSD will remain confined in a 0.6857 – 0.6651 range. I’d concur and look to fade moves into these levels should we see play out.
"Source: Bloomberg"
Correlations analysis: I’ve looked the influence various markets hold on the AUDUSD. Whether I look the correlation on a rolling basis or perform a regression, I see the highest correlation is between the Hang Seng and AUDUSD. Here, the 30-day rolling correlation between the two variables is 0.91. With the Hang Seng closed through most of this week, it places more emphasis on the AUDUSD as a driver of variance.
As the week rolls on I’d expect the AUDUSD to focus more intently on the Hang Seng again.
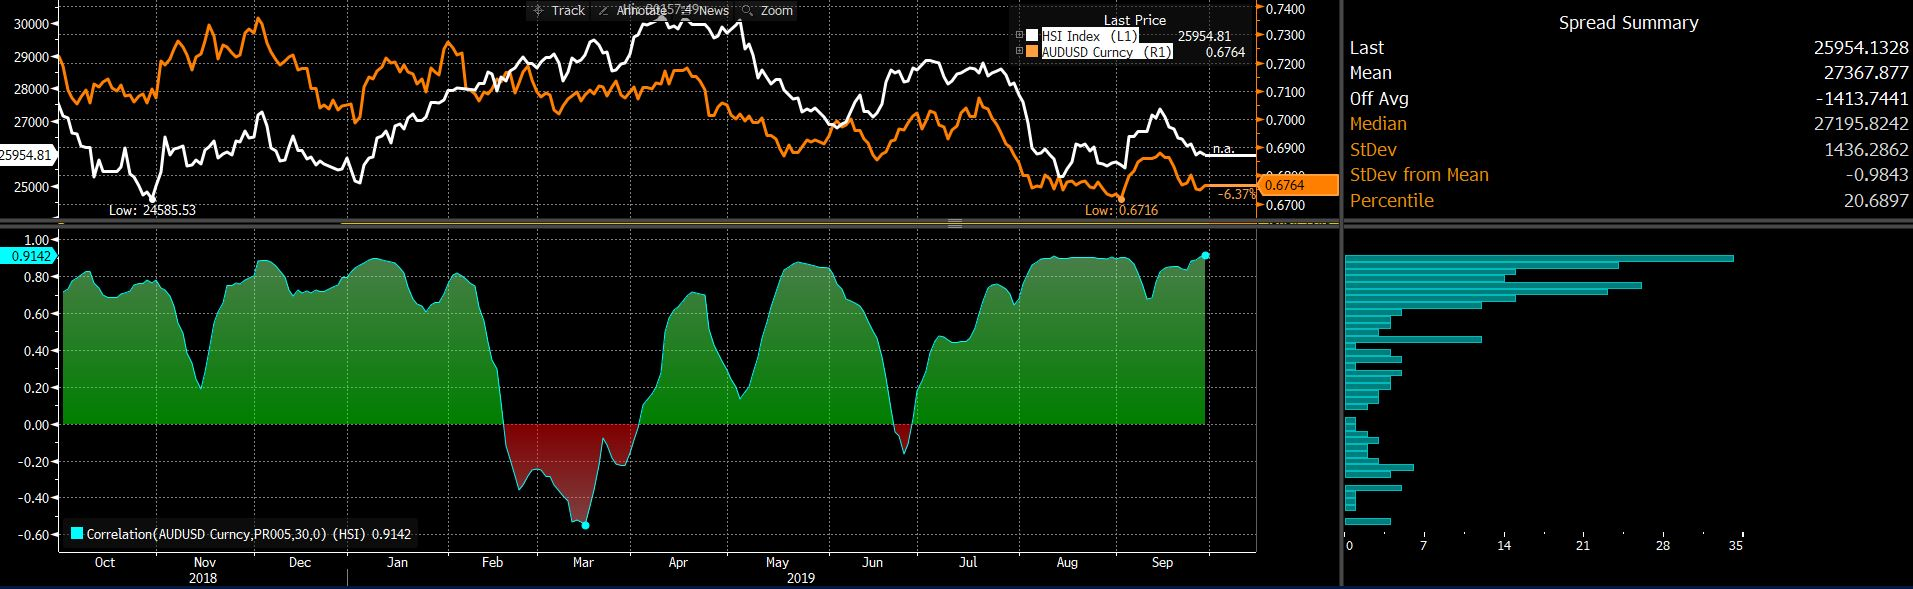
"Source: Bloomberg"
Trading events, or even holding exposures over events, certainly isn’t always straightforward. In this case, we may see an initial move followed by a quick-fire reversal. Given the playbook here, I feel on balance that selling rallies make the most sense.
The material provided here has not been prepared in accordance with legal requirements designed to promote the independence of investment research and as such is considered to be a marketing communication. Whilst it is not subject to any prohibition on dealing ahead of the dissemination of investment research we will not seek to take any advantage before providing it to our clients.
Pepperstone doesn’t represent that the material provided here is accurate, current or complete, and therefore shouldn’t be relied upon as such. The information, whether from a third party or not, isn’t to be considered as a recommendation; or an offer to buy or sell; or the solicitation of an offer to buy or sell any security, financial product or instrument; or to participate in any particular trading strategy. It does not take into account readers’ financial situation or investment objectives. We advise any readers of this content to seek their own advice. Without the approval of Pepperstone, reproduction or redistribution of this information isn’t permitted.