Daily Fix: Risk aversion strikes — looking into the unknown

As suggested yesterday, the trend in US data certainly had been consistently beating expectations. So, the sudden reversal of fortunes has created a rapid re-assessment. With manufacturing showing once again that despite its relatively small contribution to GDP, it really matters to markets.
CITIGROUP US ECONOMIC SURPRISE INDEX IS ROLLING OVER
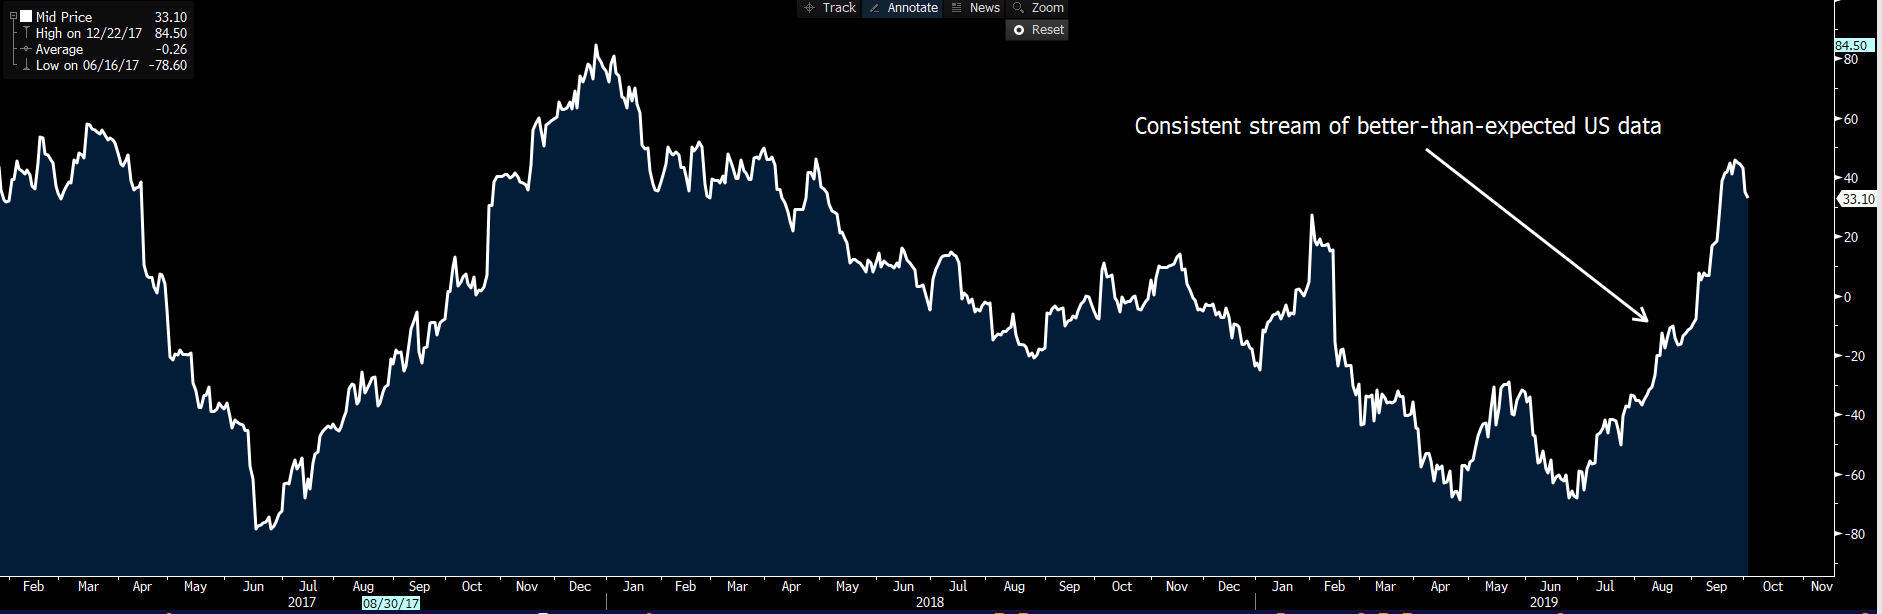
"Source: Bloomberg"
There isn’t a lot of good news to inspire the bulls. So, add in news flow that global car sales are in a tough spot, US construction spending printing 0.1% (versus 0.5% eyed), and the ADP employment change declined from 195,000 to 135,000, and we see the bid dry up and sellers, in this environment, can move markets quite easily. Does the poor ADP payrolls report increase the prospect of a poor non-farm (NFP) on Friday? Perhaps. But statistically, the correlation is poor where a five-year regression (using the ADP payrolls value as my independent variable) shows just 21% of the variance of NFPs can be explained by the ADP print. Still, markets are nervous. What was once a near non-event for markets can become a bigger issue.
Digging a little deeper, we see US rail traffic fell 6.4% in September. Then late in the session, we heard that the US will impose tariffs on USD $7.5bn on EU imports from 18 October in retaliation for illegal subsidies to Airbus — and you have a recipe for cash preservation.
Certainly, the reaction in European equity markets was punchy. Unless Asia can force a more bullish turnaround, our calls (as they stand) are for a touch more weakness when they open later today. Certainly, we can look to the UK where the FTSE 100 sank 3.2% — the biggest one-day percentage decline since 20 January 2016 and 4.5 sigma move. The DAX lost 2.8%, smashing through the neckline of the triple top, and in two sessions we’ve almost undone 50% of the 10.9% rally seen through August to September. S&P 500 futures started to crack as European trade got underway. Then, it was a steady bleed into the lows of 2874 at 02:54 AEST, where stability kicked in.
Volumes were elevated, and some 14.7% above the 30-day average through the S&P500. All sectors closed lower, with S&P 500 financials (-2.1%) and energy (-2.6%) faring the worst. And certainly, a 1.8%% selloff in crude isn’t going to be taken well — crude’s sixth consecutive day of falls. Implied vols have moved higher, with the VIX index pushing above 20% and eyeing a move into the August highs of 24.81%, although we’ll need to see a horror of a US service ISM print (tonight at 00:00 AEST) to compel vol buyers to pay up from here. The consensus is for the US ISM service index to print 55.0 (from 56.4), so anything below 53.0 will compound the risk aversion and the worry of the great unknown. High-yield credit has widened 9bp versus investment-grade credit, suggesting further downside in equities.
WHITE: HY/IG CREDIT SPREAD. YELLOW: S&P 500 (INVERTED).
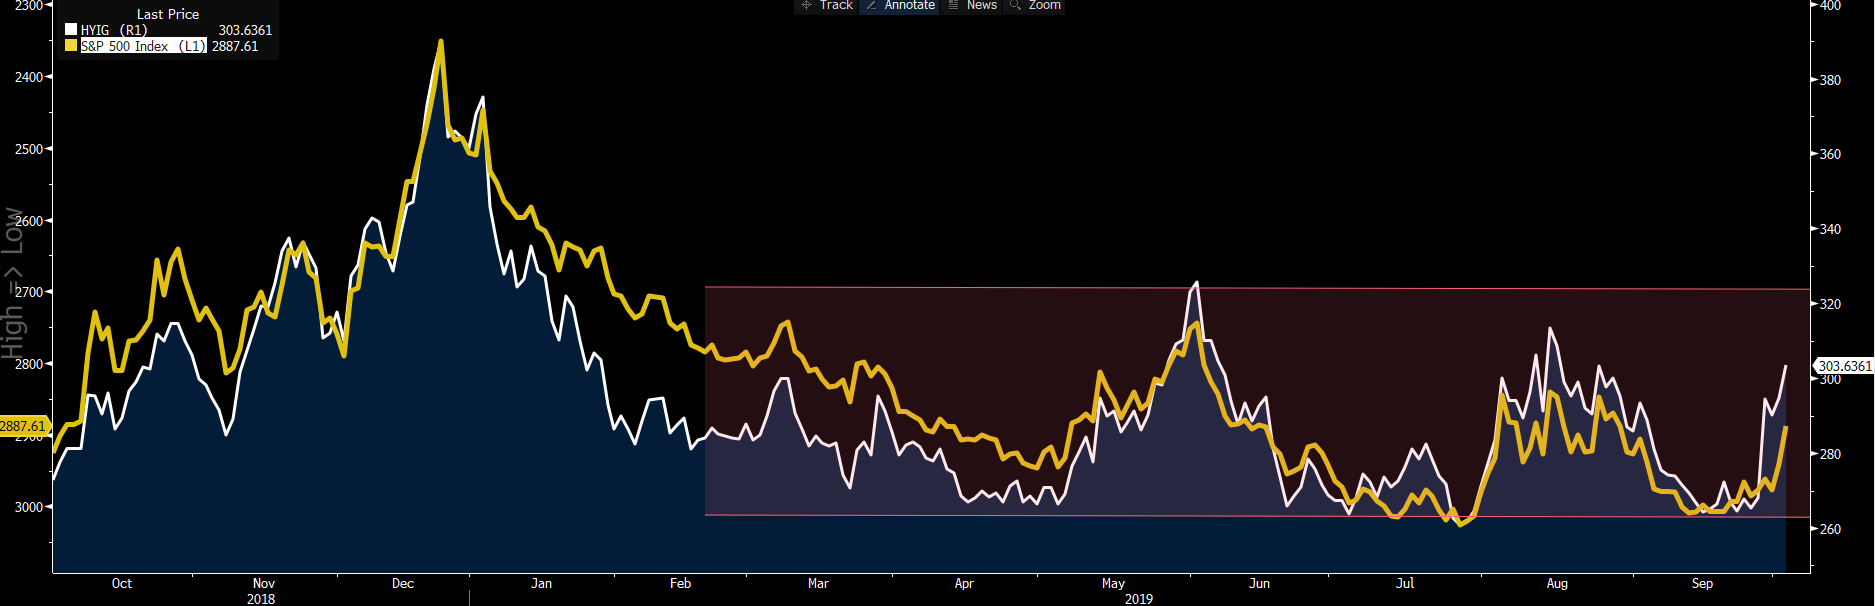
"Source: Bloomberg"
The tightening of financial conditions has resonated in rates market, where the implied probability of cut from the Federal Reserve in the October meeting sits at 74%. We’ve seen US two-year Treasurys down a further 7bp into 1.47%, and eyeing a retest of the September lows of 1.42%. The outperformance of the front end has seen the twos and 10s Treasury curve push up 3bp to 11bp. For those calling a recession, this is exactly what you’ve been looking for — inversion, followed by a bull steepening of the curve, with the front end driven lower as the markets sniff out further easing into tough economic times.
What does all that mean for the Asia open? Well, clearly there are few reasons to buy. But if we look at S&P500 futures, price resides 2% lower from 16:10 AEST (the official ASX 200 close), while Aussie SPI futures sit 126p — 1.9% from the cash close. The Hang Seng and Nikkei 225 will likely open 1% or so lower, although I personally see downside risks to that call.
In FX markets, the CAD has fared the worst, led by declines in crude. The USD has had a mixed day, with USDJPY holding the cleanest and sharpest reaction to the repricing of the rates markets and the rampant moves lower in US two-year yields. Gold bulls are certainly happy about this. The yellow metal is back testing USD $1,500 and relishing this environment where traders are once again questioning economics. And we see a rollover in real yield.
Short AUDJPY has worked well. Again, in this environment of higher equity and bond volatility, AUDJPY should perform well, although JPY traders are obviously watching the Bank of Japan meeting at the end of the month given it is live. Some are asking if there’s a Kuroda Put under the JPY. GBPUSD saw good buying off the session lows of 1.2227. All eyes fall on both the EU and the British parliaments. The prospect of Boris Johnson unveiled Brexit plans gaining the necessary traction, although the initial proposal, while above and beyond market expectations, needs work if it is to compel the Irish.
The material provided here has not been prepared in accordance with legal requirements designed to promote the independence of investment research and as such is considered to be a marketing communication. Whilst it is not subject to any prohibition on dealing ahead of the dissemination of investment research we will not seek to take any advantage before providing it to our clients.
Pepperstone doesn’t represent that the material provided here is accurate, current or complete, and therefore shouldn’t be relied upon as such. The information, whether from a third party or not, isn’t to be considered as a recommendation; or an offer to buy or sell; or the solicitation of an offer to buy or sell any security, financial product or instrument; or to participate in any particular trading strategy. It does not take into account readers’ financial situation or investment objectives. We advise any readers of this content to seek their own advice. Without the approval of Pepperstone, reproduction or redistribution of this information isn’t permitted.