Daily Fix: A 360-degree guide on US Q2 earnings season

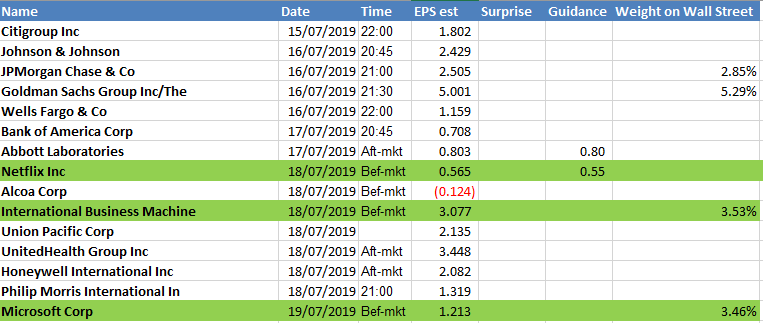
On the billing this week, we get the following names and the expected times of reporting. Pepperstone offers trading in the pre- and post-market trading session, which allows clients the ability to react to the earnings reports real-time. The green line represents the companies I feel will get greater attention from clients — notably Netflix, where implied volatility suggests a move of 6.72% on the day of reporting.
A bullish trend
Not a day goes by, seemingly, when US equity indices print a new record high. Yet, if we look at positioning, flow data and the market internals, there are few variables that offer a sense of euphoria in markets, as well as the contrarian signal of an impending reversal in the bullish trend seen since 3 June.
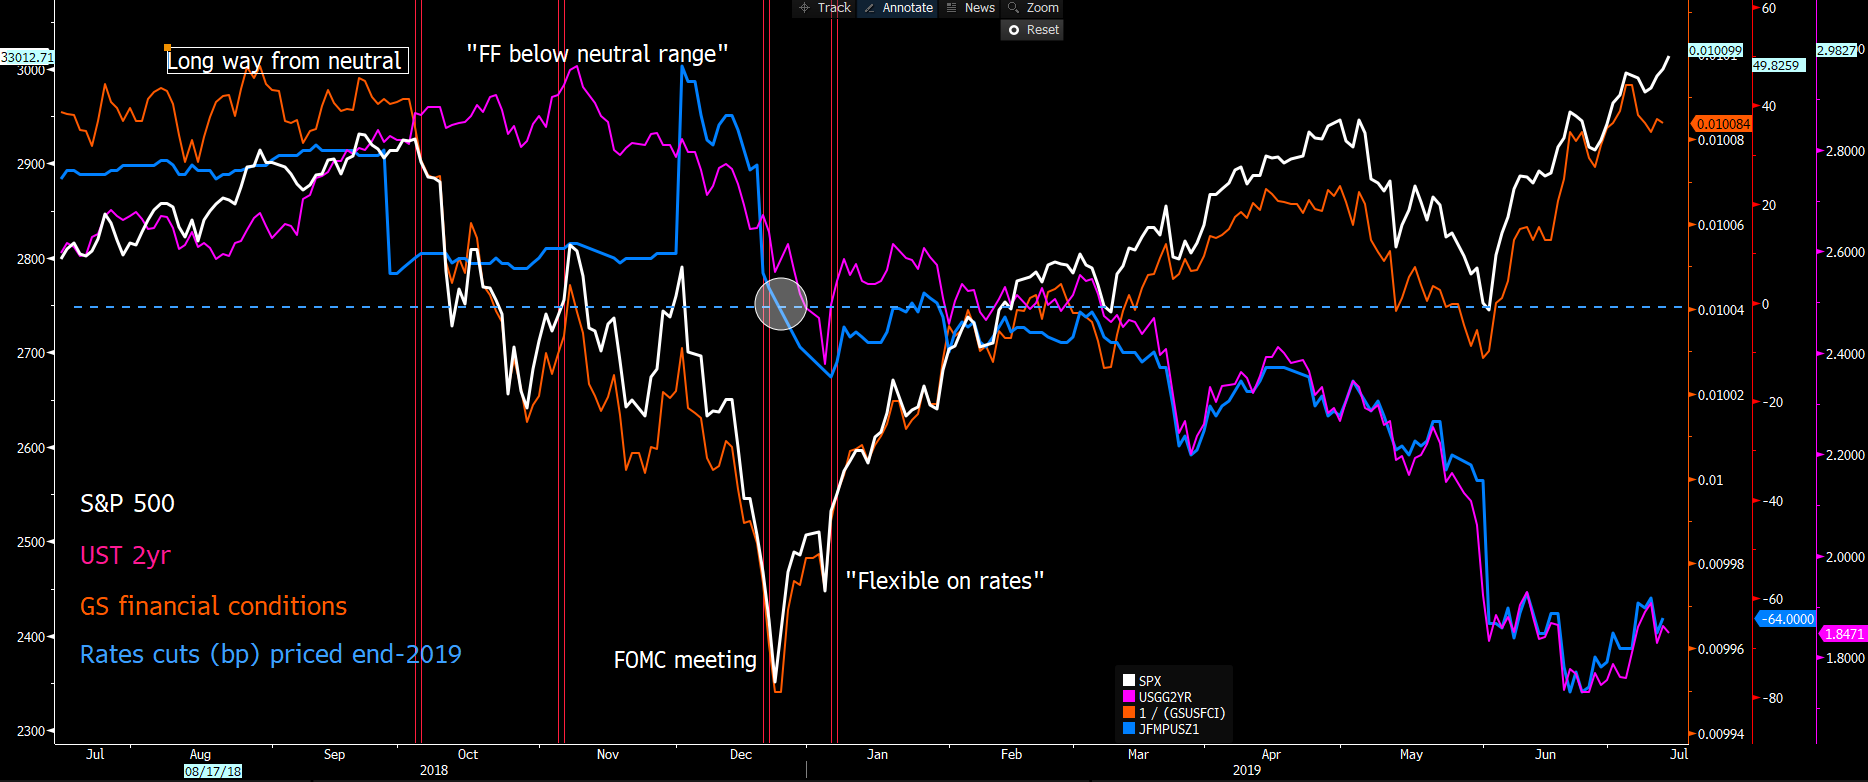
The clear catalyst for higher equity prices has been the view on the expected path on monetary policy from the Federal Reserve, as well as the idea of lower interest rates and what it means for leverage. As we can see from the Bloomberg chart, as the level of expected rate hikes (as seen from the blue line) turned to cuts (in December), the S&P 500 rallied strongly, with a clear improvement seen in broad financial conditions (orange line).
The equity market is a voting mechanism not on fundamentals, as most are led to believe, but sentiment and psychology.
With US Q2 earnings ramping up this week, traders get an opportunity to mark-to-market current valuations with the outlooks from CEOs and CFOs, as well as consider if the market is fairly priced for the level of known risk. As things stand, the consensus (source: Factset) is that S&P500 companies report revenue growth of 3.7% (YoY), which would be the lowest growth rate in sales since Q3 2016. On the bottom line, the consensus expects earnings-per-share (EPS) to decline by 3%, led by expected declines in materials and technology.
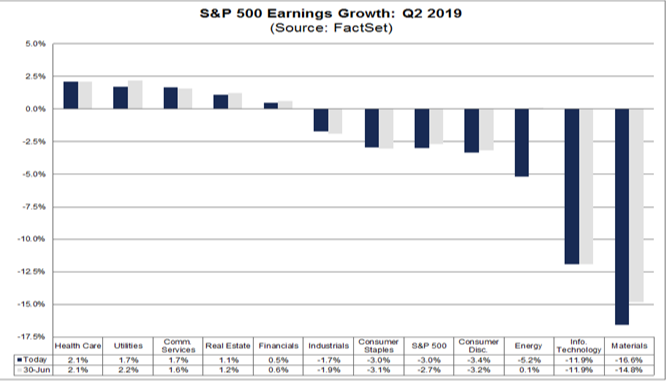
"Source: Factset"
The market is going into earnings with quite low expectations, which suggests the risks of a drawdown from earnings have been reduced. As always, it’s level of beats versus misses that’ll influence. The bulls would be hoping for the percentage of companies beating on EPS of greater than 75% to help fuel valuation re-ratings.
We’ve also seen some 90 companies issue negative guidance on EPS, which is the second highest reading since Factset started compiling estimates from 2006.
Investors will also be keenly focused margins given the impact of the Trump tariffs, while consider we continue to see the 2018 Trump tax reform roll-off, which has boosted the bottom line from a lower tax rate.
Equities priced for perfection?
Indeed, if we look at the S&P 500 consensus 12-month PE ratio, we can see the index tracking at 18.05x, which, despite being at the highest level since early 2018, isn’t yet one standard deviation from the five-year average (blue line). Despite some calls that the index is deemed “expensive,” with bond yields at such subdued levels and S&P 500 30-day implied volatility (I’ve looked at the VIX index here) at 12.39%, an 18x multiple isn’t yet at genuinely concerning levels.
Sure, US corporates will need to inspire to justify this valuation. But at these levels, the focus and prominent driver of risk will remain fixated on the degree by which the Federal Reserve cuts rates.
- Top pane: consensus 12-month PE ratio, with one- and two-standard deviation from the average
- Lower pane: consensus 12-month EPS forecasts
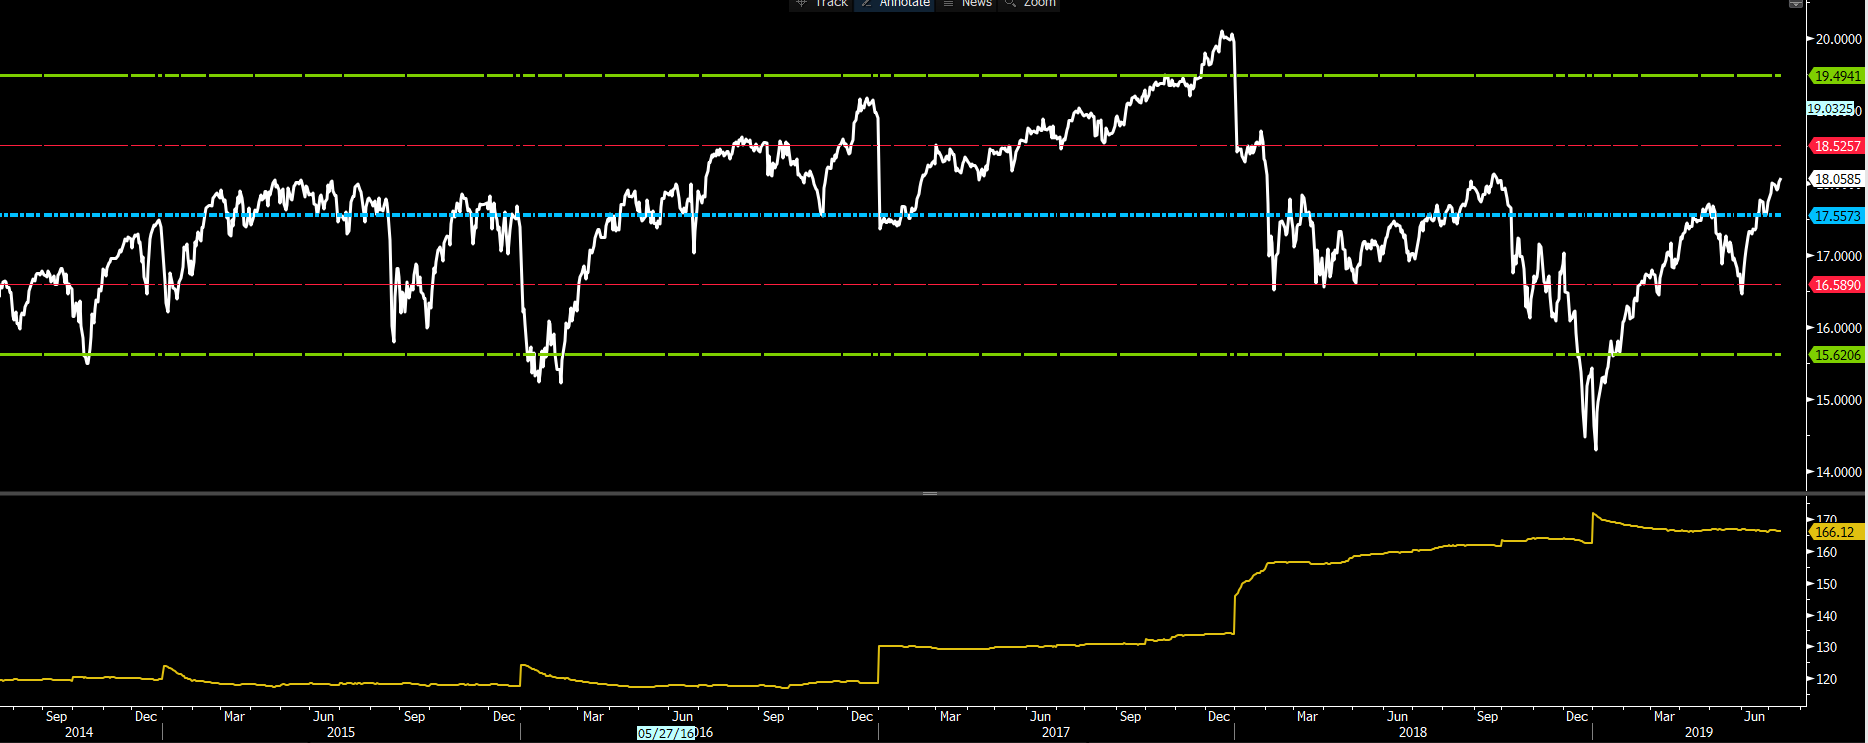
"Source: Bloomberg"
Assessing market internals
Another method of evaluating sentiment into Q2 earnings is to look at the market internals on the S&P 500. There are many variances of internal indicators we can use, but I’ve selected a few that I tend to look at.
Again, the internals aren’t giving off a glaring “sell” signal, and we see:
- Five-day average of the S&P 500 advance/decline line. This currently resides at 42% (the blue histogram). Readings above 250 are of greater concern.
- Percentage of S&P 500 companies at 52-week highs at 50% (orange histogram). I’d be more concerned if we were above 80%.
- Percentage of S&P 500 companies with price above the 20-day moving average, at 80.56% (yellow histogram). Above 90% concerns.
- Percentage of S&P 500 companies with price above the 50-day moving average, at 85.66%. Above 90% concerns.
- Percentage of S&P 500 companies with an RSI above 70, at 12.9% (grey histogram). Above 25% is a concern.
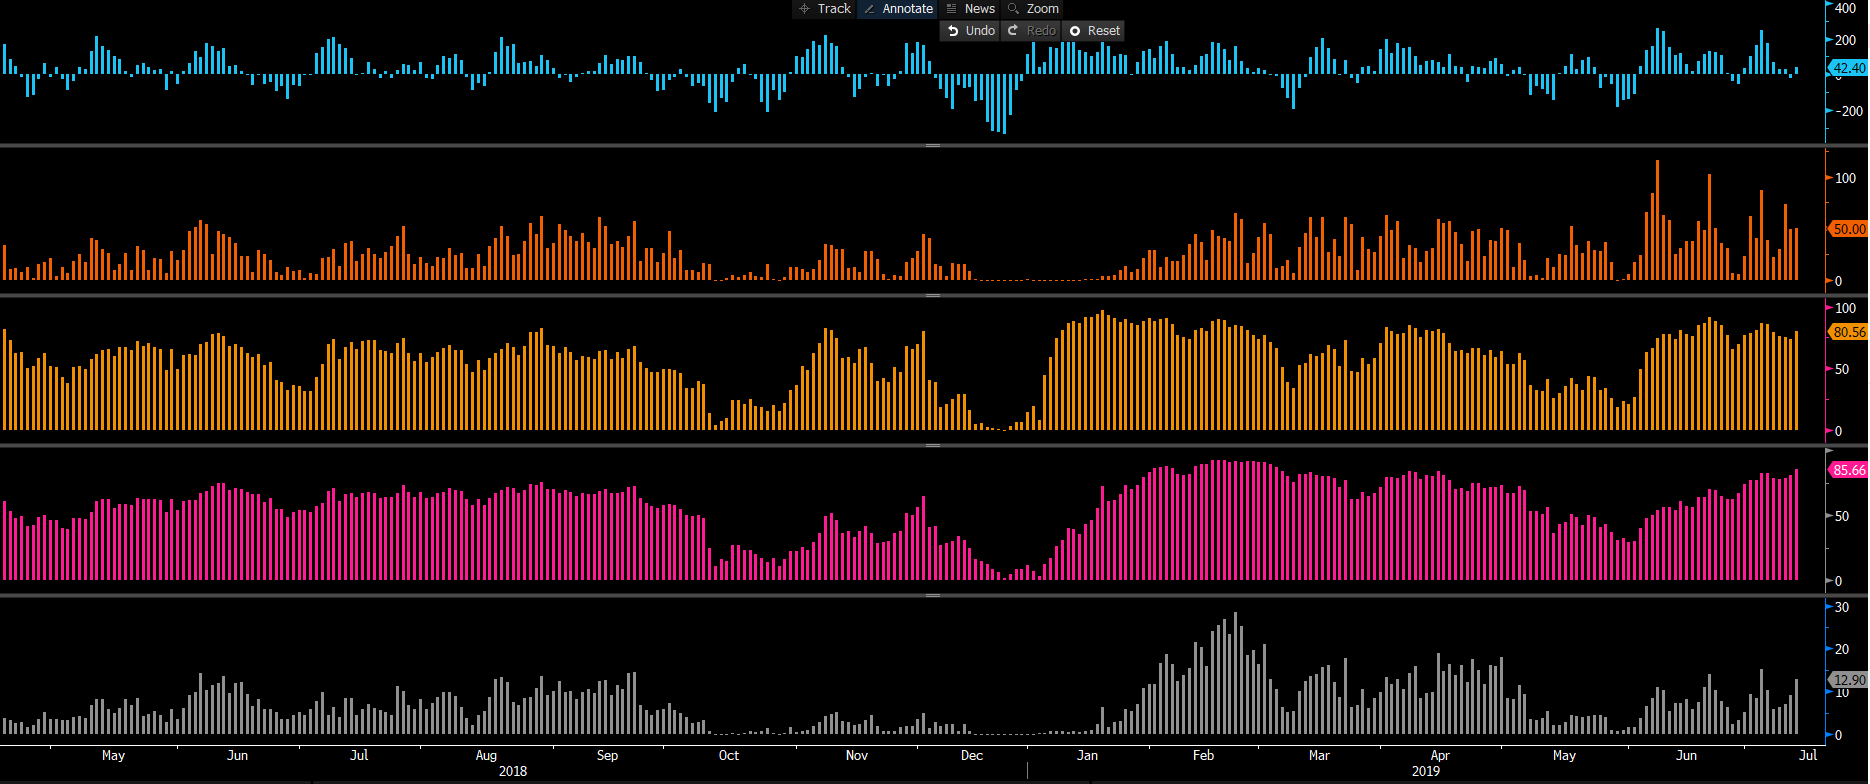
Market internals can offer insights into psychology and sentiment often when we see extreme readings increase the probability of key turning points. As things stand, we aren’t seeing any glaring signs that there’s too much love for US equities.
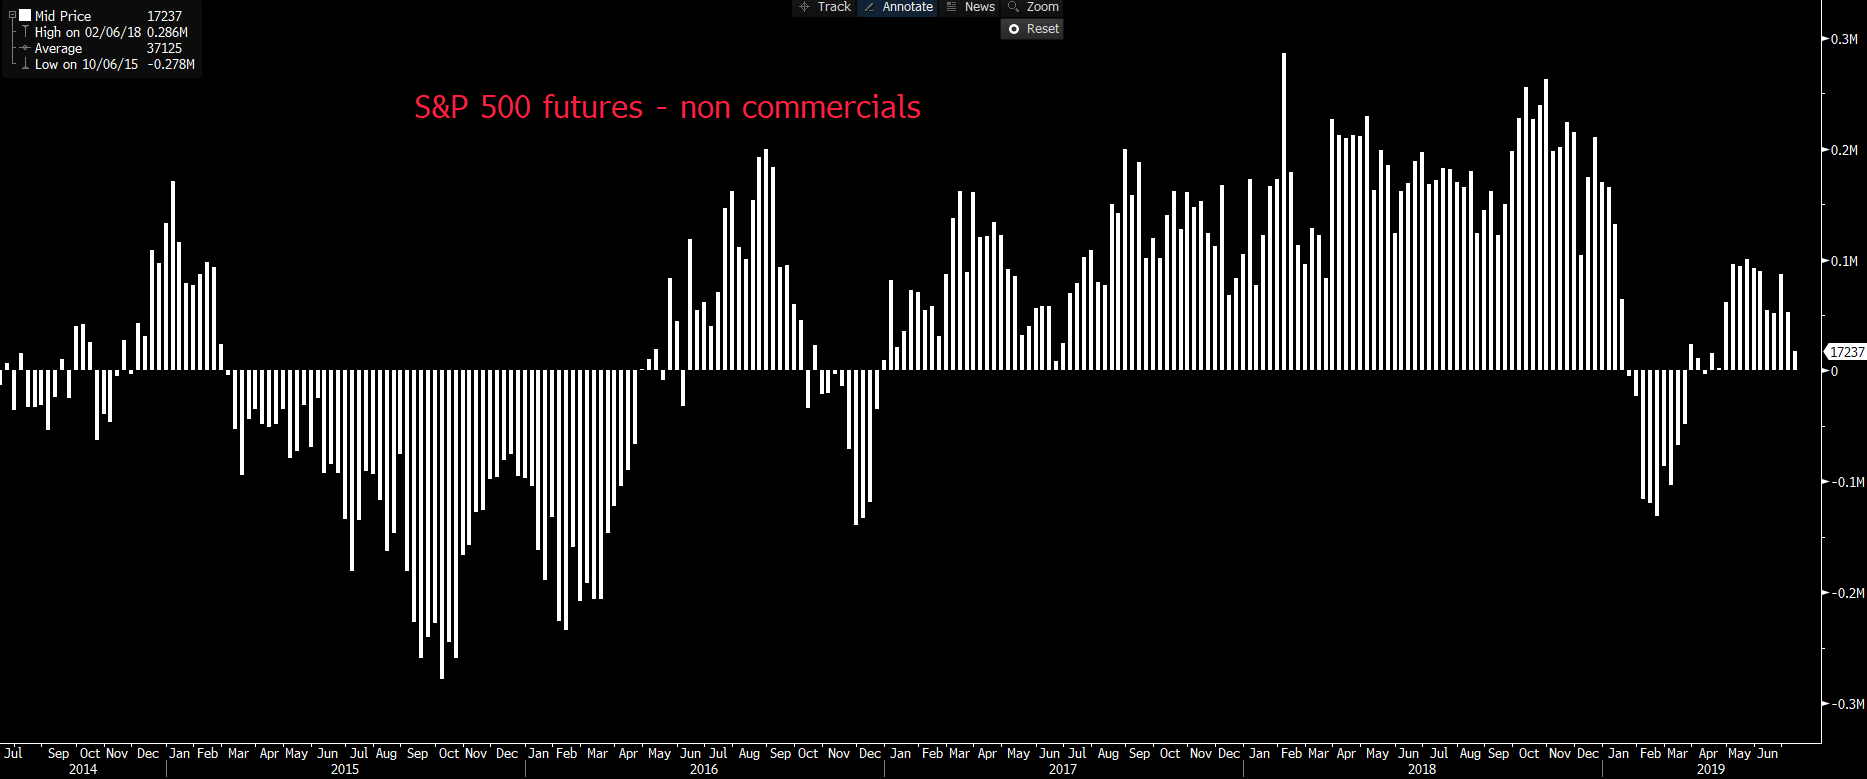
Positioning: There are many ways of looking at positioning, but if we take the weekly Commitment of Traders report, we see net positioning in S&P 500 futures held by non-commercial accounts, at 17,237 contracts. Despite the strong trend in the index, positioning clearly isn’t at an extreme.
If we look at the capital flow into mutual funds, we can actually see net outflows from equity-focused mutual funds that specifically invest in developed markets. The flow of capital has moved in emerging markets, which could be seen as a beta play but also part of the hunt for yield story.
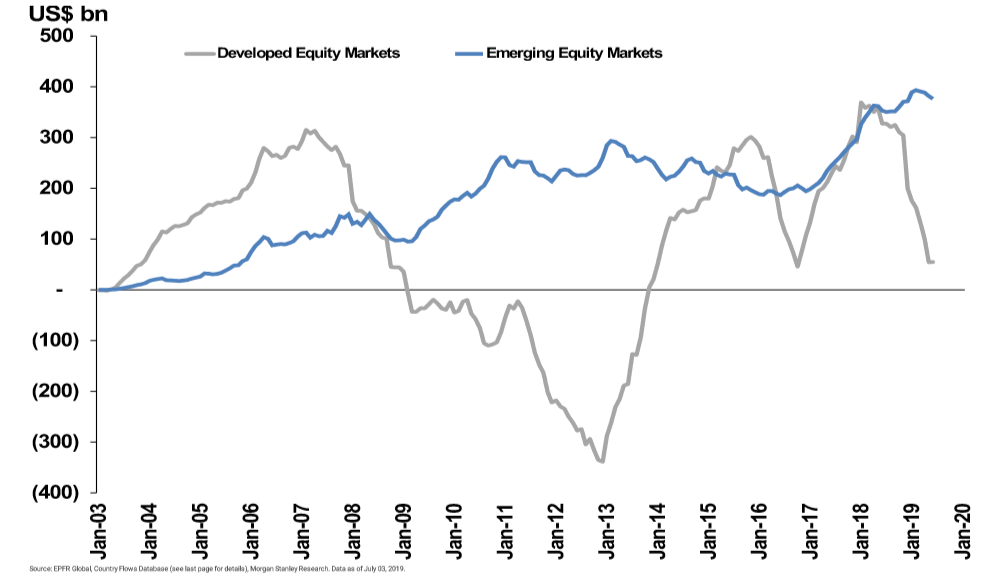
"Source: Morgan Stanley"
The technical setup and I have looked at the daily chart, which shows a clear bullish picture. There are few reasons to be short here, and being so seems a low-probability trade. As I detailed in my Bloomberg cross, the backdrop favours further equity appreciation. We can see price at an ATH, and is holding above the five-day average, which is defining the trend. There are no signs of divergence between price and the various oscillators.
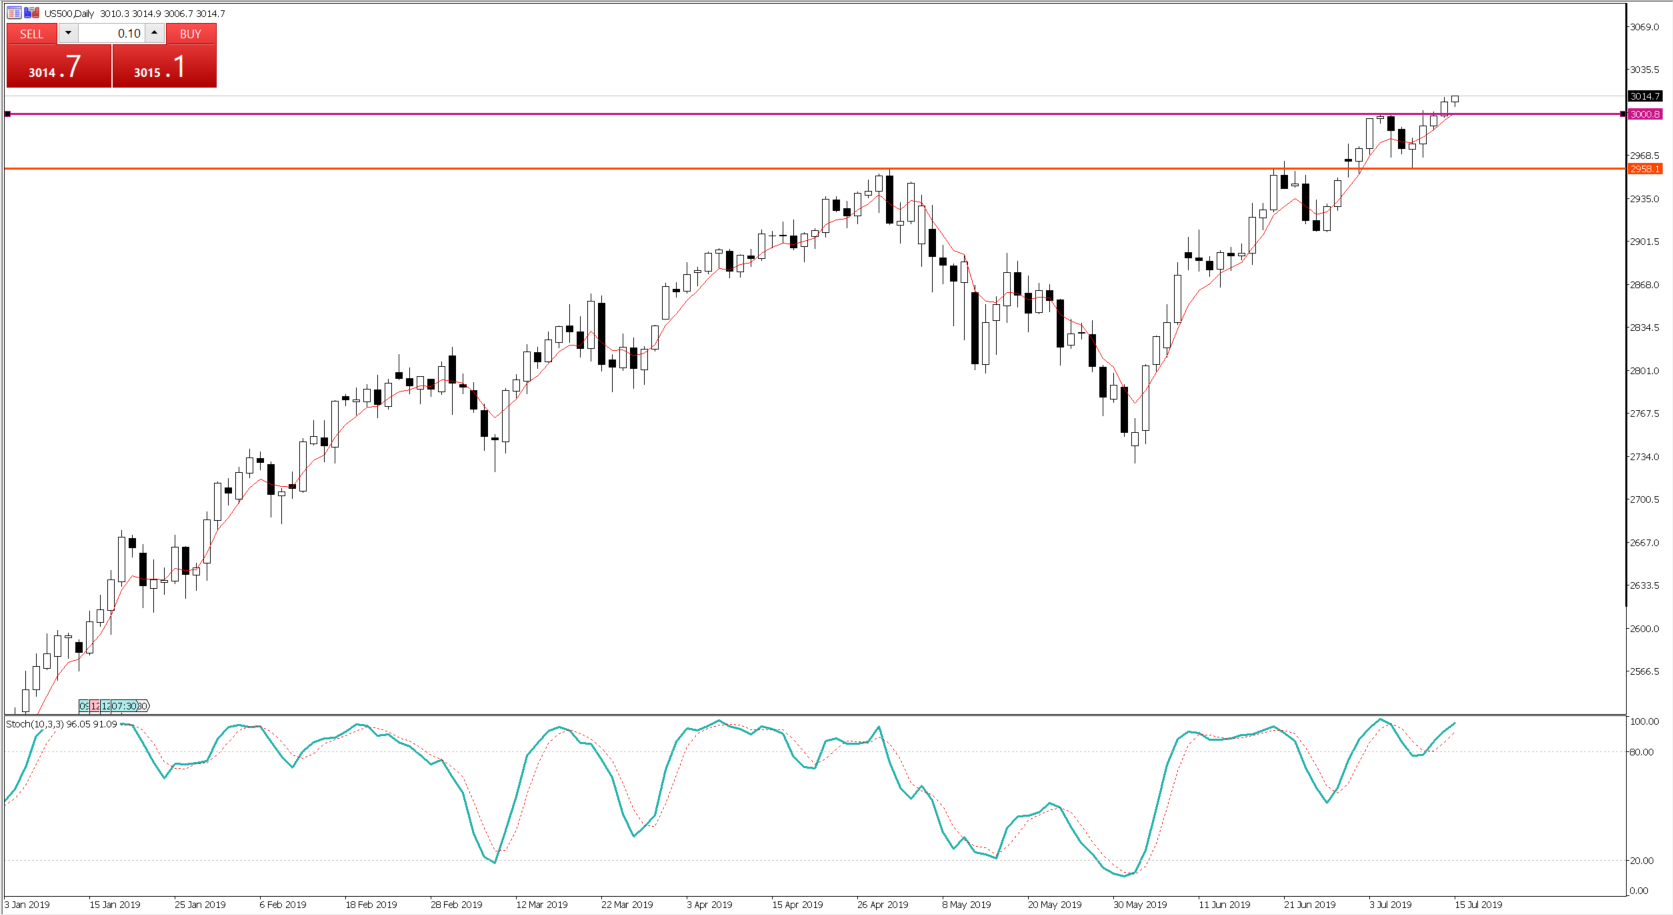
Clear risks are there, but there are few reasons to feel earnings are likely to be a significant headwind for equities. And the dominant driver remains on how the Fed interacts with markets. Positioning, flow and technicals all point to a market that’s seeing no signs of euphoria despite residing at an ATH.
If you have any questions about our equity CFD offering, just get in touch here.
The material provided here has not been prepared in accordance with legal requirements designed to promote the independence of investment research and as such is considered to be a marketing communication. Whilst it is not subject to any prohibition on dealing ahead of the dissemination of investment research we will not seek to take any advantage before providing it to our clients.
Pepperstone doesn’t represent that the material provided here is accurate, current or complete, and therefore shouldn’t be relied upon as such. The information, whether from a third party or not, isn’t to be considered as a recommendation; or an offer to buy or sell; or the solicitation of an offer to buy or sell any security, financial product or instrument; or to participate in any particular trading strategy. It does not take into account readers’ financial situation or investment objectives. We advise any readers of this content to seek their own advice. Without the approval of Pepperstone, reproduction or redistribution of this information isn’t permitted.