- English
- Italiano
- Español
- Français
- English
- Italiano
- Español
- Français

What's commonly known as curve ‘inversion’? I'm not sure this is going surprise too many as most bond traders had been calling for this to play out for weeks, and the question is whether this time is different?
It’s well known that all US (and often global) recessions for several decades have been foretold by an inverted yield curve.
Driven by ever greater rate hikes being priced by the market, we see short-term Treasuries selling off, with 2yr Treasury yields rising from 72bp (0.72%) to 245bp (2.45%) in the past 60 days – obviously an incredibly powerful move. We currently see nearly 250bp or 10 rate hikes priced in over the next two years into swaps markets. At the same time, US 10yr bonds have been held back by several technical factors that may well abate after the Fed starts to reduce its balance sheet and the ECB starts to hike.
(US 10yr – 2 yr yields with periods of recession)
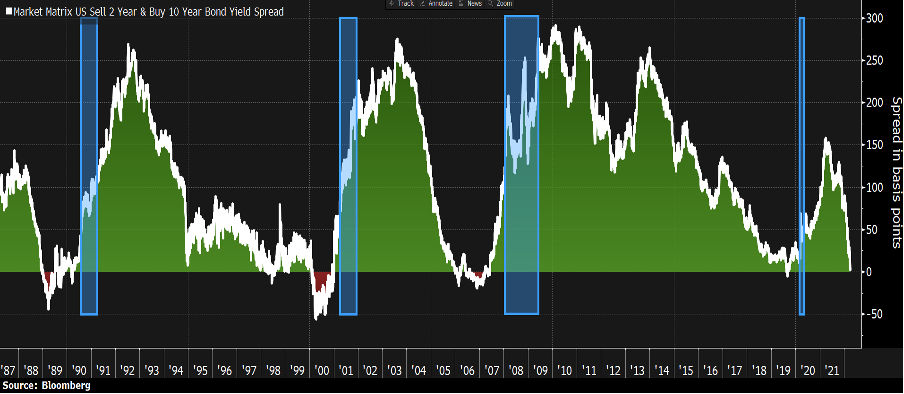
(Source: Bloomberg - Past performance is not indicative of future performance.)
There's been a meltdown on social media that the inversion spells impending doom and while I've an open mind that the curve has some undeniable predictive power – consider that since the late 1970’s the average time from initial inversion of the curve to the actual recession is 16 months – in 2005 it took 25 months from the initial point of curve inversion before we ultimately saw a technical recession play out.
The Fed are not remotely concerned by the inversion and sees the probability of a recession as a very low probability.
What's interesting is that while inversion has been a solid indicator of potentially tougher economic times ahead, what’s also important is how risk assets react. If we take the US500 in the last 10 occasions (of curve inversion), 1-month after inversion the average return has been +1.4%, 6 months +4.3% and 12 months +10.5%. While past performance doesn’t indicate future returns, history has told us that the inverted yield curve is not a reason in itself to sell risk assets – it’s when the curve starts to aggressively steepen – US 10yr yields rise at a faster pace than 2yr Treasury yields that the equity markets start to de-risk and go into drawdown.
This steepening is typically a factor that the world sees far greater economic fragility and prices out rate hikes, causing buying in short-term bonds and subsequently US 2yr bond yields fall (prices rise). So, while it may take some time for the market to see evidence of a trend lower in the PMI series, with a hit to business and consumer confidence and then a rise in unemployment – it is when the market pivots and prices out hikes that risk assets (such as equities) face greater headwinds.
The first question is whether the Fed left it too late to tighten? Most would say they did, but the Russian invasion has clearly accelerated the inflationary trends and suggested it could become entrenched. We ask should we trust the predictive powers of the curve this time around? The Fed say no, but others say this time is not different – see this article from former NY Fed president Dudley
Whatever the question, the most important factor for traders is how it translates to volatility – volatility defines almost every core aspect of trading and what we should look for is the moment we see a steeper curve. That is likely where we get another leg higher in volatility and better opportunities for short-sellers.
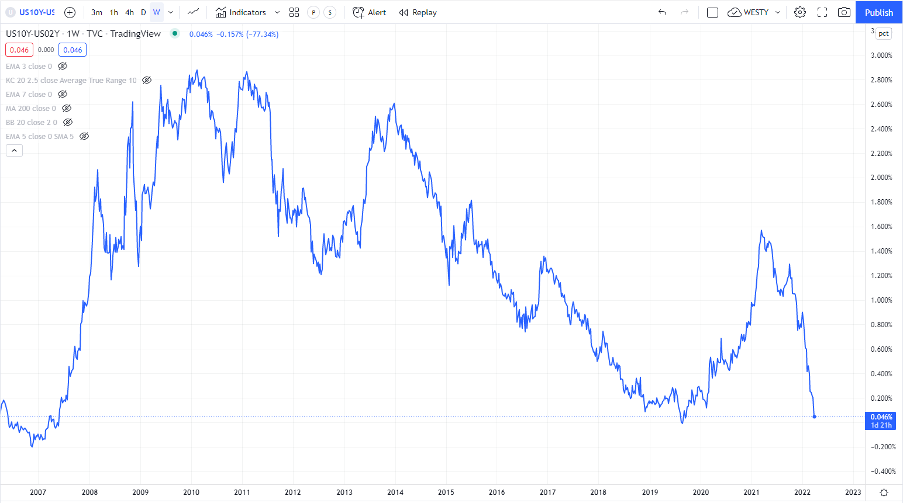
(Source: TradingView - Past performance is not indicative of future performance.)
For those using TradingView you can type in “US10Y-US02Y” into the search function and it will create this curve for you.
Related articles

Ready to trade?
It's quick and easy to get started. Apply in minutes with our simple application process.
The material provided here has not been prepared in accordance with legal requirements designed to promote the independence of investment research and as such is considered to be a marketing communication. Whilst it is not subject to any prohibition on dealing ahead of the dissemination of investment research we will not seek to take any advantage before providing it to our clients.
Pepperstone doesn’t represent that the material provided here is accurate, current or complete, and therefore shouldn’t be relied upon as such. The information, whether from a third party or not, isn’t to be considered as a recommendation; or an offer to buy or sell; or the solicitation of an offer to buy or sell any security, financial product or instrument; or to participate in any particular trading strategy. It does not take into account readers’ financial situation or investment objectives. We advise any readers of this content to seek their own advice. Without the approval of Pepperstone, reproduction or redistribution of this information isn’t permitted.