- English
- Italiano
- Español
- Français
- English
- Italiano
- Español
- Français
.jpg?height=93&quality=100)
DXY:
Markets have been a bit of snooze fest this week with a shorter 4-day week in the US and UK reducing trading hours as well as a light set of data. The big handbrake on volatility has been traders avoiding taking positions ahead of today’s Nonfarm Payrolls employment report. Last month’s weak figure set the tone in financial markets and compressed price movement in rates land. The 5-year yield has come off and is a representation of the market’s views about Fed policy. So tapering expectations are being pared back slightly. Comments from key Fed officials of late have had a slight more hawkish tilt and whether that is sustained will be dependent on today’s US jobs numbers. Over in Asia, Chinese policymakers have tried to cool the recent strength we’ve seen in the renminbi which was also causing some pressure on the broad dollar index. Yesterday’s weekly jobless claims coming in stronger than expected as well as the solid ADP print didn’t follow through in today’s Non-Farm numbers. We got a small miss, coming in lower than expected.
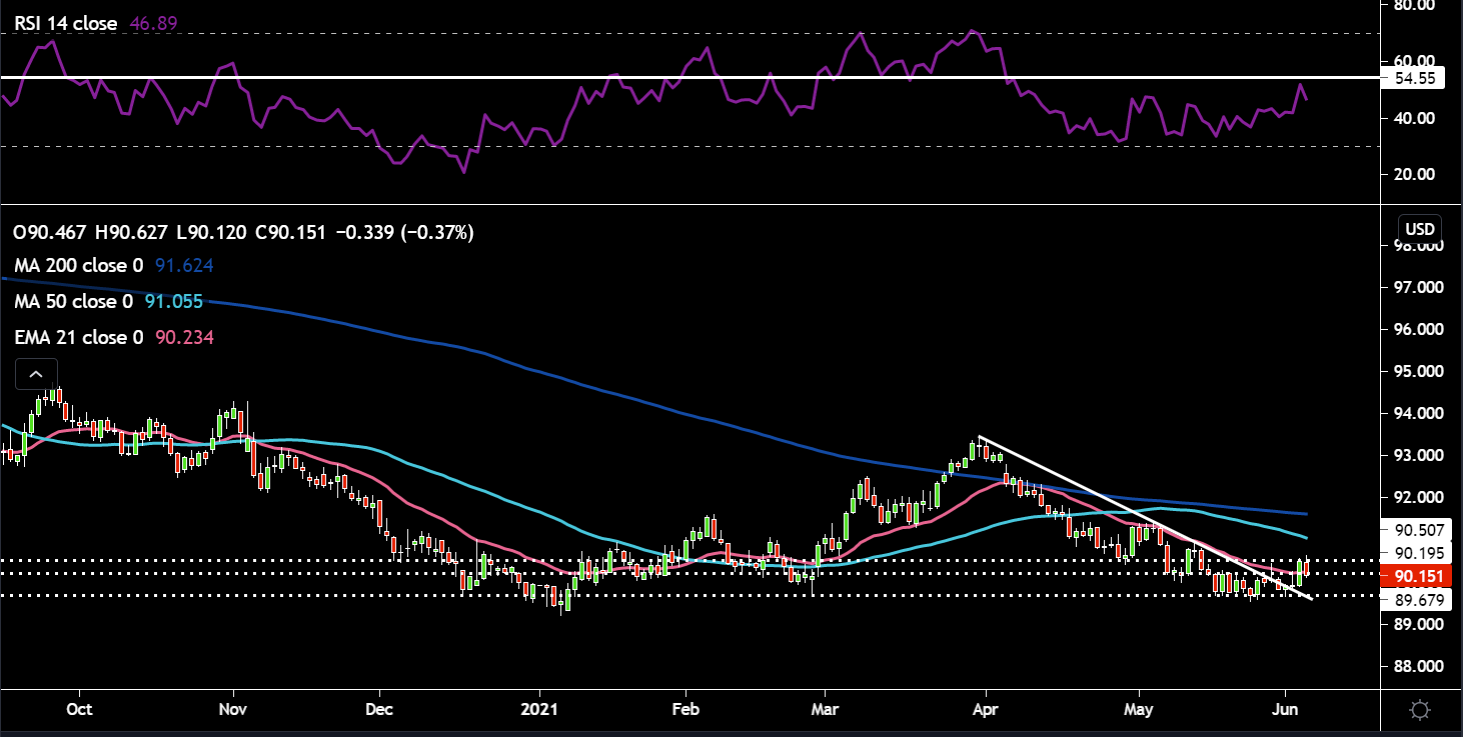
After breaking up above the downtrend line in place since April, the DXY surged above the 90.5 level, but after today’s weak jobs number has given back some of these gains and is now in the mid-90.1s region. Price is sitting right on the 21-day EMA, which may provide some support as well as the 90.2 horizontal dotted line. The RSI got close to the 54 level which marked previous price rallies and pulled back. We’ll have to see where we close up later tonight.
EURUSD:
Any strength for the single currency on the back of Russia’s announcement that it intends to eliminate its dollar holdings from its wealth fund, which would obviously found some of those funds flowing into the euro has vanished. A mixed week of data for Europe, with better than expected inflation and composite PMI’s combined with much weaker than expected German retail sales and a miss on euro area wide retail sales. Recent commentary out from ECB players indicate no change in the thinking regarding a shift towards policy normalization with next week’s ECB meeting being the big event risk for euro traders. Will they taper QE or won’t they that is the big question? Will do a preview on this early next week.
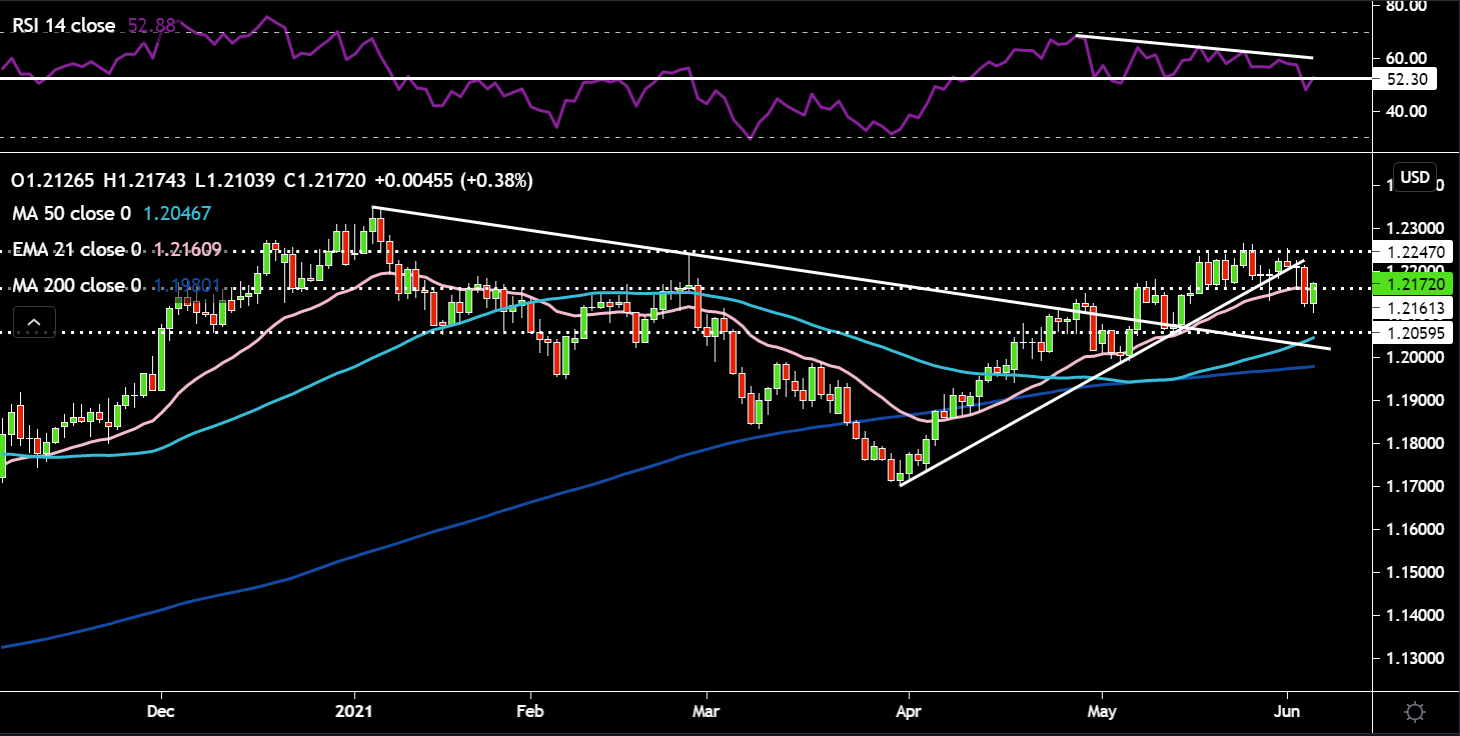
EURUSD has been under pressure since the end of May. The candle low broke the range low/horizontal support as well as the uptrend line around 1.216 yesterday. This level combined with the 21-day EMA is now acting as resistance. The 1.224 level is still proving too difficult for EURUSD to overcome. The divergence on the RSI as price made higher highs and the RSI made lower highs seems to have worked as a bearish omen. The RSI dipped briefly below the key 52 support level and is now just below it. The target to the downside would be 1.21 and then 1.205 support further down.
GBPUSD:
Pretty slim pickings on the data front for the pound, although the little there was moved in a positive direction and came in higher than expectations on the composite PMI and construction data. There were concerns about the Indian variant causing delays to June 21 reopening date, however, Boris Johnson has stuck to his script stating the data doesn’t point to delaying that date. With 75% of UK adults having received their first dose as well as 50% having their 2nd dose, the UK economy is looking like a good place to be. On the trade deal front, member nations of a Pacific regional trade deal agreed to allow the U.K. to begin the process to join (CPTPP) and India and the UK could seal a deal by year end. Issues in Northern Ireland are continuing with a meeting set next in the EU to try and iron out problems. Just today however, the EU have decided to remove barriers for medical supplies, but the issue of food products remains problematic.

The pound has been in a very tight range between 1.41-1.42. There is good support where price is now at the range bottom and the 21-day EMA, which should keep Cable on an upward trajectory in the short term. Like the EURUSD, the RSI dipped briefly below the 53 level and has now regained it. 1.425 the range highs is the initial price target to the upside. On the downside 1.40 would be a good level to watch.
USDJPY:
This cross continues to move in lockstep with the direction of US yields. Today’s NFP number caused yields to weaken by just over a percent. The USDJPY is almost down half a percent. It’s moved back below its overhead downtrend line. The RSI has rolled over. Both the 21-day EMA and the 50-day SMA around the low 109s offer support for deeper sell-offs.

Gold:
Real yields a fundamental driver of the yellow metal’s price direction has been moving higher over the last week, but is weaker today after the weak jobs number. Gold also got hammered yesterday as the dollar surged, indicating the risk for bulls if the dollar turns around and heads higher. The next US inflation report out on June 10 could also be a catalyst for some movement in gold. However, today the yellow metal is shining bright and putting in some serious gains.
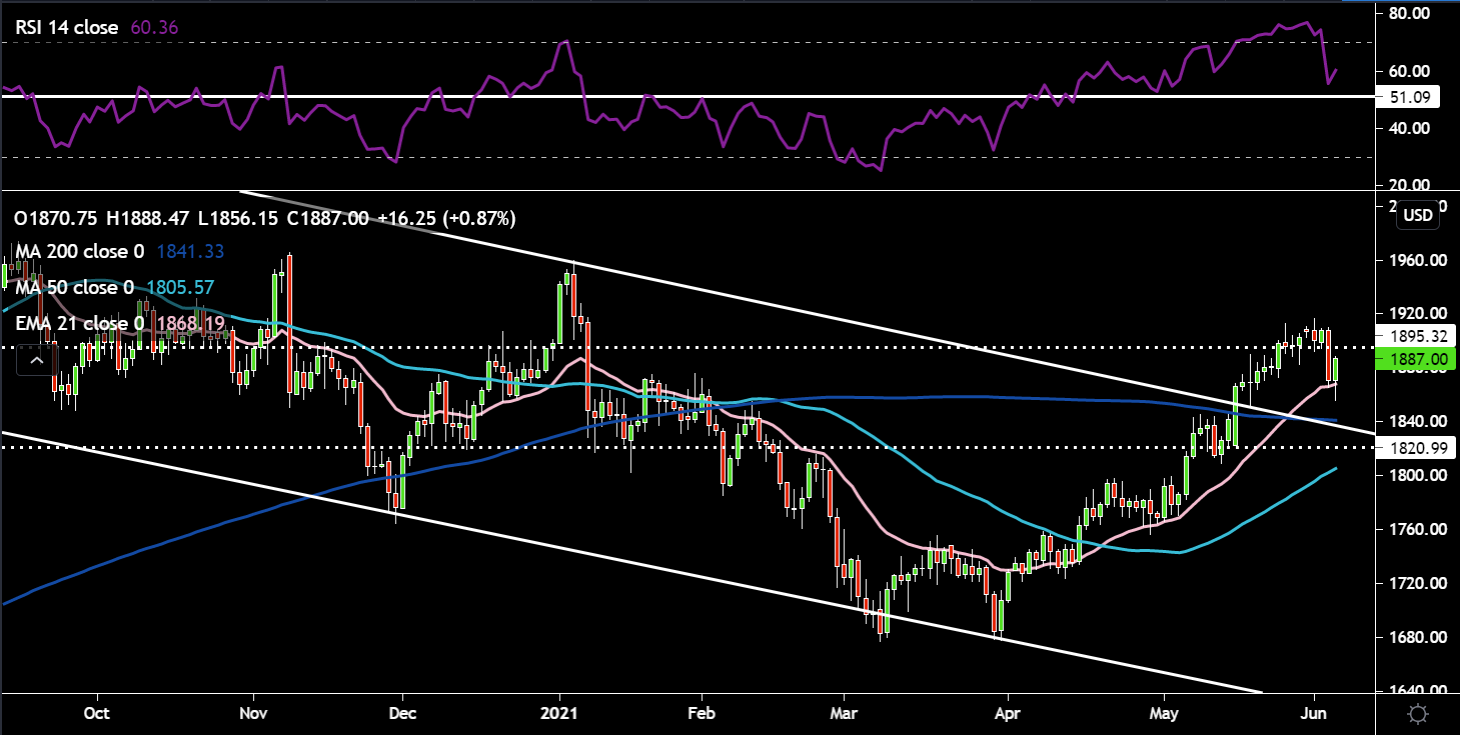
Price breached the important $1900 level. The candles with the long wicks tell me sellers are consistently coming in to push price lower. The RSI momentum indicator has dropped sharply out of overbought territory, but has turned up today. If the dollar and real yields continues to move higher we could see a re-test of the 200-day SMA and trend line around $1840/50. The 21-day EMA provided some support to price today around the $1868 level. On the upside $1900 and $1915 looks to be good first initial targets.
Oil:
The black liquid has been quite resilient despite seeing a stronger greenback. This is down to a positive reaction to OPEC+’s announcement that it will stick to its decision in April to release about 2.1 mln bbl/d of crude back onto the market between May and July. For production figures beyond July, we’ll have to wait till the next meeting on July 1. Iranian oil talks seem to have lost some momentum recently and the big question mark remains, however, OPEC’s Sec Gen believes higher Iranian supply should be able to be absorbed by the market. The futures curve would certainly back this as indicated by the solid backwardation currently occurring (tighter market). All this amidst an improving demand background too as economies reopen, has traders leaning bullishly in their positioning. Inventory data out from the US this week was very strong showing much higher than expected drawdowns in stocks.
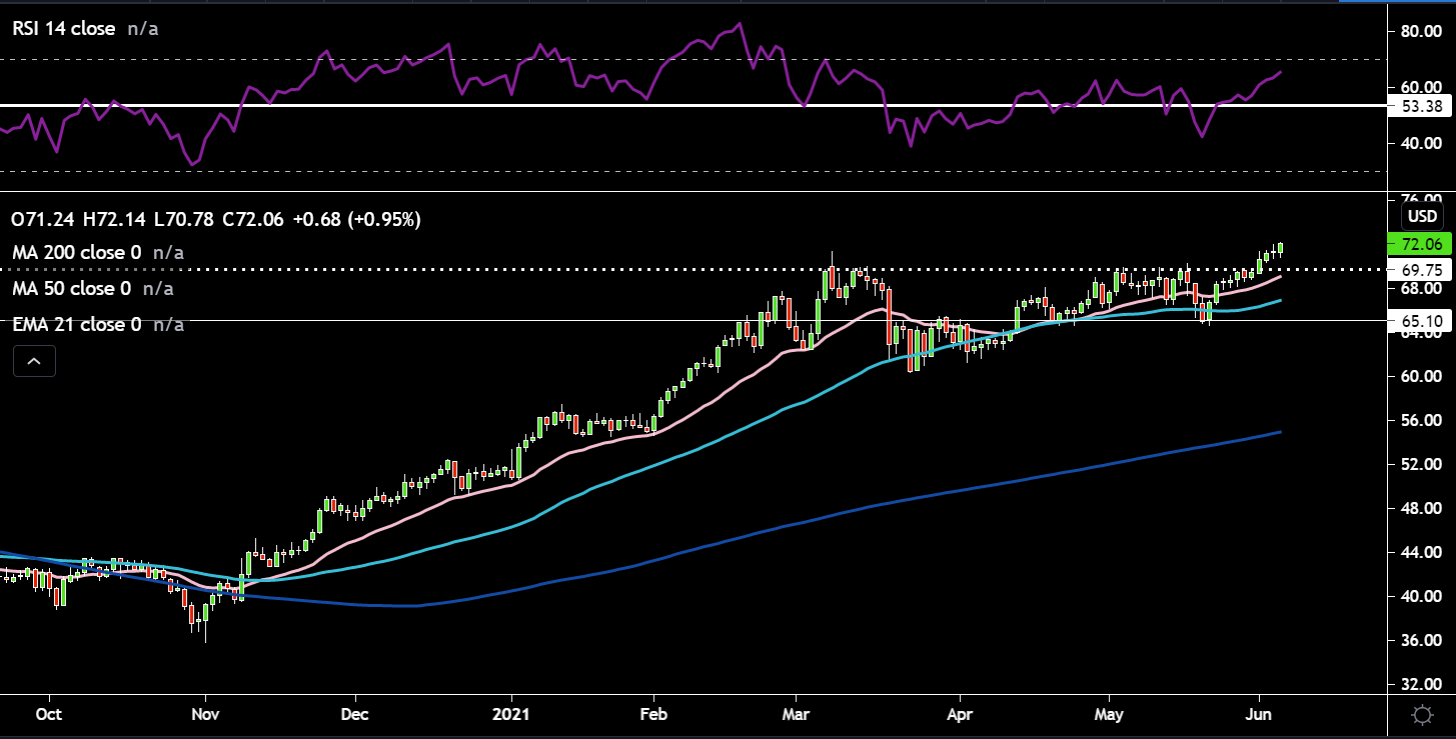
Oil is putting some headroom between itself and the sticky $70 overhead resistance. The RSI is moving higher and there is still room for a push higher before overbought levels become a problem. Both shorter term moving averages are pointing higher. We’re also above the March 8 high. The next big levels are $72 and $75 where price has run into resistance previously.
Bitcoin:
It’s quite incredible how a tweet from Elon Musk can move crypto markets. He tried to troll crypto holders with a broken heart emoji and some memes. It feels quite farcical even writing this, but that is what saw Bitcoin come under pressure yesterday. The Miami Bitcoin 2021 event is set to kick off this morning, which could see some exciting new prospects being spoken about and potentially move price.

Bitcoin has bounced off that lower trend line in the triangle pattern and is now in the high $36k region. There is lots of resistance in the form of the downtrend line, 21-day EMA and the 200-day SMA closer to the $40k zone. The RSI is pointing downwards, but in this case the divergence is bullish as price makes lower highs and momentum makes higher highs.
Related articles


Ready to trade?
It's quick and easy to get started. Apply in minutes with our simple application process.
The material provided here has not been prepared in accordance with legal requirements designed to promote the independence of investment research and as such is considered to be a marketing communication. Whilst it is not subject to any prohibition on dealing ahead of the dissemination of investment research we will not seek to take any advantage before providing it to our clients.
Pepperstone doesn’t represent that the material provided here is accurate, current or complete, and therefore shouldn’t be relied upon as such. The information, whether from a third party or not, isn’t to be considered as a recommendation; or an offer to buy or sell; or the solicitation of an offer to buy or sell any security, financial product or instrument; or to participate in any particular trading strategy. It does not take into account readers’ financial situation or investment objectives. We advise any readers of this content to seek their own advice. Without the approval of Pepperstone, reproduction or redistribution of this information isn’t permitted.