- English
- Italiano
- Español
- Français
- English
- Italiano
- Español
- Français
.jpg?height=93&quality=100)
Dollar Index (DXY):
The dollar continues to be driven by liquidity concerns (although 3-month EURUSD basis swaps have eased quite significantly, FRA/OIS spreads are still elevated) and tepid risk sentiment driving safe haven flows. It hasn’t been the strongest week for the greenback with hopes for a ceasefire growing. In terms of the specifics, Zelensky is dropping his pursuits of NATO membership. Russia also stated it doesn’t want to remove the current government in Ukraine. Maybe a compromise can be achieved. Diplomatic efforts continue to take place. Despite the 2-year and 10-year yield surging higher the dollar stayed offered. In fact the 2s10s curve continues to flatten as stagflation rumbles on and the specter of a policy mistake becomes more widespread. Inflation data out yesterday printed bang in line with consensus forecasts across the headline and core figures. Therefore, the market’s reaction was non-existent. The ECB meeting overshadowed this key data point. The December 2022 Fed Fund Futures contract has v-shaped to now price in around 6.7 hikes. A lot of the uncertainty has been sapped from next week Wednesday’s Fed Meeting, given Jerome Powell’s guidance for a 25bps hike. This makes the press conference more important and the economic projections they release. I do wonder if the ECB’s decision on Thursday will affect the psyche of the Fed.

(Source: TradingView - Past performance is not indicative of future performance.)
DXY found a floor at the 98 level and has now rebounded higher. The RSI dropped below the overbought line to 60 and is reversing course. The 21-day EMA will provide useful insights as a dynamic support tool. Targets wise, 98 on the downside and on the upside the previous short term high at 99.428 will be the ones to watch.
EURUSD:
The twin divergences of energy and monetary policy was the pressing force of EURUSD moving lower. Then on Wednesday the euro surged higher from a Bloomberg headline about a significant joint debt programme to fund energy and defence spending. Will fiscal hawks like Germany support another recovery fundesque though? Yesterday’s ECB’s meeting definitely caught a lot of people off guard, including myself. The war has been described as a watershed moment for Europe. They decided to push ahead with the tapering of their APP purchases, lining up Q3 as a potential expiry date. However, Lagarde wanted to emphasize being data driven as opposed to calendar based. Previously the APP schedule was open-ended with €40 billion in Q2, €30 billion in Q3 and then dropping to €20 billion in Q4 for as long as necessary. This has now been sped up to €40 billion in April, €30 billion in May and €20 billion in June. The statement also removed the word “lower” in relation to the level at which interest rates would be kept at until their forward guidance conditions are fulfilled. Lastly, on the topic of policy rates – rates could be hiked “some time” after the end of net purchases as opposed to APP ending “shortly” before hikes occur. The hiking path as per the statement is expected to have a more gentle gradient and be gradual. Lagarde attempted to provide some additional detail around the phrase “some time”. She stated it could be the week later, but it can be months later i.e. it’s not the time horizon that matters but rather the data. Speaking of data, this year’s inflation and GDP growth were revised sharply in different directions – stagflation. 2023’s inflation is at 2.1%, revised up from 1.8% and 2024 is just below target at 1.9% vs 1.8% previously.
ECB hawkishness first led to a sharp rally higher then the move was faded as memories of former ECB Governor Trichet’s 2011 rate hike mistake began to resurface. Periphery countries’ spreads blew out which is not typically a positive for the euro. Over the medium-term the economy would struggle – it’s already suffering a major supply shock and the last thing that’s needed is a jumpy central bank overtightening financial conditions. I think these fears are filtering through to the euro’s price action. €STIRs are pricing 11bps by July and around 45bps by December 2022. So the July meeting is live and 2 hikes by the end of this year – punchy!

(Source: TradingView - Past performance is not indicative of future performance.)
The EURUSD tagged the 21-day EMA and has retraced its post ECB gains. Price is now close to the lower trend line of the descending channel (just below 1.10). The RSI still has some room before it reaches oversold territory. Targets wise, 1.11 on the upside will act as resistance and on the downside the former low of 1.08 will be key.
GBPUSD:
Cable has been very choppy, closely following broad risk sentiment’s choppy behaviour. GBP rates markets are pricing more than 100 basis points of BOE hikes by June. That would mean two 25 bps hikes and one 50 bps hike spread out over the next three meetings. That’s very aggressive in my humble opinion. GDP data out from the UK this morning was solid, but hasn’t encouraged GBP bulls to bid sterling against the dollar. Technicals wise, price has slipped below the 1.31 level and in the high 1.30s. The RSI is right on the oversold boundary again. On the upside 1.32 will likely act as resistance now and on the downside 1.30 will be key. Cable was last at these levels in November 2020.
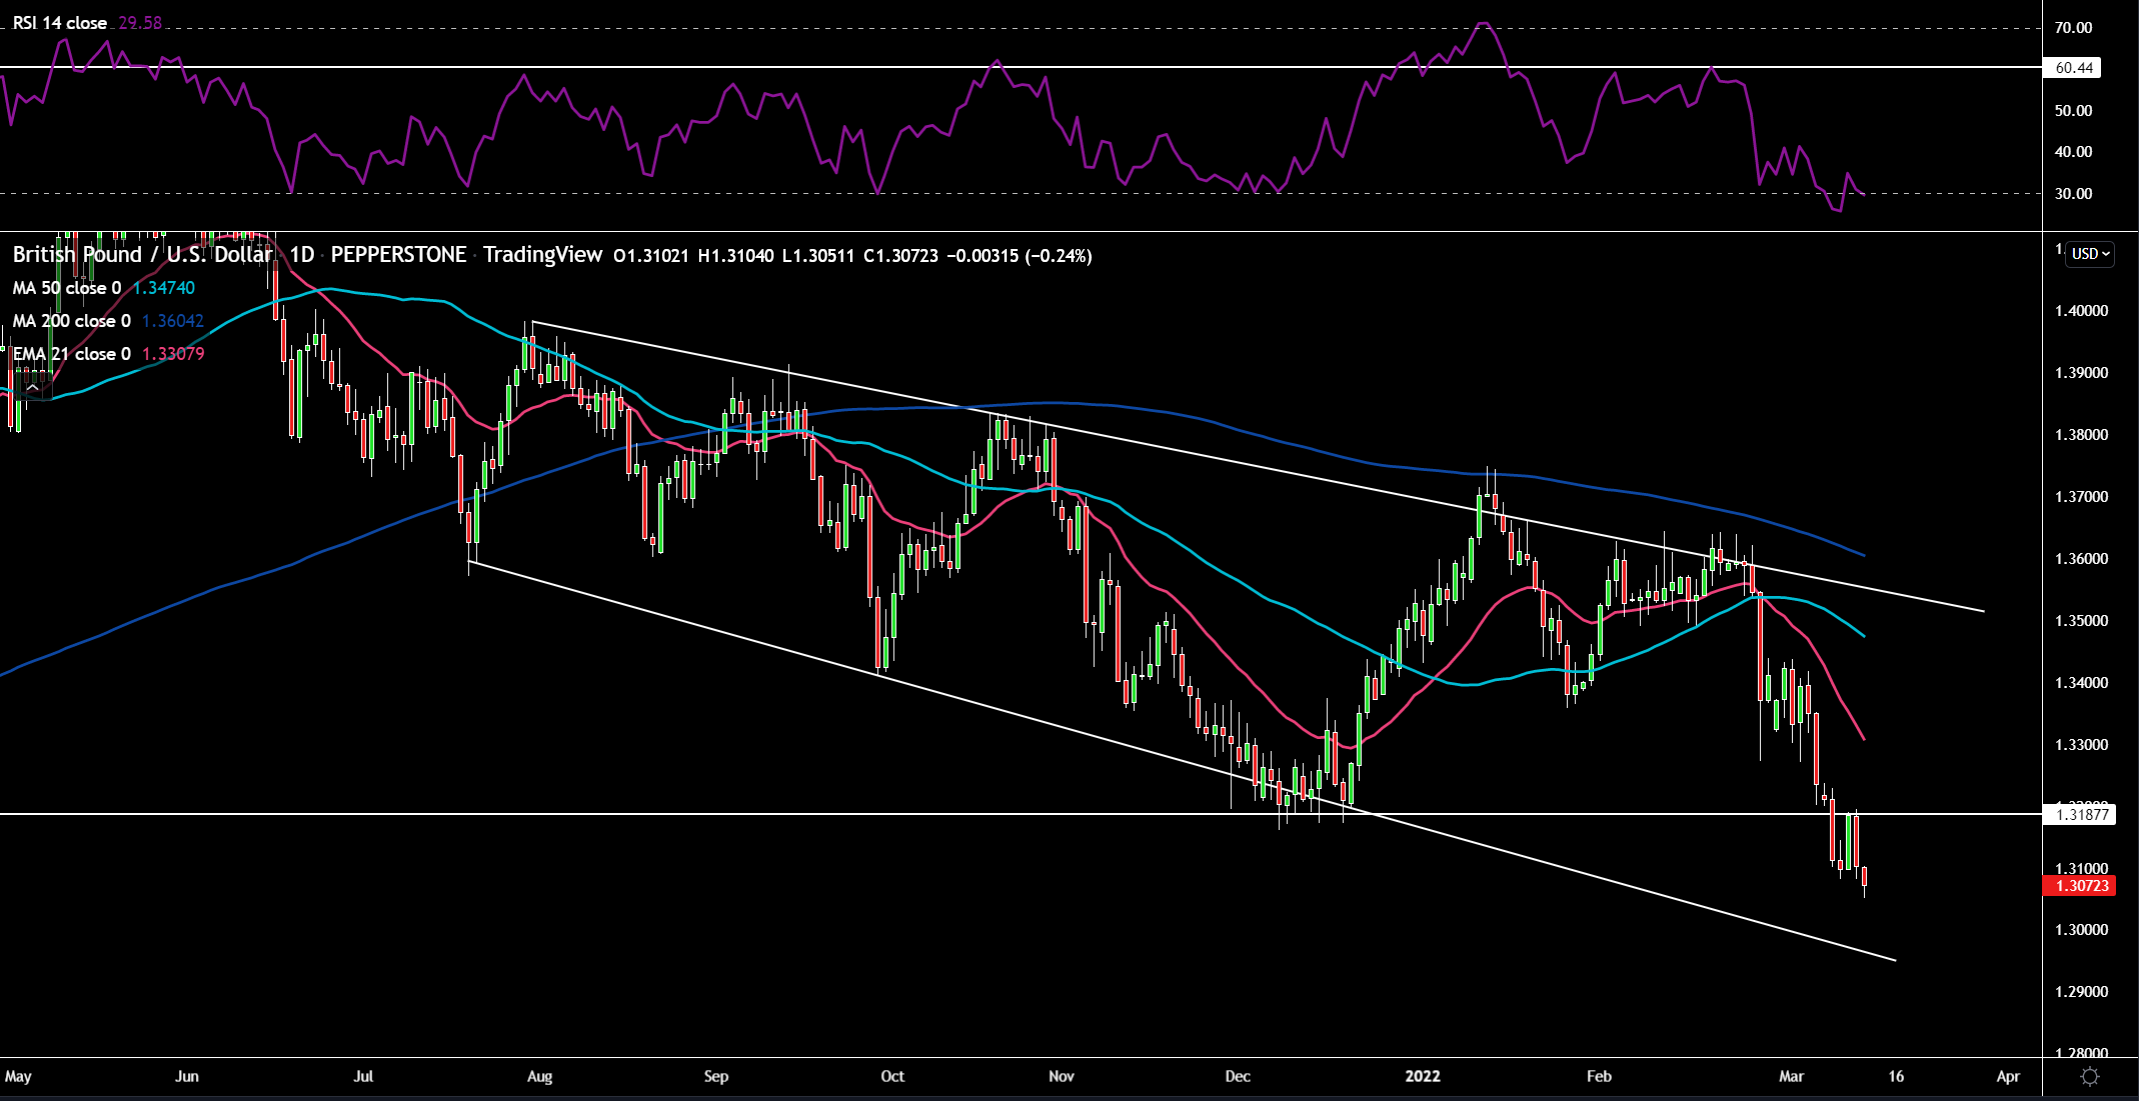
(Source: TradingView - Past performance is not indicative of future performance.)
USDJPY:
BoJ Governor Kuroda was on the wires once again this week In Japan. He stated it would be incorrect to normalize policy because of commodity driven surge in inflation. Wages hold the key for movement from the BoJ. We got data in that regard this week with the annual rise at 0.9% vs 0.1% exp. Winter bonuses was the main driving force behind the strength. So next month’s figure will be interesting to see if there is a big slump in wage pressures as the once off effect is removed. Japan’s terms of trade continues to be adversely effected by its reliance on oil imports. If the Ukraine situation improves USDJPY should travel Northbound as yield differentials come back in vogue. Japan Q4 final estimate of GDP growth actually missed quite significantly to the downside. This was likely effected by the difficult time Japan have had in taming covid, requiring tighter rules. US treasury yields are definitely helping take this pair higher.

(Source: TradingView - Past performance is not indicative of future performance.)
USDJPY has finally broken through the sticky 1116 level, taking out the previous tops. 117 beckons now. The RSI is not far off overbought, but does show some negative divergence with price. It looks like a flat-sided ascending triangle has formed on the charts. On pullbacks 116 should not act as a price support and will be key to watch for USDJPY.
Gold:
The big story for gold this week was the huge squeeze through $2000 an ounce. There wasn’t any particular news flow to catalyse such a move, leading me to believe this was more of a flow driven short squeeze with many stops likely taken out as price hit a high of $2070. Real yields have been getting hammered as inflation soars on the back of crude going through $130. Gold got hit hard as risk assets were bid on more optimistic news regarding the conflict. Gold’s next big test will be at next week’s Fed meeting.

(Source: TradingView - Past performance is not indicative of future performance.)
Gold is now hovering just below the $2000 level. The RSI has come back to the 62.8 level. The bottom pane indicator I created has also retraced lower to the 6.61 line. Targets wise $1975 has shown some support. There are no obvious target levels on the upside above $2000.
Crude Oil:
Crude has had another interesting week, beginning with the US banning the import of Russian crude. This was followed by the UK who will phase out Russian oil by the end of this year. There was also a report released that stated UAE wanted OPEC+ to increase production, combined with positive diplomatic noise out of Ukraine. This led to oil plunging lower closing down 12.64% The UAE issue was quickly reversed the next day with them stating they support the opinion of OPEC+ at the moment. Inventory data from the US saw another drawdown in crude levels. Yesterday, the ICE exchange raised crude futures margins by 32%, which clearly led to some forced liquidations for those who could not meet the hefty new requirements. All the positivity around the Iranian Nuclear talks seems to be fading as Russia is prevent the deal from being sealed by including unacceptable conditions in the deal such as shielding their economy from the West’s sanctions.

Crude seems to have found some support around the 110 level (just above the 21-day EMA). The RSI is reversing higher from around the 60 level. A breach below 110 would be a significant development. On the upside another burst through $120 would be key for bulls.
Related articles

Ready to trade?
It's quick and easy to get started. Apply in minutes with our simple application process.
The material provided here has not been prepared in accordance with legal requirements designed to promote the independence of investment research and as such is considered to be a marketing communication. Whilst it is not subject to any prohibition on dealing ahead of the dissemination of investment research we will not seek to take any advantage before providing it to our clients.
Pepperstone doesn’t represent that the material provided here is accurate, current or complete, and therefore shouldn’t be relied upon as such. The information, whether from a third party or not, isn’t to be considered as a recommendation; or an offer to buy or sell; or the solicitation of an offer to buy or sell any security, financial product or instrument; or to participate in any particular trading strategy. It does not take into account readers’ financial situation or investment objectives. We advise any readers of this content to seek their own advice. Without the approval of Pepperstone, reproduction or redistribution of this information isn’t permitted.