- English
- Italiano
- Español
- Français
- English
- Italiano
- Español
- Français

Despite the lack of any real broad market volatility, with the VIX index now sitting at a lowly 12.3% and FX implied volatility not too far off its 12-month low, we can still come very interesting dynamics in markets.
Firstly, congratulations to the Springboks for playing an incredible game. Once again the game was won on defence, which is something we can take out and adopt for our trading - that is, the holistic assessment of event risk, implied volatility, and position sizing among other aspects, where if you can get your defence on point, the ability to grow the trading capital will come. It’s strangely fitting as well that we see the ZAR spiking 1% against the USD in the early FX open, with USDZAR into 14.86. When you see scenes of celebration in SA, it's hard not to think retail spending will get a boost, although the bigger driver has been the fact Moody’s decided not to downgrade SA’s credit rating to junk.
USD downside has further to go
If we focus on the offence today, and opportunity, it's hard to go past the moves in the USD, with the DXY falling for five straight days, and losing 0.6% on the week. The bulls are holding the 18 October swing with dear life here, although, if we turn to the weekly chart for oversight, we see a break and retest of the 2018 uptrend, and where a break of the 50-week MA takes us into the 96.0 level. For price action traders, we’ve seen both a bearish outside week and monthly key reversal, which suggests if the sellers kick in early this week then we could see a further liquidation of USD longs.
Of course, if we are going to see the DXY lower, we need to assess proceedings in EURUSD. It's no surprise then that we saw EURUSD print a bullish month reversal in October and that has been a pretty reliable guide to future moves, really since the inception of the EUR in 1999. Thus, it would not surprise to see a move in the near-term into 1.1200/50 zone, although we really need to see how price acts should we see a break of the 22 October high of 1.1179. All eyes on ECB president Christine Lagarde who speaks tomorrow (06:30 AEDT) and could set the tone for her time at the helm of the ECB. The market will expect Lagarde to have a bearish influence on the EUR, so it may be what she doesn’t say that promotes a move higher in the EUR.
A net beneficiary of the USD weakness has been the emerging market (EM) trade, although we can exclude the ZAR and CLP here. But we’ve seen solid buying in the COP, PLN and TRY, with these currencies gaining 2.1%, 1.4% and 1.1% respectively (on the week) against the greenback last week. Lower implied vol and some better selling in fixed income has put a bid back into carry, and the idea of being paid to be in a position is in play. The EEM ETF (iShares MSCI EM ETF) rallied an impressive 1.5% on Friday, breaking its ST consolidation and it feels as though this can have a tilt at the 52-week highs of $44.84 soon enough.
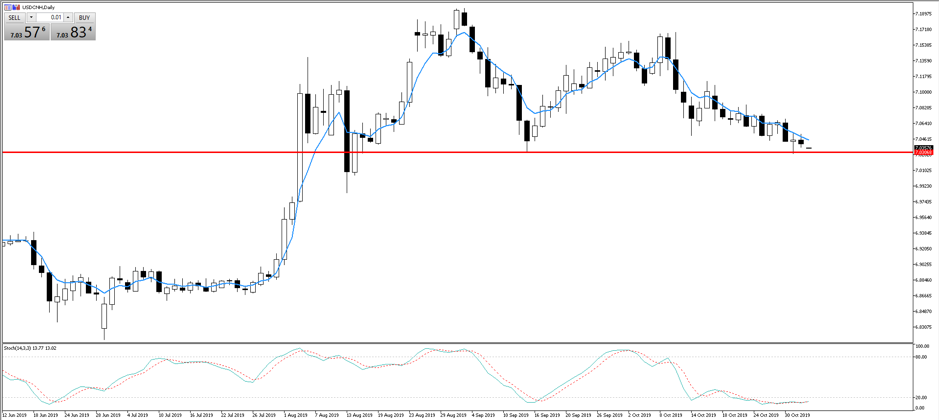
Of course, this is not just a vol and USD play, but China is key here, and a better feel on its economics, with a turn in industrial production, Caixin PMI, amid a rising credit impulse has helped. Watch USDCNH (see below), and a break below 7.0309 would be big development, and likely promote a higher AUDUSD and EURUSD.
Bullish set-ups and structures in equities
Another clear talking point has been the moves in US and EU equities. The market has been treated to a series of positive headlines on trade, with a deal on ‘phase one’ had been reached in principle, and this could be signed through in the next two weeks, with headlines this morning that it could take place in the US, while Europe could get a boost as US Secretary of Commerce, Wilbur Ross, has detailed this morning that "US may not need to put tariffs on European cars".
We can then add in the data flow and a Fed prepared to keep the expansion going in earnest and in no rush to do anything with policy. The fact the Fed’s balance sheet is now expanding again, even if its ‘not QE’, as the Fed buys $60b p/m in Treasury bills, is also in the mix and while they are not buying duration assets, which influences the yield curve, there is no doubt the market senses better liquidity dynamics and reduced USD scarcity worries.
The data on Friday again fitting this ‘goldilocks’ scenario, where US payrolls came in at 128,000, which was better than the 85,000 eyed, and made even more impressive when we consider the 95,00 positive revisions for the last two months. Average hourly earnings in as expected at 3%, while the U6 unemployment rate did tick higher to 3.6% it was down to the participation rate moving into 63.3%.
The ISM manufacturing print came in at 48.3, slightly below the 48.9 consensus, although the market, on reflection, had probably positioned for worse given the numbers seen in the regional prints. The wash-up was a 3bp move high in US 2-year Treasury yields, with a slight bear flattening of the 2s10s curve to 15bp, and 3bp decline in real yields, which has supported the gold price above $1510.
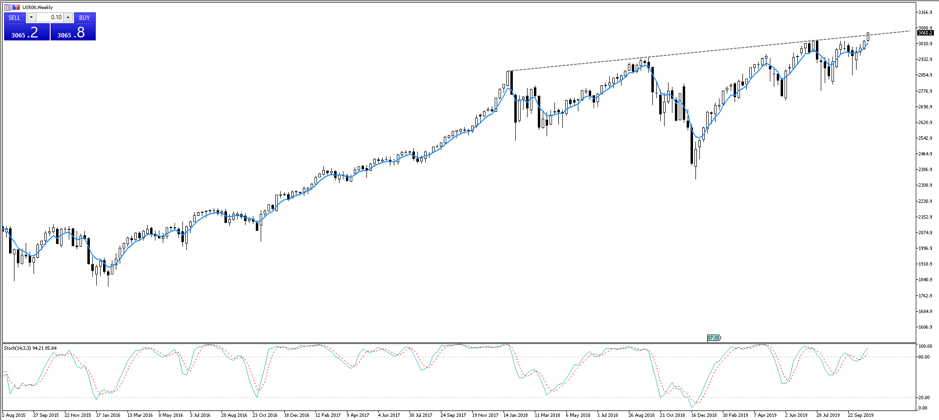
The S&P500 closed up 1.0% at 3066, and above the rising trend resistance (see below). The quality is there for me, with good breath in the rally (74% of stocks moved higher), volumes were 7.7% above the 30-day average. We’ve also seen small caps outperforming, with the Russell 2000 closing up 1.7% and approaching 1600, which has acted as resistance through the whole of 2019. A break here and I’d feel very favourably on a renewed bull trend here. We can also see high beta names clear outperforming lower volatility stocks and again, again a bullish sign.
Turning to the open
Asian equities will find buyers easy to come on the open, with S&P 500 futures some 0.7% higher from 16:10aedt. Aussie SPI futures are 26 points higher from the cash close, while Nikkei 225 futures are 0.5% higher since its cash market close. Locally the banks will get some focus with Westpac announcing, what look to be slightly-below-consensus FY earnings of $6.85b, and a $2b capital raising. The AUD will get some attention this week given the event risk, and the fact the daily chart offers scope for a move into 70c. The potential catalyst starting today with September retail sales due at 11:30aedt and a number above 0.4% only promoting a further bid across the rates curve, although with just a 44% probability of a cut in the 4 February meeting, pricing, at this stage feels full.
The material provided here has not been prepared in accordance with legal requirements designed to promote the independence of investment research and as such is considered to be a marketing communication. Whilst it is not subject to any prohibition on dealing ahead of the dissemination of investment research we will not seek to take any advantage before providing it to our clients.
Pepperstone doesn’t represent that the material provided here is accurate, current or complete, and therefore shouldn’t be relied upon as such. The information, whether from a third party or not, isn’t to be considered as a recommendation; or an offer to buy or sell; or the solicitation of an offer to buy or sell any security, financial product or instrument; or to participate in any particular trading strategy. It does not take into account readers’ financial situation or investment objectives. We advise any readers of this content to seek their own advice. Without the approval of Pepperstone, reproduction or redistribution of this information isn’t permitted.