- English
- Italiano
- Español
- Français
- English
- Italiano
- Español
- Français
Daily Fix: Implied volatility rising, and this could be very telling
If we contrast the slight grind higher in US equity index IV to the sizeable increases in implied volatility in gold (white), bonds (green), FX (purple) and oil (red) as factored year-to-date, we can still see implied volume in equities, while turning higher, is still far lower than other markets. Will that change like we saw in May?
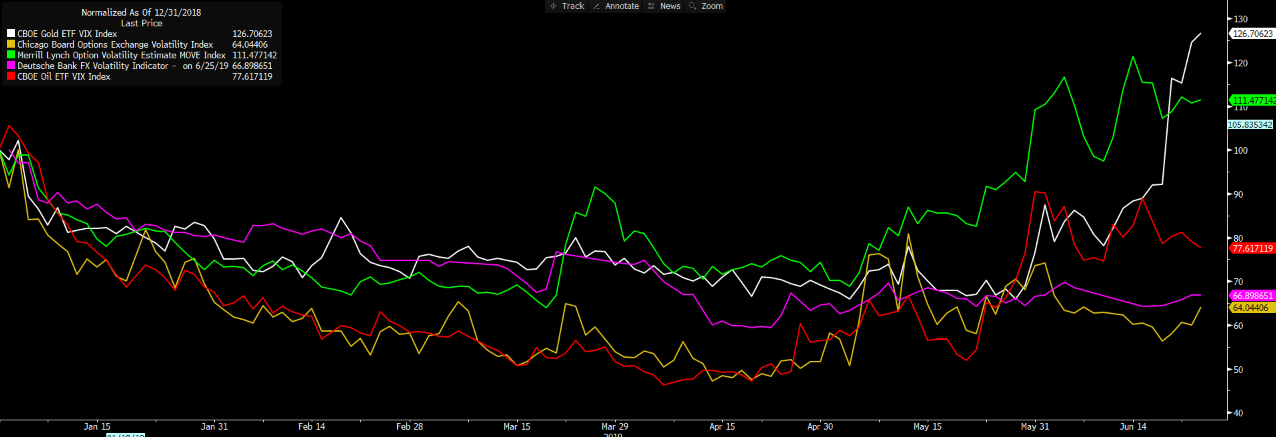
"Source: Bloomberg"
Equity volume is turning higher, though, as traders feel price moves will divert increasingly from a mean. Variance will therefore pick up. If I look at the Nasdaq 100 (NAS100), we can see a strong underperformance overnight, with a fall of 1.7% vs a 1% decline in the S&P 500. The daily setup looks interesting, with price having printed a bearish momentum crossover, as price closed through the recent uptrend. A break of 7600 takes the index to 6934 (the major double-bottom). And if risk aversion does pick up from here as we navigate through the G20 summit, the Nasdaq 100 would be the weapon of choice for me.
While we tend not to look backwards, the overnight US consumer confidence report requires attention, with the headline reports dropping a sizeable 9.8 points to 121.5. While this needs in-depth investigation, when we overlap US consumer confidence (white) with the S&P 500 and periods of recession (in the US), we’re suddenly paying attention here, especially given turning points in US consumer confidence have played out before key drawdowns in the S&P 500 — one the equity bears will now be keen to follow.
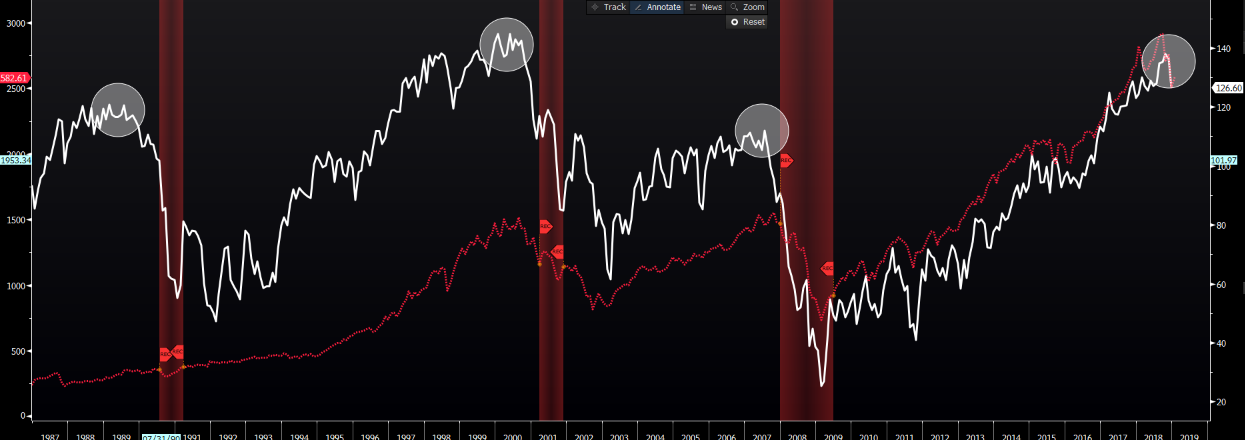
"Source: Bloomberg"
We can also look within the consumer survey and see the “labour market differential component,” which looks at respondents (of the survey) who said “jobs are plentiful” versus “jobs that are hard to get.” Here, I’ve inverted the chart (the white line) to better highlight the correlation with the US unemployment rate. We thus find the move lower in this survey (we see this chart higher) could lead to a higher unemployment rate. Another red flag to watch going forward with the labour market, as it’s in most other economies, is key.
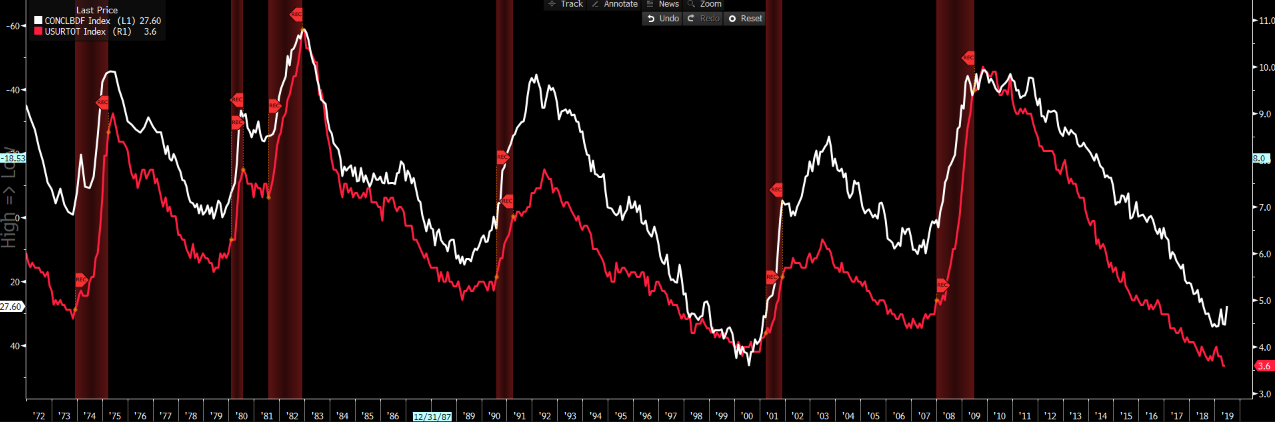
"Source: Bloomberg"
While having heard from Federal Reserve Governor Jerome Powell, another talking point was comments from St Louis Fed Governor James Bullard, which had stolen the limelight, causing US two-year Treasury yields to push up about five basis points, and USDJPY 50 pips, although traders eventually faded the move. Along with Nael Kashkari, we know Bullard is the big dove on the Fed board, so it won’t surprise that he’s arguing for an insurance cut at the July FOMC meeting.
But when the market has gone some way to pricing in a 50bp (or 0.5ppt) cut at this meet, and they hear Bullard say the “situation doesn’t call for 50bp,” we take notice. It’s a reason why we’ve seen a doji candle and indecision in the USD index (USDX), with a rejection off the 200-day MA. It’s why USDCHF has stabilised, although price printed a lower high and remains contained into the five-day EMA, as well as why EURUSD has moved back to 1.1357.
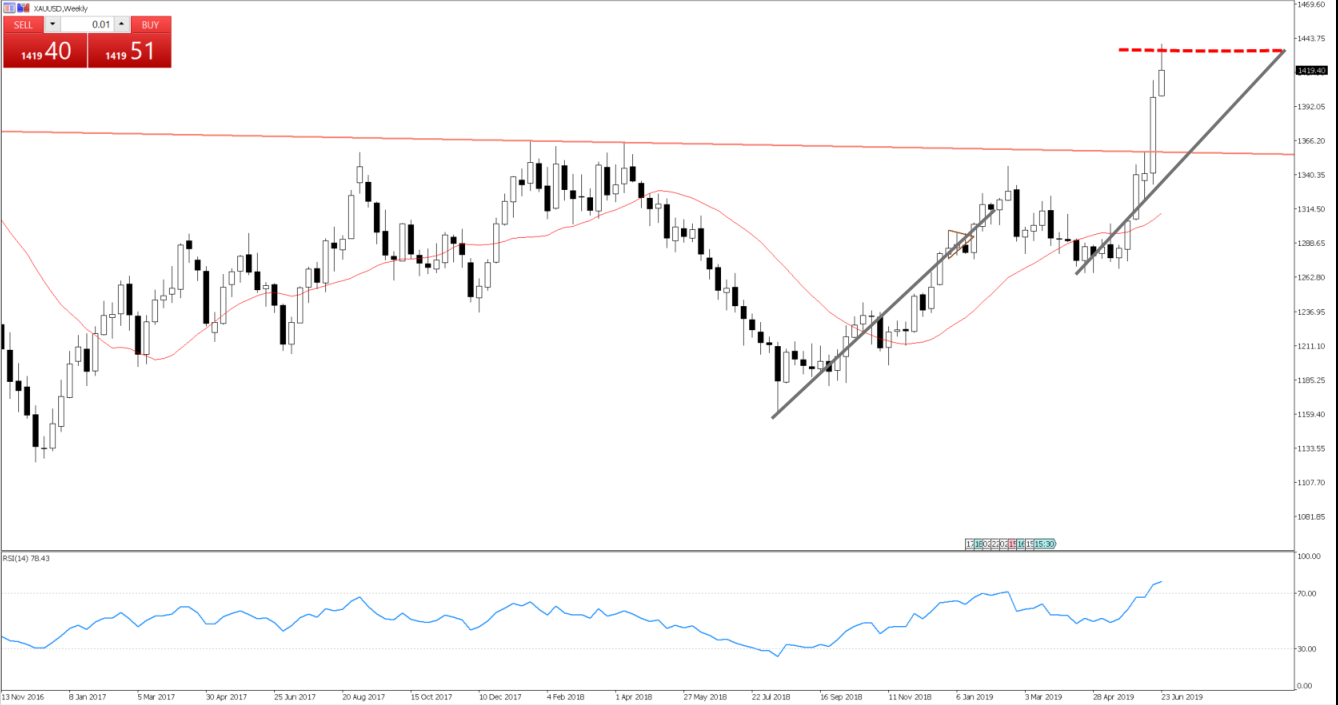
We’ve seen gold sellers, and that’ll not surprise given how frothy things had become. We’d seen price push into US$1,440, which was a full 100% extension of the measured move off the May lows. If the market is questioning a 50bp cut, then that in itself has been enough to see a few gold longs take some exposures off the table. The market wants to buy dips here, though, so we look at US$1,400 (the 23.6% fibo retracement of the 31 May rally) ahead of US$1,376 (38.2% fibo).
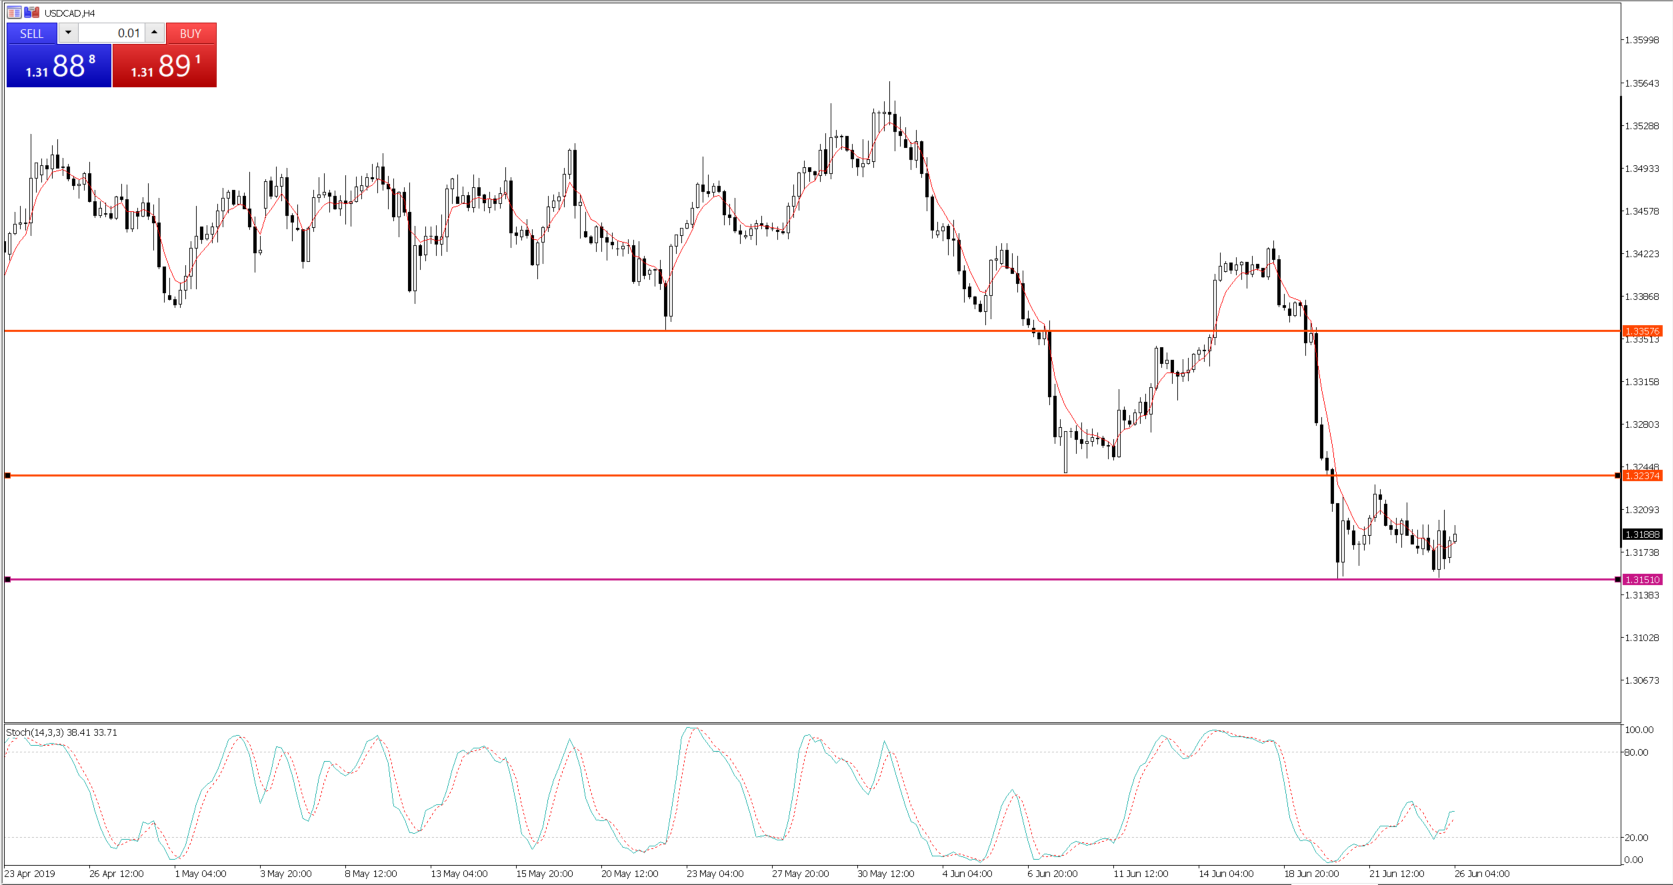
USDCAD is on high alert, with price looking like it wants to break the double-bottom at 1.3150. Flip to the four-hour chart, and we can see how price has reacted to these horizontal support/resistance levels. A break of 1.3150 on the four-hour would be a trigger. But, of course, when we’re trading, it’s all about how the price behaves when we do see these breaks that matter most.
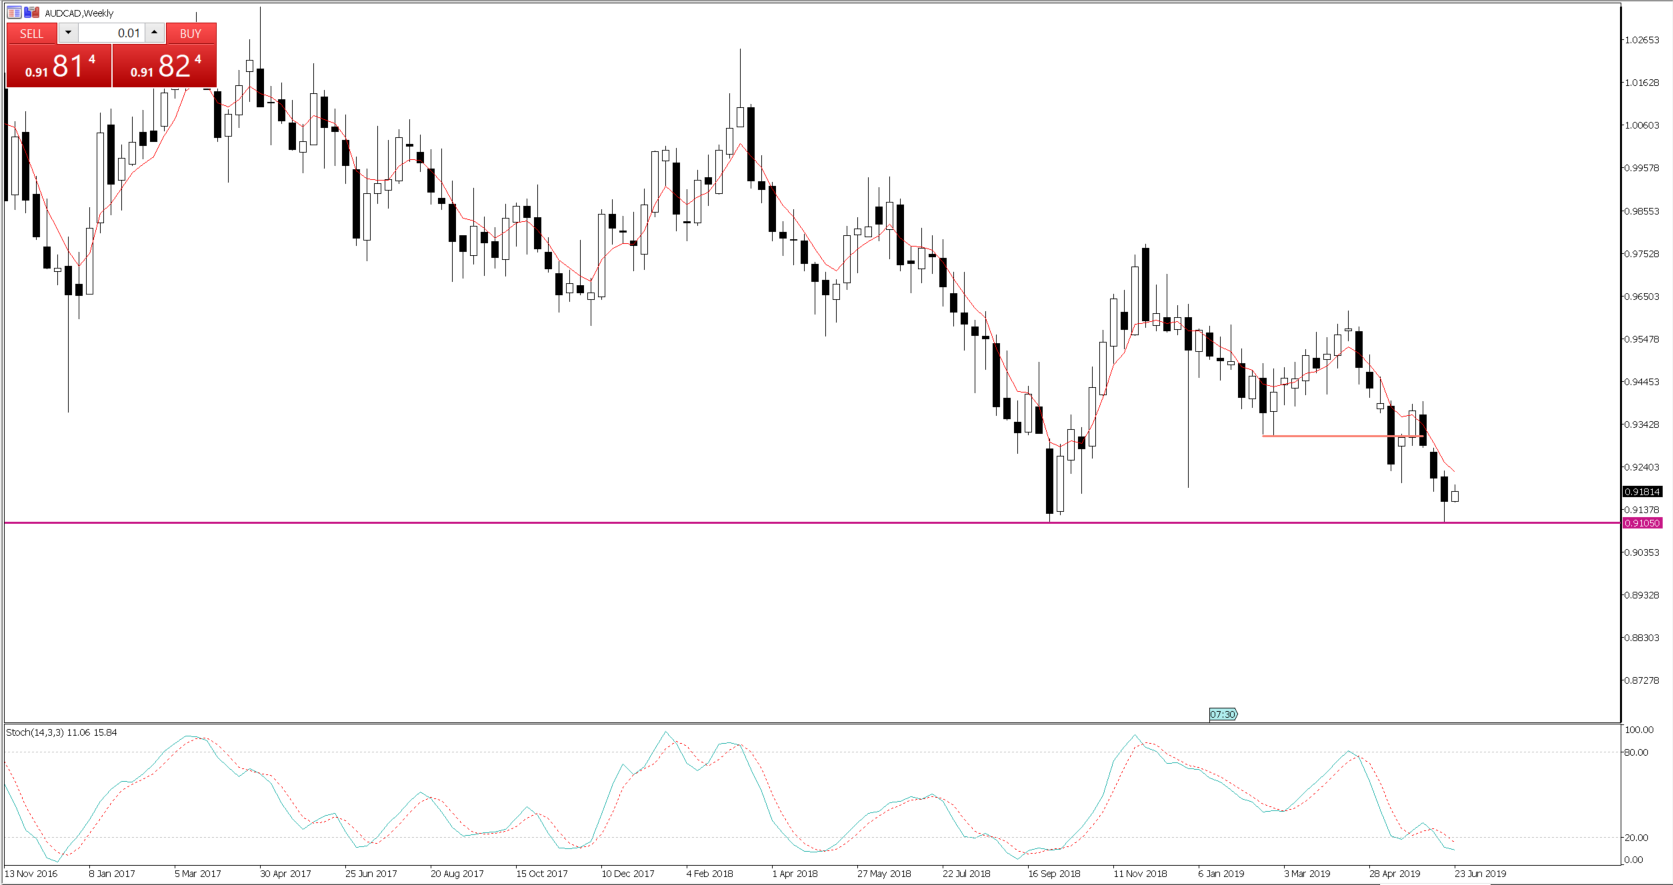
Expect shorts in AUDCAD to get attention, too — specifically, should price close firmly below the recent double-bottom.
The CAD has performed well in G10 FX in the past two sessions, largely as a result of a better feel to crude, which found a bid on the back of the API (American Petroleum Institute) crude inventory report overnight showing a 7.55m barrel draw. Traders will see the API inventory report and extrapolate this outcome to the more influential DoE (Department of Energy) inventory report. The DoE report is due 27 June at 00:30 AEST, two hours after the US durables good report. With consensus estimates calling for a 2.83 million barrel draw in crude inventories, US crude probably needs to see a drawdown of over four million barrels — or the risk is we see sellers. Should we see over four million barrel draw, it could hold push CAD through these key levels.
The material provided here has not been prepared in accordance with legal requirements designed to promote the independence of investment research and as such is considered to be a marketing communication. Whilst it is not subject to any prohibition on dealing ahead of the dissemination of investment research we will not seek to take any advantage before providing it to our clients.
Pepperstone doesn’t represent that the material provided here is accurate, current or complete, and therefore shouldn’t be relied upon as such. The information, whether from a third party or not, isn’t to be considered as a recommendation; or an offer to buy or sell; or the solicitation of an offer to buy or sell any security, financial product or instrument; or to participate in any particular trading strategy. It does not take into account readers’ financial situation or investment objectives. We advise any readers of this content to seek their own advice. Without the approval of Pepperstone, reproduction or redistribution of this information isn’t permitted.