- English
- Italiano
- Español
- Français
- English
- Italiano
- Español
- Français
.jpg?height=93&quality=100)
DXY:
Despite the tantrum thrown by the market after Jerome Powell’s Webinar, I actually think he did a good job. He read from the same script, mentioning – “we will be patient, we’re still a long way from our goals.” Rates won’t lift-off until full-employment and inflation of 2% has been achieved for some time. So there was no surprises on that front. Unfortunately, the market was expecting its hand to be held and at least thrown something to nibble on. The Fed can’t keep stepping in every time the market has a minor wobble. That’s not their job. So I’m quite happy with his stance. He did allude to the yield move being notable and something that caught his attention. What would concern him is disorderly conditions (clearly last week’s didn’t meet that definition) or a persistent tightening in conditions that threatens the Fed’s goals. Although, last night did get quite disorderly and lower equity market moves do tighten financial conditions. In terms of the tools he could use there was no mention of Yield Curve Control (YCC), Operation Twist, WAM and the Supplemental Leverage Ratio (SLR). He pushed back against tinkering with the purchasing patterns of treasury securities by saying he felt the current stance was appropriate. I think at a bare minimum maybe he could have mentioned something about the SLR exemption and I feel this would be his first port of call if he becomes uncomfortable with further market moves. I think what concerns the market is that the Fed gets too far behind the curve and has to tighten quickly, remember, it’s the changes or delta that frightens markets as opposed to levels. The Fed’s Bostic (voter) is scheduled to release remarks at 8pm GMT where traders will be attentive to any chatter about YCC, Operation Twist, WAM and SLR. Goldman have revised their US 10-year Yield forecast to 1.9%, which follows a spate of other investment banks in that region. Next week we get US inflation data, the 10-year bond auction and 30-year bond auction - which if they turn out anything like the weak 7-year auction we’re in for a helluva ride. We got a blowout number on the Non-Farm Payrolls of +379K vs +182k expectations, adding to the already mounting reflationary concerns and sending US 10-year yields through 1.6% and the dollar through 92 temporarily.
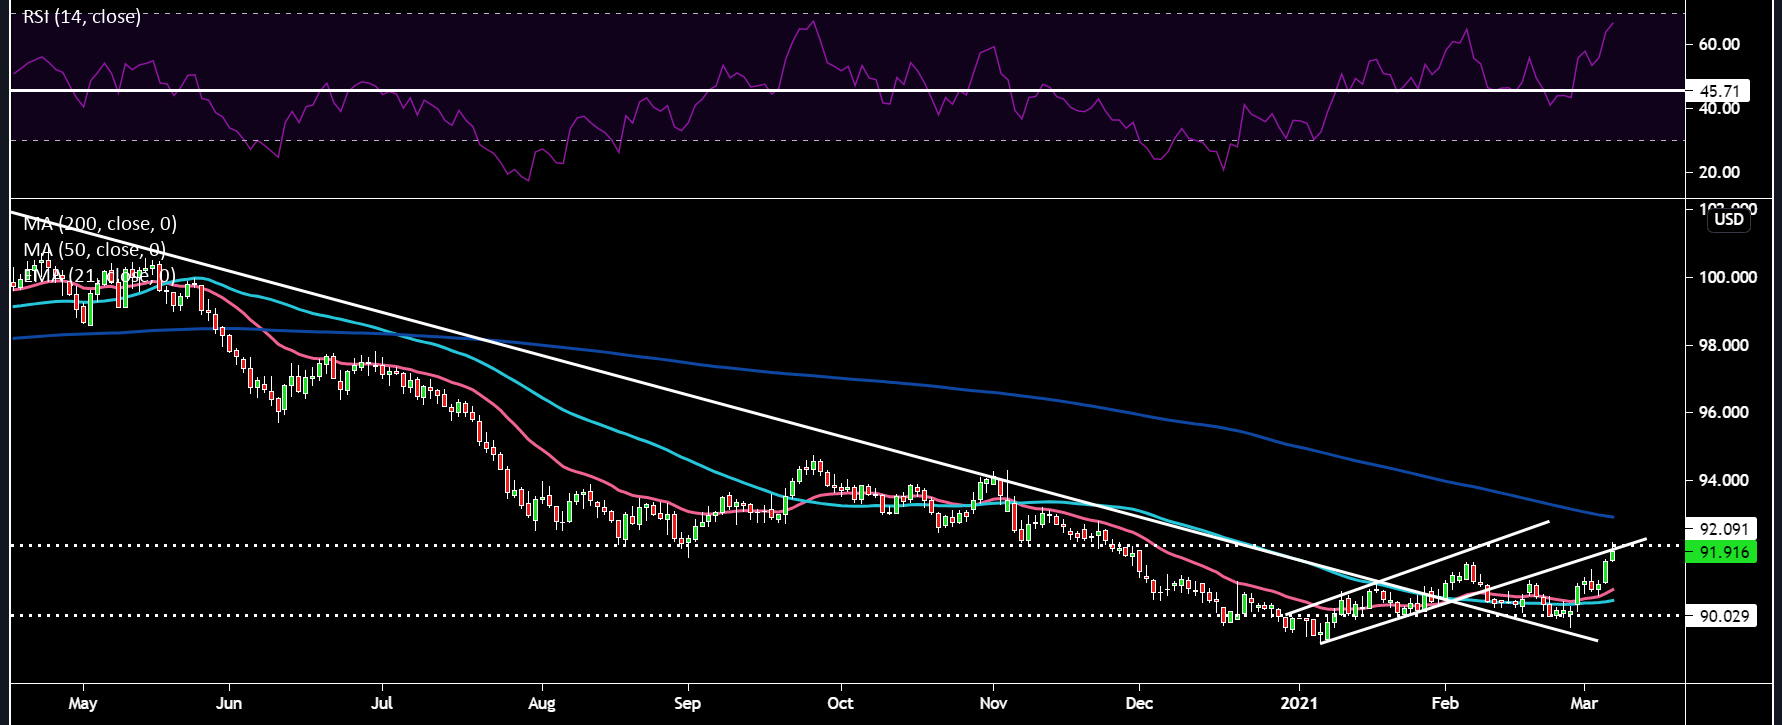
Pink line - 21-day EMA; Light Blue line - 50-day SMA; Dark Blue line - 200-day SMA (same for other charts)
The DXY did well today on the good job numbers and rallied towards the key 92 resistance level and underside of the ascending channel trend. Price is continuing to get close to the 200-day SMA around the 92.9 region. The RSI has moved up quite aggressively and is knocking on overbought territory's door. The next price target for the bulls remains 92.5, whereas on the downside 90.8-91 remains as support around the 21-day EMA.
EURUSD:
The single currency continues to be offered as EU specific news flow continues to tilt negatively. German retail sales collapsed in a heap earlier in the week, which was followed up by another big miss from EU wide retail sales data (-6.4% vs -1.2%). This on the back of Germany now set to extend its already modified COVID lockdown restrictions to March 28th from March 7th. The ECB continues to be very inconsistent with its communications as de Cos commented on avoiding a premature increase in nominal rates and the FX must be monitored even as upward pressure on the euro has eased. Straight after a report came out saying that the ECB sees no need for drastic action to curb recent developments in the bond market, citing sources familiar with discussions. We have an ECB meeting next Thursday which I’ll provide a preview for. On the geopolitical front Germany rejected the potential US sanctions on Nord Stream 2 as encroachment on European sovereignty. Biden seems to take a more hawkish outlook towards Russia so this may not ease EU-US tensions post Trump as everyone expected. I continue to remain bearish on the euro for a number of reasons: the real yield differential continues to widen between the US and EU (growth differentials too), the recovery fund still hasn’t been deployed, a much more dovish central bank than the Fed, very chunky net speculators long positioning and ultimately its categorization as funding currency to play the carry trade.
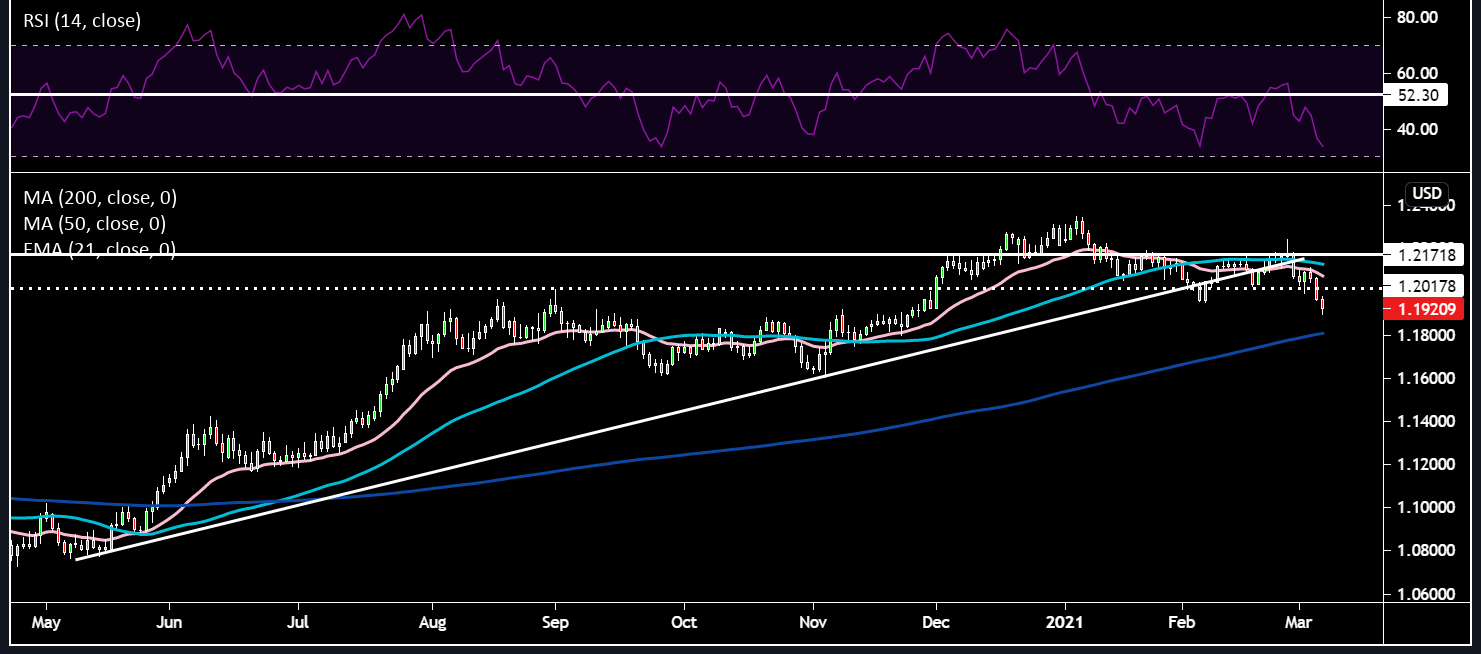
Price action has broken through the key 1.20 support to the downside, now hovering just above 1.19. Short sellers should watch the 1.185 price support and 1.18 (200-day SMA) as potential price targets. The RSI is approaching oversold territory. Both the 50-day SMA and 21-day EMA look to be rolling over.
GBPUSD:
The big event for the pound was the budget on Wednesday. I must admit I was disappointed by the corporation tax hike due to be implemented from April 2023, rising to 25% from 19% on profits above £250,000. However, the Chancellor has tried to offset this with a 2-year Super deduction, which will allow firms to deduct investment related costs from their tax liability, reducing taxable profits by 130%. Ultimately, though companies make capex investment decisions based on longer-term outlooks and this will undoubtedly dent business investment to some extent. I don’t agree with the timing to tighten fiscal policy as the UK is just coming out of a recovery. Total fiscal support over this year and next amounts to £407 bln. This will include a variety of support programmes. Furlough is to be extended until the end of September with the Government to continue paying 80% of employees' wages. Employers will be asked to contribute 10% in July and 20% in August and September respectively. No changes will be made to the headline rates of income tax, national insurance or VAT. Stamp duty holiday on house purchases in England and Northern Ireland will last till the 30 June. Lower VAT rate for hospitality firms to be maintained at 5% rate until September. Business rates holiday for firms in England to continue until June with 75% discount thereafter. Furthermore, 8 English ports have been designated to become freeports (low-tax zones) which should help “unlock billions” in investment, trade and jobs. The economy is now forecast to return to pre-Covid levels by the middle of 2022. Unemployment is expected to peak at 6.5% next year, lower than 11.9% previously predicted. I hope that these more optimistic economic forecasts will see the plan to raise corporate taxes shelved or at the very least reduced. It is right before an election year, so maybe I’m not being too hopeful. Interestingly, UK Money Markets are now pricing in a 10 bps rate hike by September 2022, whereas previously they’d seen a rate cate for January. This on the back of comments from Andy Haldane (BoE chief economist) that “there is a tangible risk inflation proves more difficult to tame, requiring monetary policymakers to act more assertively than is currently priced into financial markets.” I continue to see negative rates as a non-issue now.
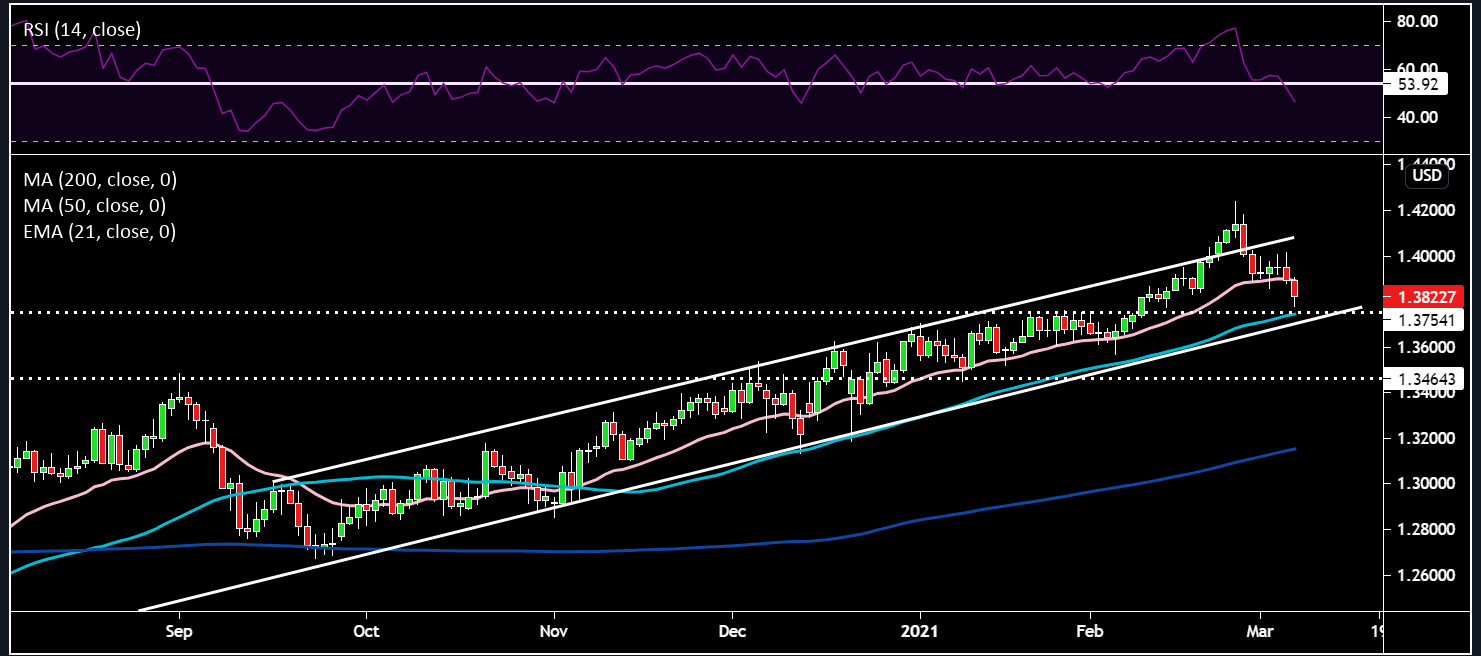
Cable has lost some its resiliency in the last few days and has tumbled down close to its 50-day SMA, white uptrend line and previous resistance now turned support at 1.375. The tail on the candle is quite positive showing buyers came in for a nibble at lower levels. The RSI has sliced through the 53 support level, however, we've seen these false breaks before. Cable can be risk sensitive so we will need to monitor the price action carefully with the yield volatility.
EURGBP:
This cross continues to move lower as the vaccine spread continues to move higher. According to Bloomberg, 30.1% of Britons have received at least one shot, compared to about 5% on average in France, Germany, Italy, and Spain. Old Brexit wounds are opening up again as the UK acted unilaterally to extend waivers on red tape requirements regarding food exports between GB and NI until October, whereby it was currently set to expire on April 1. Brussels has warned that the EU will launch legal action “very soon”. The financial services agreement is still being negotiated. This is noise for now, but does have the potential to introduce some additional volatility.
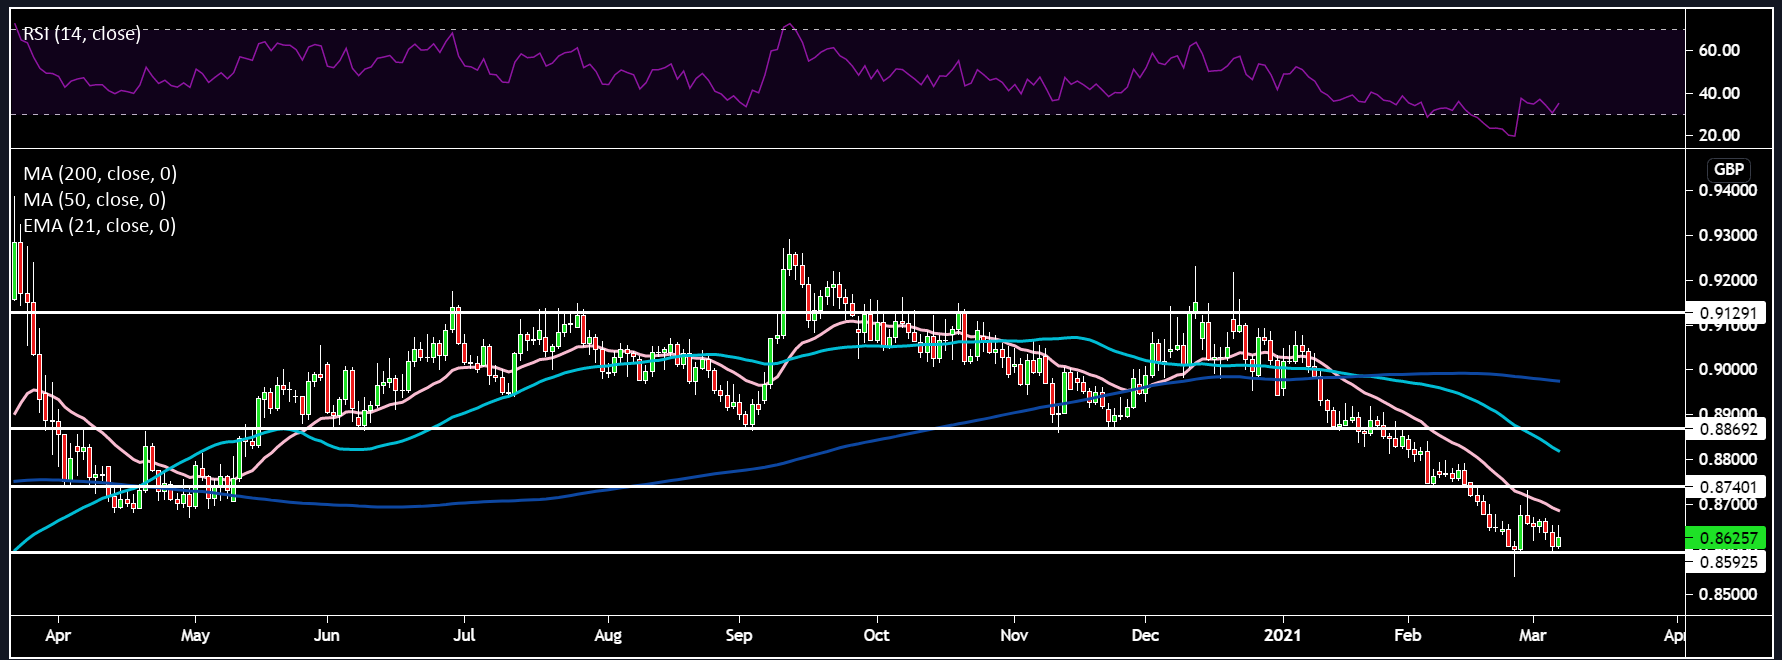
EURGBP continues to look poised to move further south as price got sold at the 21-day EMA and 0.87 resistance. Price is now knocking on the 0.86 door with a breach below that putting 0.85 in play. All the moving averages directions continue to tell us to have a short bias for this cross.
USDJPY:
The dollar yen cross continues to push higher due to its close and inverse correlation to US yields. Additionally, the Government seems keen to extend the Tokyo Virus Emergency measures by a further 2-weeks. The US continues to open up it’s economy, creating a further divergence for the pair.
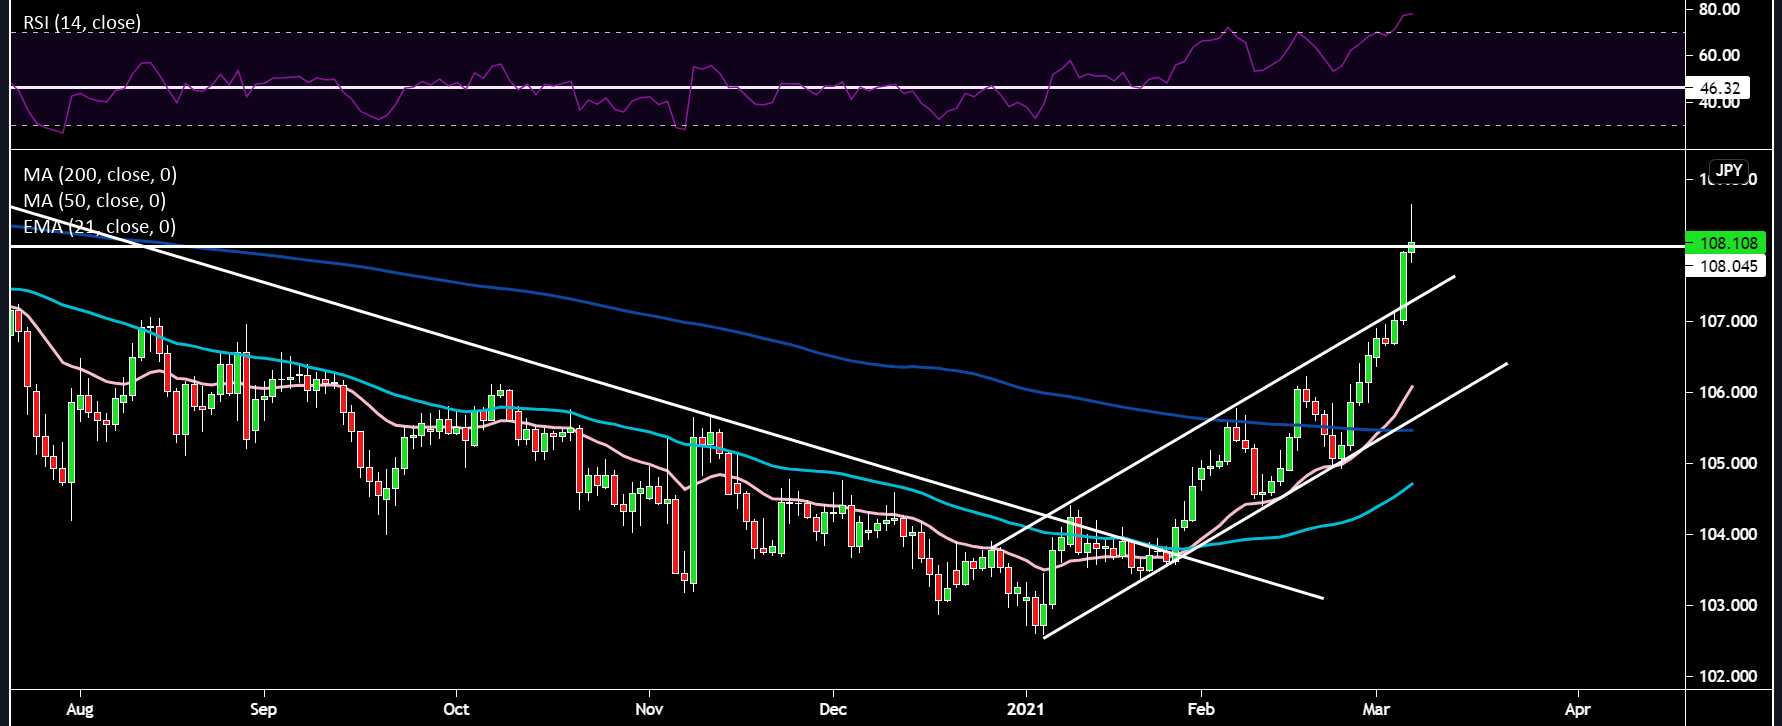
This cross continues to impress as we saw an ascending channel breakout and price is solidly above the key 108 resistance. The 21-day EMA has cross above the 200-day SMA and the 50-day SMA looks like it wants to do the same. However, price is extended and the RSI is deep in overbought territory so I'd wait for pullbacks before reloading potential long positions for those who are bullish.
OIL:
The other big story yesterday was oil, as OPEC+ surprised markets with its hawkish approach to rollover current supply cuts for all members bar Russia and Kazakhstan (130k bpd and 20k bpd respectively) during the month of April. Additionally, Saudi Arabia will withhold its 1 mln bpd production throughout April, before only gradually bringing it back online in May. The next OPEC+ meeting is on April 1st which coincides with April fools. Demand remains robust due to vaccinations, covid cases falling, mobility statistics rising and air travel ticket purchases seeing good demand. Oil markets are certainly tight as Morgan Stanley points out that the backwardation in 1 and 12 month time spreads are at their 99th percentile. The other issue this raises is, could this bring shale producers back into the mix? Their average breakeven cost is between $45-$50. However, Prince Abdulaziz does not seem concerned and believes the shale revolution has peaked. Russia on the other hand will not be too happy about giving shale producers another advantage. The big question remains - does shale begin to increase their production again and dent OPEC+’s hard work? Geopolitically, there have been a spate of attempted drone attacks this week from the Houthi rebels on an Aramco facility, this is also something to keep an eye on for the supply side of things. Most investment back forecasts sit around $75-$80.
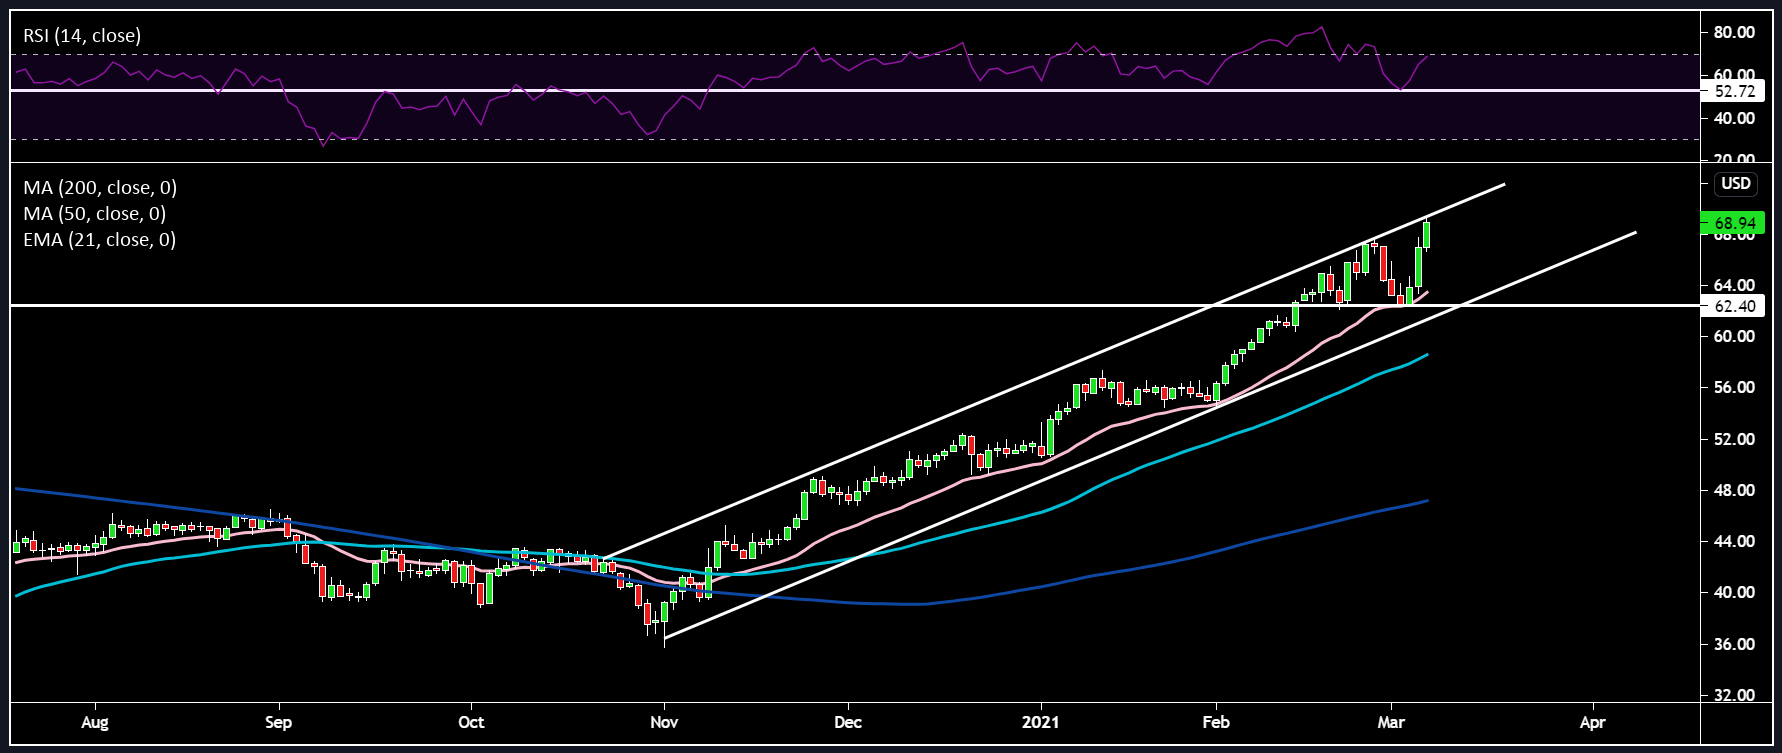
Brent crude continues to form a beautiful ascending channel. With price now scratching right at the top of that channel. OPEC+'s meeting was the catalyst for price to explode of the 21-day EMA and $62.50 support. The RSI also bounced off its 52.70 support, but is now close to overbought so longs could be deployed on pullbacks or a strong breakout of the trend channel.
Gold:
Gold continues to be one of the most out of favour assets at the moment as price has been in a negative trend channel since the blow off top last August. Gold keeps falling as real yields rise and the ETF outflows continue. The lack of inflation scares clearly isn’t helping gold’s bullish case. Unless, we see a serious capping of yields via something like YCC, then I remain bearish on gold.
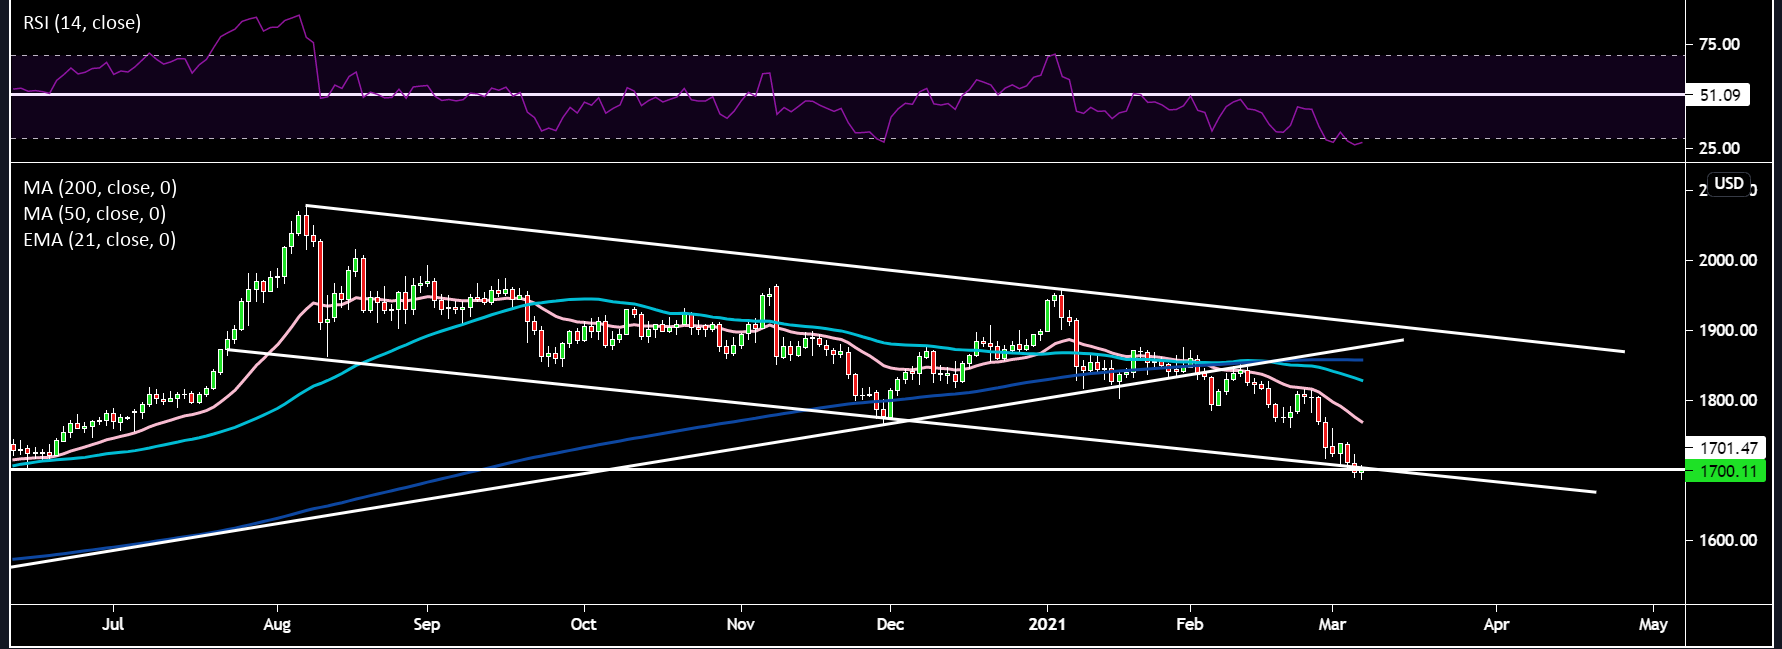
The yellow metal could be due for a short term bounce as the RSI is incredibly oversold . Gold is now firmly below its 21-day EMA, 50-day SMA and 200-day SMA. Key support of $1700 has been broken. All the moving averages have rolled over. Potentially a good trend channel trade fading the extremes., but I'd be cautious getting excited on the long side as the trend is very clearly downwards.
NASDAQ:
Given the NASDAQ’s inherent long duration/bond proxy component due to tech shares’ value resting heavily on far out future earnings, which end up being discounted more severely as yields rise – it was therefore no surprise to see them come under pressure after the Powell’s webinar didn’t keep a lid on yields. After yesterday’s selloff we are now in the red year to date. Additionally, it seems like Cathie Wood who operates ARK is liquidating some large cap liquid names to buy up smaller companies. There is also a lot of short gamma present, which means selling begets more selling as dealers have to chase price to delta hedge their book.
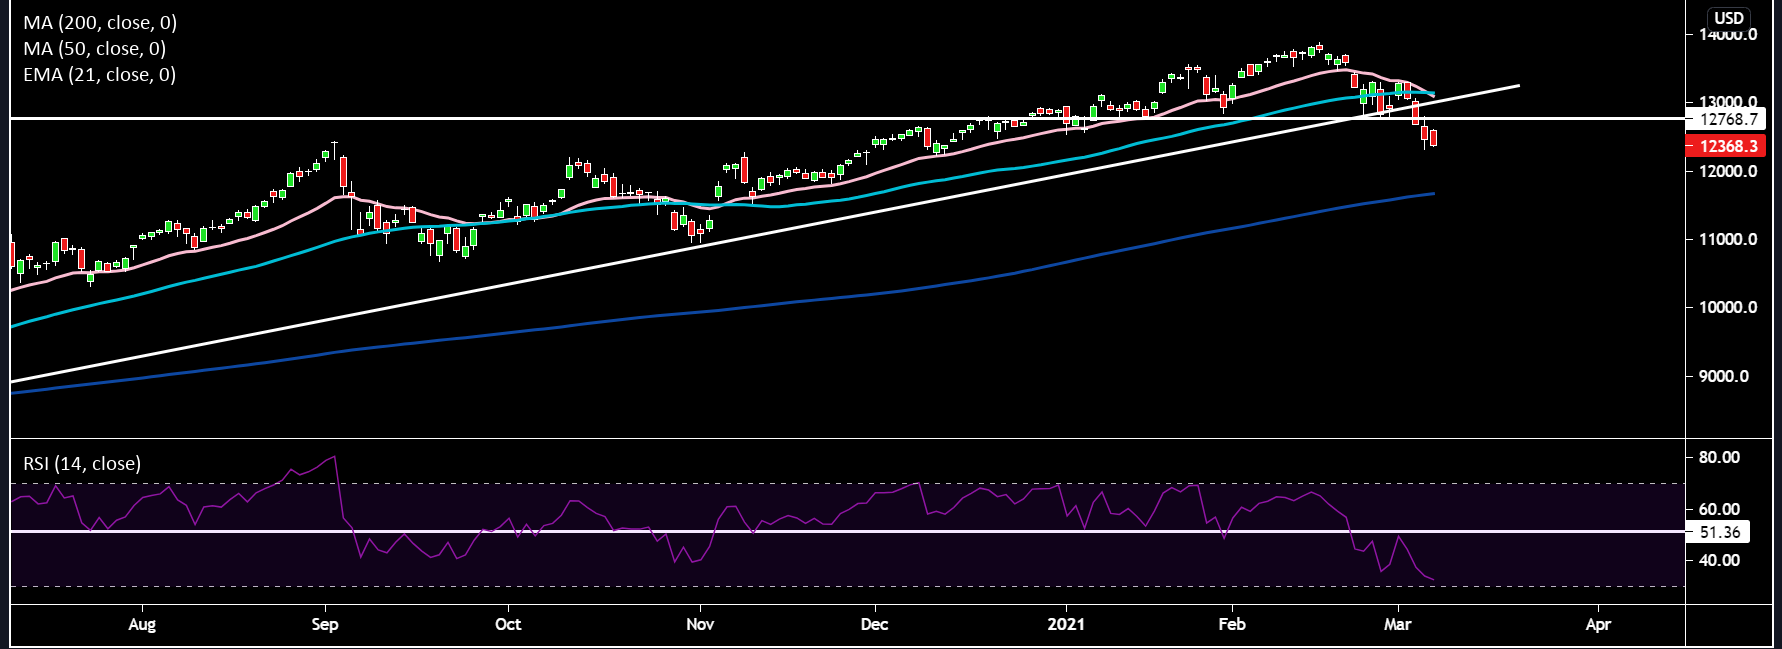
Price seems to have found some temporary support around the 12300 area. Price breached its uptrend line and the 12750 support. The 21-day EMA has moved below the 50-day SMA. For those that like to buy the dip the the 12750 would be the 1st price target above and then the 13000 level which coincides with the 21-day and 50-day SMA. On the downside the target would be 12000.
Related articles

Ready to trade?
It's quick and easy to get started. Apply in minutes with our simple application process.
The material provided here has not been prepared in accordance with legal requirements designed to promote the independence of investment research and as such is considered to be a marketing communication. Whilst it is not subject to any prohibition on dealing ahead of the dissemination of investment research we will not seek to take any advantage before providing it to our clients.
Pepperstone doesn’t represent that the material provided here is accurate, current or complete, and therefore shouldn’t be relied upon as such. The information, whether from a third party or not, isn’t to be considered as a recommendation; or an offer to buy or sell; or the solicitation of an offer to buy or sell any security, financial product or instrument; or to participate in any particular trading strategy. It does not take into account readers’ financial situation or investment objectives. We advise any readers of this content to seek their own advice. Without the approval of Pepperstone, reproduction or redistribution of this information isn’t permitted.