The Yellow Metal Finds Its Shine

Before digging into that latter point, it’s worth digging into the drivers of the move. Yet again, it is the classic inverse correlation with real yields that seems to be propelling the yellow metal higher, with gold’s march north of $2,100/oz coinciding with 2-year real yields slipping to their lowest level in almost a year.
_go_2024-03-04_18-11-56.jpg)
The logic here is relatively simple. Gold, naturally, is an asset with no yield – and, as an aside, no intrinsic value. Hence as yields decline, particularly at the front-end of the curve, which is typically much more sensitive to shifts in the near-term monetary policy outlook, the relative attraction of gold tends to increase, as the opportunity cost of holding a zero-yielding asset falls. In other words, when the return available elsewhere falls, holding the yellow metal becomes relatively more attractive.
In terms of real yields, the recent decline appears driven by two factors. Factors which, at face value at least, are somewhat at odds with each other.
Firstly, front-end Treasuries have rallied of late, with last week marking the biggest one-week decline in the nominal 2-year yield since early-January, as market participants continue to price the Fed beginning the eagerly-anticipated easing cycle in June, while also proving reluctant to move beyond pricing an outlook more hawkish than the 75bp of cuts in 2024 that the FOMC’s most recent dot plot implies.
Meanwhile, inflation breakevens have moved notably higher, with the 2-year breakeven trading north of 2.8%, to its highest since last March. This is a result of market participants seemingly becoming increasingly jittery over the prospects of relatively sticky inflation, in light of hotter than expected February CPI and PPI figures, along with the continued persistence of services inflation, amid the uber-tight labour market.

Momentum, in the short-term at least, appears to favour the gold bugs for now, particularly with spot having pierced the $2,100/oz mark, and with the balance of risks favouring further Treasury upside – or, at the very least, trading within a range – likely until the next US CPI print on 12th March. Some lingering haven demand sprinkled on top of the aforementioned mix will likely also help things along.
Nevertheless, the gold rally has not only been seen vs. the USD, which has remained underpinned against G10 peers by virtue of the ongoing ‘US exceptionalism’ narrative that has driven the FX market for much of the year thus far. In fact, the relatively firm nature of the greenback recently makes gold’s gains rather more impressive.
When priced in EUR, for instance, the yellow metal also trades at a fresh record.
_2024-03-04_18-14-25.jpg)
The same is true if one prices gold in AUD.
_2024-03-04_18-14-48.jpg)
And, in JPY, with the JPY continuing to struggle as the end of the BoJ’s NIRP era remains elusive.
_2024-03-04_18-15-17.jpg)
Finally, in the CNH as well, even though the currency – by extension – remains tightly managed by domestic authorities.
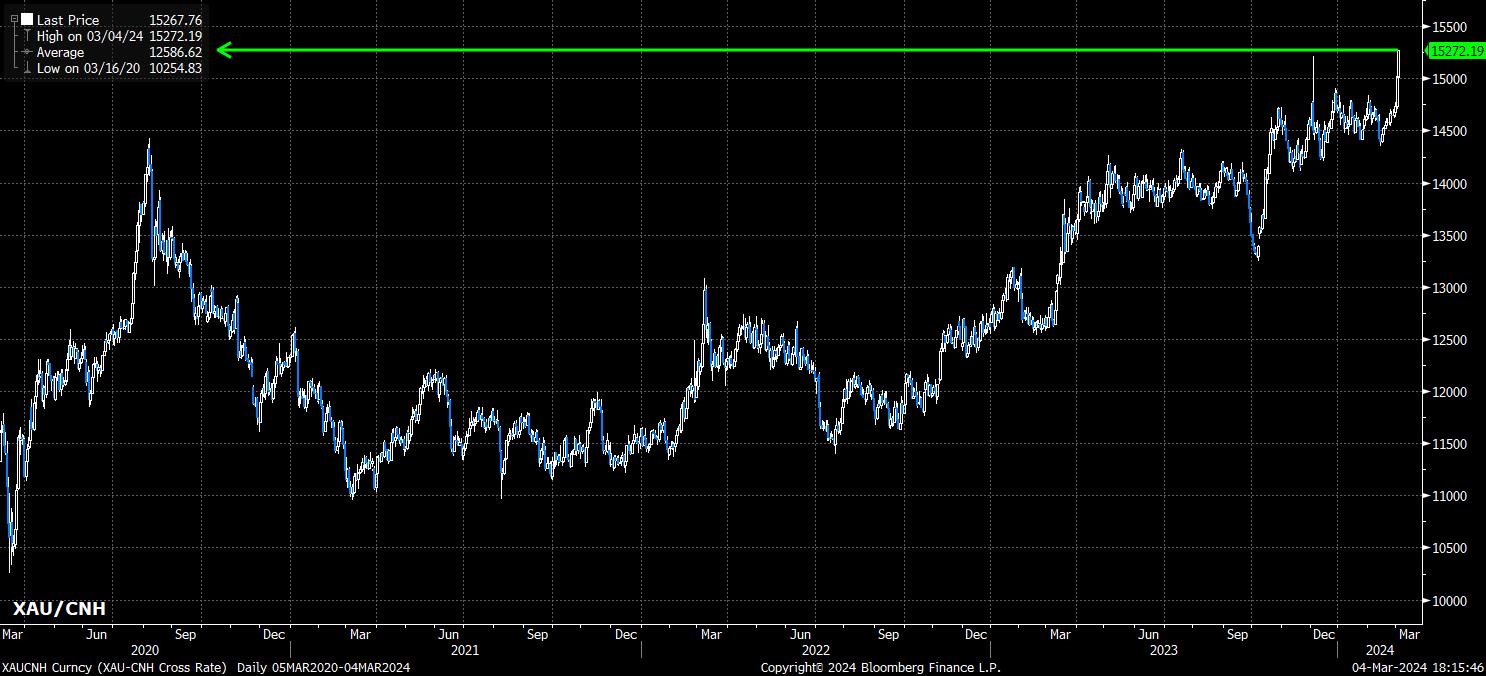
It’s clear, then, that the recent demand for the yellow metal is not simply an FX story, reinforcing the aforementioned narrative around falling real yields, and lingering haven demand, being the primary catalysts for the latest leg higher in the yellow metal. Hence, the path of least resistance likely continues to lead higher for now – with the natural risk that some longstanding bulls may take profit now the psychological $2,100/oz threshold has been breached – with the February CPI report, then March FOMC decision the two major bearish risks.
Related articles


Le matériel fourni ici n'a pas été préparé conformément aux exigences légales visant à promouvoir l'indépendance de la recherche en investissement et est donc considéré comme une communication marketing. Bien qu'il ne soit pas soumis à une interdiction de traiter avant la diffusion de la recherche en investissement, nous ne chercherons pas à tirer parti de cela avant de le fournir à nos clients. Pepperstone ne garantit pas que le matériel fourni ici est exact, actuel ou complet, et ne doit donc pas être utilisé comme tel. Les informations, qu'elles proviennent d'un tiers ou non, ne doivent pas être considérées comme une recommandation; ou une offre d'achat ou de vente; ou la sollicitation d'une offre d'achat ou de vente de toute sécurité, produit financier ou instrument; ou de participer à une stratégie de trading particulière. Cela ne tient pas compte de la situation financière des lecteurs ou de leurs objectifs d'investissement. Nous conseillons à tous les lecteurs de ce contenu de demander leur propre conseil. Sans l'approbation de Pepperstone, la reproduction ou la redistribution de ces informations n'est pas autorisée.