Gold trader – after 7 days higher is the yellow metal too hot?

We can see that the price has closed higher for 7 straight days, and subsequently, traders see a heightened probability that we will not see an 8th and that momentum has perhaps pushed the price too far, too fast.
Statistically the probability is not as skewed towards a bear case as one would think.
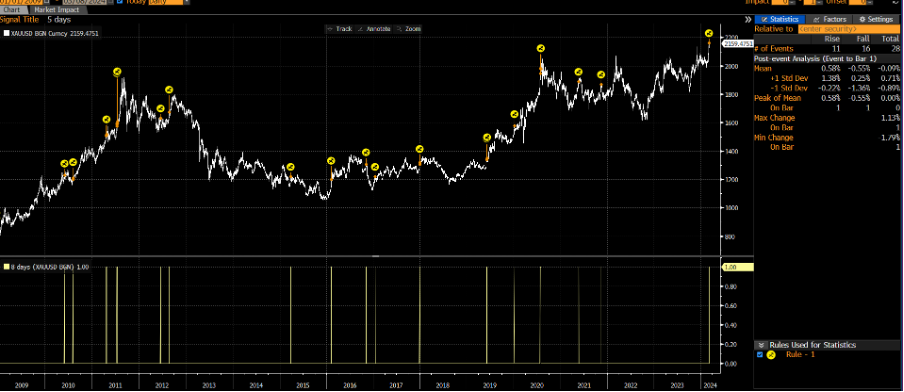
Running the numbers, I see that in the past 15 years, there have been 28 occurrences where gold has rallied for seven straight days. Interestingly, of those 28 occurrences, 57% of the time price went on to close lower the following day – so gold’s form has been balanced, and there is no statistical backing that shows form in looking for downside after such a run.
If we tighten the parameters and see how many times gold has closed higher after seven straight days higher, AND when the RSI (14) is above 70, we see there have been a reduced 19 occurrences in the past 15 years. In 70% of these occurrences, the price gained on the following day, which shows that when gold goes on a run the series of gains can hold a significant duration.
There have been 11 occurrences where price has rallied for 8 consecutive days, and just 5 occurrences (in the past 15 years) where price has closed higher for 9 days in a row.
The case for further upside potential
I would argue that despite the one-way trend in the price action that sentiment is still not at euphoric levels. It's amazing to see gold trade to all-time highs to such little fanfare – perhaps overshadowed by the moves in Bitcoin.
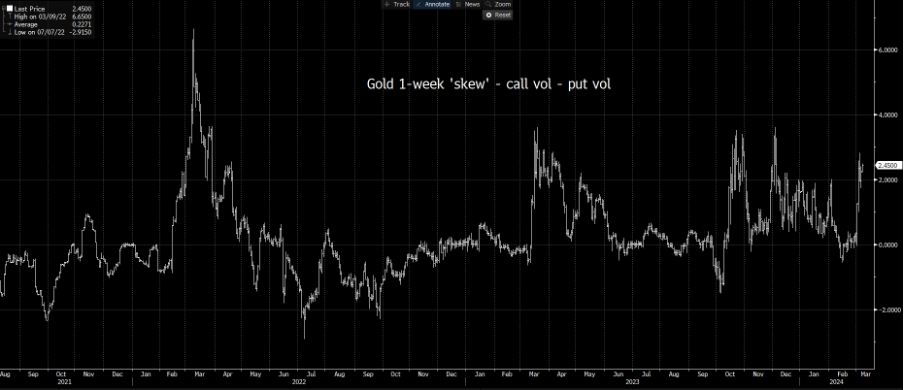
Positioning held by managed money (as seen in the CFTC weekly report) is still at subdued levels. Inflows into the GLD or GDX ETF have only started to crank up and 1-week call implied volatility trades at a 2.44 vol premium to puts – where a call premium of 3.5 vols or greater over put vol is typically where I would feel confident in saying gold market that is pricing in too much good news.
We also see tailwinds from a steady grind lower in the USD, with the DXY eyeing a move into 103.00. With the DXY index in mind, in today’s EU session the ECB meeting looms large and gold shorts will be wanting to hear something that pushes EURUSD lower. Certainly, the market is content running long EURUSD positions into the meeting.
US 2-year ‘real’ rates (US 2yr Treasury adjusted by 2yr inflation expectations) have been working their way lower progressively since October, where we’ve seen the yield falling from 3.39% to 1.87%. This has in part helped ease the USD lower, but it has offered tailwinds to the gold price. Michael Brown covered this dynamic more in his recent musing on gold.
One could argue that price has run too hard and trading rich relative to this traditional input. Perhaps it plays into the idea that gold is due to face consolidation.
We see price moving outside the upper Bollinger Band all throughout March, which just shows how powerful this rally has been.
Data points that could impact near-term
- We watch today’s ECB meeting for any impact on the EUR and EU bond markets.
- On Friday we get the US nonfarm payrolls report, where the median estimate is for 200k jobs created, with the U/E rate eyed unchanged at 3.7% and average earnings of 4.3%. Gold should find further upside on a higher U/E rate.
- The big risk event though is the US CPI print which comes out on Tuesday – here, the consensus is for headline CPI to come in unchanged at 0.4% mom / 3.1% yoy and core CPI at 0.3% mom / 3.7% (from 3.9%). I’d be looking at the core CPI print (month-on-month) most intently and using this to define a playbook. Here a read above 0.35% would likely negatively impact gold, just as we saw in the January data series. Gold longs would want to see a reading below 0.25% which would surprise and push bond yields and the USD lower.
There is no denying the momentum in the move – however with price trading rich to real rates and some big event risk ahead of us, we could see a far rockier ride. We shall see but shorting just because of the run of consecutive closes higher statistically offers little edge.
Related articles


Pepperstone no representa que el material proporcionado aquí sea exacto, actual o completo y por lo tanto no debe ser considerado como tal. La información aquí proporcionada, ya sea por un tercero o no, no debe interpretarse como una recomendación, una oferta de compra o venta, la solicitud de una oferta de compra o venta de cualquier valor, producto o instrumento financiero o la recomendación de participar en una estrategia de trading en particular. Recomendamos que todos los lectores de este contenido se informen de forma independiente. La reproducción o redistribución de esta información no está permitida sin la aprobación de Pepperstone.