- Español
- English
- Italiano
- Français
This is a macro-prudential tool the bank used quite effectively in the past to curb both appreciation and depreciation of the yuan and clearly Chinese authorities have become concerned about the one-way appreciation of the currency. We should see USDCNH and USDCNY move higher through Asia today.
The CNY fixing at 12:15 AEDT will be an important statement on the banks commitment to promote two-way pricing – needless to say and weakness in the yuan will resonate in selling in the China proxies, such as AUD and NZD. So, if you see AUDUSD lower you know why. Here’s the original story, but Reuters and Bloomberg have covered it.
On another note there's been quite a bit of talk about the US yield curve and the message it's saying. I think there's a powerfully strong argument for the USD in here which is worth exploring.
One area of the market that has really garnered central focus is the 30-year US treasury and the message we’re hearing from this part of the yield curve. Specifically, because what moves in the US Treasury curve suggest for the USD.
In a politically charged market that has rightly or wrongly, gone some way to pricing in a ‘Blue wave’. The theory here is that with the DEMs controlling Congress and having a fairly straight-forward passage to pass fiscal stimulus, that we may see a package akin to the original HEROES Act implemented. That’s potentially $3.5t of deficit financed capital (c.17% of GDP) making its way into the US economy, being partly financed by a staggered corporate tax increases towards 28%.
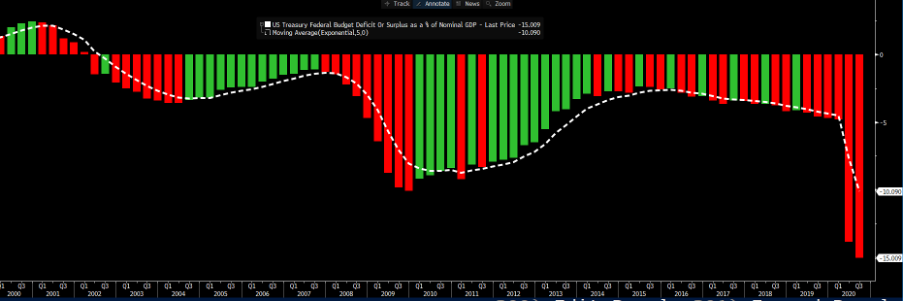
Granted, this will go some way to finance green energy and healthcare, but when the budget deficit is already 15% and falling rapidly it would be an important development for the USD – I know other governments are also increasing deficit spending, but this is next level. I can go back to 1975, but there has generally been a solid correlation between changes in the US deficit and USDX, and this is especially true now that US domestic savings are not sufficient to fund these deficits and require foreign savings and capital. In recent times the Chinese were big buyers of USTs, but that dynamic has changed and US primary dealers will become ever more important.
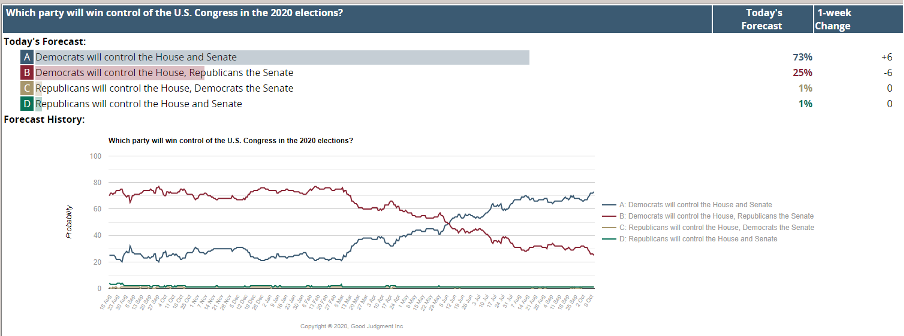
The prospect of the REPs getting the House seems very low, but Trump could win the White House and the Senate (a split Congress). This is still possible, albeit less likely, accordingly to the models but the 538 simulation model still offers 14% of scenarios where he wins. In a Trump WH, and split Congress, and provided we don’t see a deal prior to 3 November that passes the Senate, then we still get a stimulus in 2021. However, it will be far smaller and dependent on the economy and COVID-19 situation at the time. In a status quo setting it presumably means tech continues to work and the top five S&P 500 stocks outperform the other 495.
We probably get a rally in risk simply if it's not contested and we get certainty.
The issue with $3.5t in deficit spending (under a Blue wave) is it ramps up the prospect of inflation being an issue. This will cause a solid sell-off in the bond market and tighten financial conditions, which would initially be positive for ‘real’ rates and also the USD and we would see value outperform growth in equity. This then brings the Fed into the frame, who if you recall in their September FOMC statement said they “help foster accommodative financial conditions” – so they cap yields in the 5-year part of the curve (just like the RBA are doing in 3’s) and increase their weighted duration of QE (currently around 8 years). This would result in the Treasury curve sufficiently flattening out to 10-years.
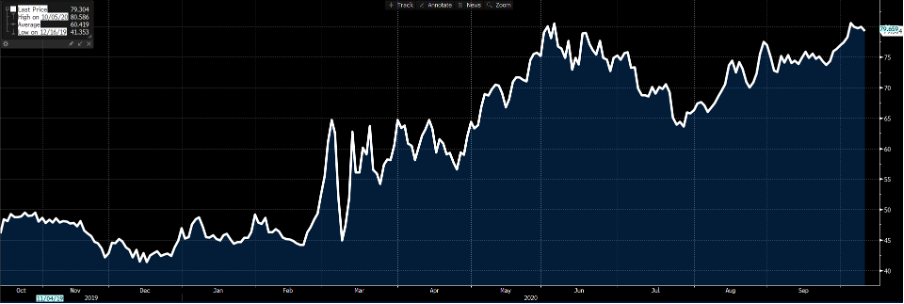
As we see in the spread between 30- and 10-year Treasuries, the yield differential has widened to 79bp, with the ultra-long-term Treasury bond underperforming, meaning yields are moving higher on a relative basis as sellers kick-in (price lower). This is where the Blue wave reflation trade could be worth watching and why being short US30-year Treasuries is a consensus trade. Granted, we’re seeing a double top (in the spread), but you can see how things are playing out.
In this scenario where we hear of massive deficit spending and yields moving higher, the Fed will have far less control over the 30-year and hence if they are buying 10s, which will suppress yields, you’ll see the 10 v 30 year spread really blow out – traders are front running this.
It also means that if the Fed start to buy 10-year Treasuries and inflation expectations are going up that ‘real’ rates will head deeper into negative territory and target 2% over time. Apart from creating an even larger balance sheet at the Fed, a fall in real rates (i.e. bonds adjusted for inflation expectations) would be another USD negative and see the USDX go on to test the September lows and through 90.0 over time.
This is the basic crux of my USD thesis on a Blue wave. I can argue that a split congress will have mixed messages for the USD, while a contested election that heads to the Supreme Court, which to many is assured, will cause a spike in the USD and risk-off tone in equities – even if traders are hedged through optionality.
But should we get a Blue wave, a fate Goldman Sachs ascribe a greater than 60% probability too, then not only is the US budget deficit going lower, the Fed will step in to contain nominal yields and ‘real’ rates go lower. Not only will the reflation trade be on, but a weaker USD will be driving it.
Traders do consider positioning and say USD shorts are already huge. well, we can certainly see that this is true on the weekly CFTC data. However, shorts positions are concentrated against EUR and JPY, and specifically held by asset managers, as opposed to leveraged funds. Clearly scope to add.
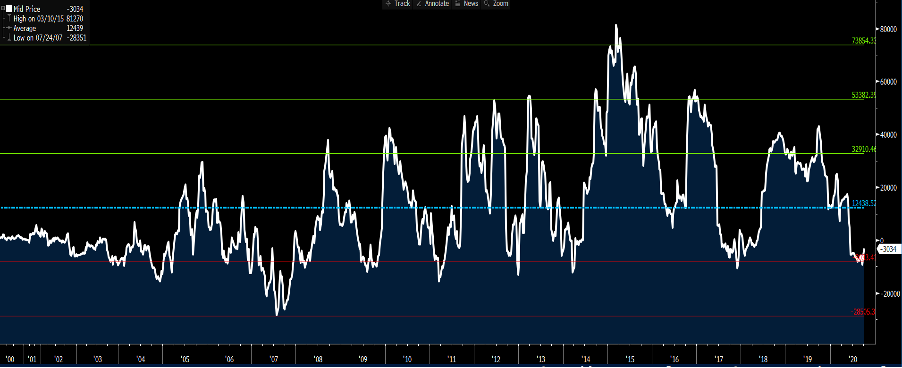
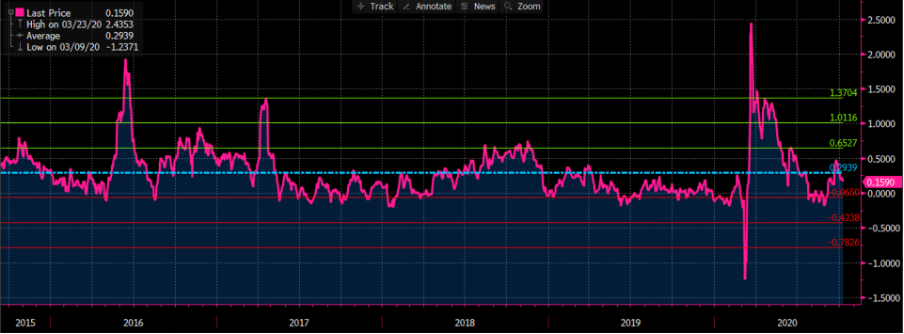
Looking at options sentiment towards the USD and 1-month risk reversals, we see that call volatility trades at a slight premium to puts, but it's right on the long-term average. It doesn’t feel like the market has a huge disdain for the USD, although this might be the fact that FX volatility is super low.
¿Listo para operar?
Empezar es fácil y rápido. Nuestro sencillo proceso de solicitud solo le llevará unos minutos.
Pepperstone no representa que el material proporcionado aquí sea exacto, actual o completo y por lo tanto no debe ser considerado como tal. La información aquí proporcionada, ya sea por un tercero o no, no debe interpretarse como una recomendación, una oferta de compra o venta, la solicitud de una oferta de compra o venta de cualquier valor, producto o instrumento financiero o la recomendación de participar en una estrategia de trading en particular. Recomendamos que todos los lectores de este contenido se informen de forma independiente. La reproducción o redistribución de esta información no está permitida sin la aprobación de Pepperstone.
