- English
- Italiano
- Español
- Français
- English
- Italiano
- Español
- Français

The fact that global central banks have had to engineer such incredible ways to make sure financial markets are not the problem is ironic in itself, given the Fed, and to a lesser extent the ECB, BoJ and PBoC created much of the problem in the first place.
When markets crashed in late February and funds knew this was not something that could be readily fixed by monetary policy, volatility lit up and years of yield enhancement strategies came unwound incredible sharply. The trade literally became sell everything but buy USDs, and the period leading into 19 March will be one that FX traders and traders of all asset classes will not forget.
The unforeseen consequences of the global monetary policy experiment
The concern is when that central banks go this hard, this quickly, making policy up seemingly on the fly you wonder what the unintended consequences will be at some in the future. We know the Fed have a legion of PhDs who live for modelling and would run an incredible amount of scenario simulations, but certain things in life, such as behaviours patterns, can be difficult to model.
That is an issue for the future though, and while we can try to consider the trades that will do well should policy go bad, timing a thematic idea is always the hardest point. Gold is perhaps one of the clearest hedges against the central bank policy experiment and the currency debasement that is taking place.
Where to for the greenback?
For a central bank with their own currency, right now they are printing it, and in some cases financing its government. With the Fed being the dominant actor here, some have questioned why the USD is not far lower than where it is. The notion being that if you get your USD call right it will not only make you a star FX trader but will also go some way to offering far clearer insights towards broad asset allocation.
Obviously, this debate can be broken down depending on the timeframe, where we assess both the long-term and short-term prospects based on a set of variables. My focus falls on what the world thinks the USD should be sensitive too right now, and how changes to these inputs actually impact price
Positioning and sentiment
If we assess the weekly CFTC Commitment of Traders report, we see non-commercial players modestly long USDs, but it is hardly stretched at 15,616 futures contracts. This is less than one standard deviation of the 5-year range. By way of sentiment, we see 1-month call option volatility trading at a 1.12 vol premium to puts, which is the 64th percentile. Again, the market is modestly bullish USDs, but in no way extreme. The DSI (Daily Sentiment Index) sits at 63%, which is the highest in G10 FX, but not at levels I would suggest contrarian trades
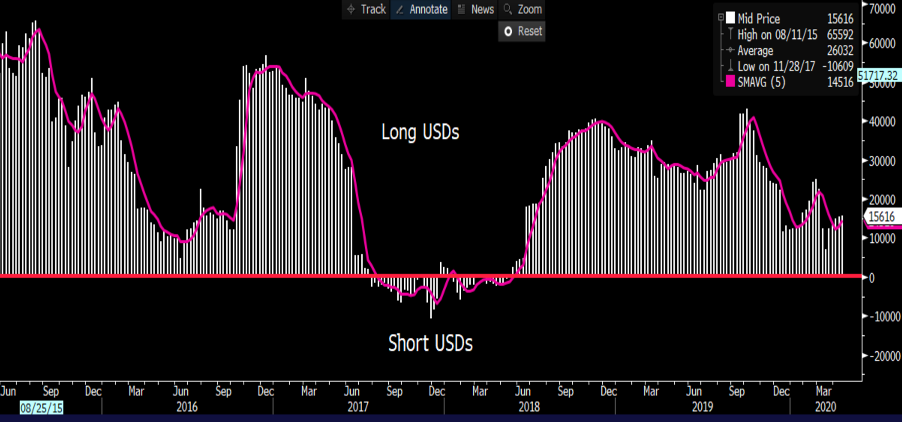
"(Source: Bloomberg)"
Trading the USD
Firstly, many have used the trade-weighted USD, or the Fed’s own version of this, to focus on. That makes sense as it affects the US and global economics most intently, and as we know the USD is the global reserve currency. But trading the USD on a trade-weighted (TW) basis is impossible, so we look at vehicles that have a meaningful correlation to the TW-USD. Doing a basic regression on the USD index (DXY) vs the Fed’s trade-weighted USD (independent variable), we see the R^2 at 0.95.
This means 95% of the variability in the DXY (over the past 12 months) can be explained by the trade-weighted USD - it is significant. Therefore, when economists are talking about the trade-weighted USD, we know we can actively trade the DXY and believe it is similar in movement.
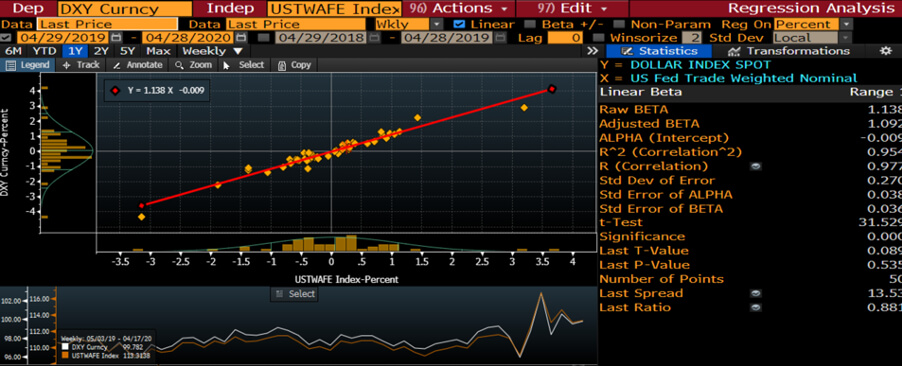
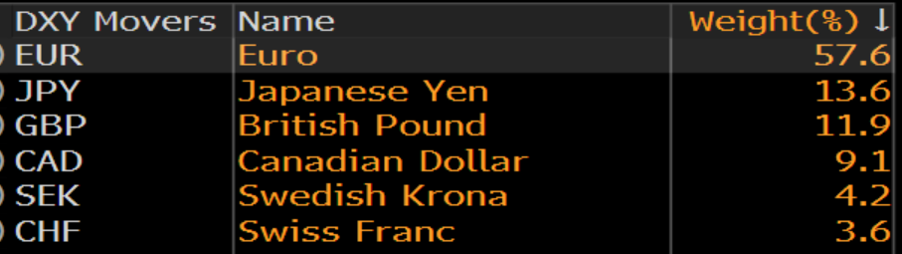
We know the inputs into the DXY are somewhat concentrated and it certainly is not a brilliant representation of the US’s trade relations, but, given the strong correlation to the TW USD, it’s as good as we get. As we see it is heavily weighted towards the EUR, so that needs to be considered.
Weightings on the DXY
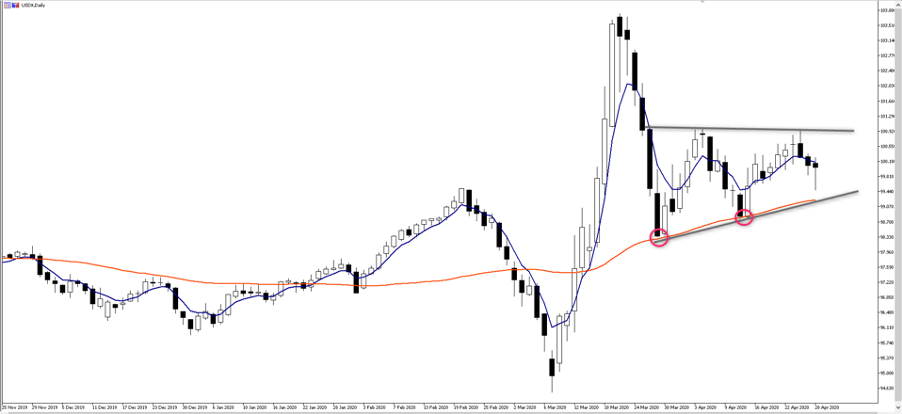
Pepperstone offer clients the USDX, which is essentially the DXY futures price, with the same weights as the DXY (cash). As we can see, price is trending sideways, with the bulls eyeing a break of horizontal resistance through 101, while the USD bears see support at the rising trend and 55-day MA. A breakthrough either side should be respected and will guide my short-term trading bias – so until I see a change in structure I hold a neutral bias.
That said, considering all the reasons we are told to be bearish on the USD, I would say the fact it is holding up so well is a net positive.
DXY overview
If we take the timeframe out though, we see the USD grinding higher and working nicely in a regression channel.
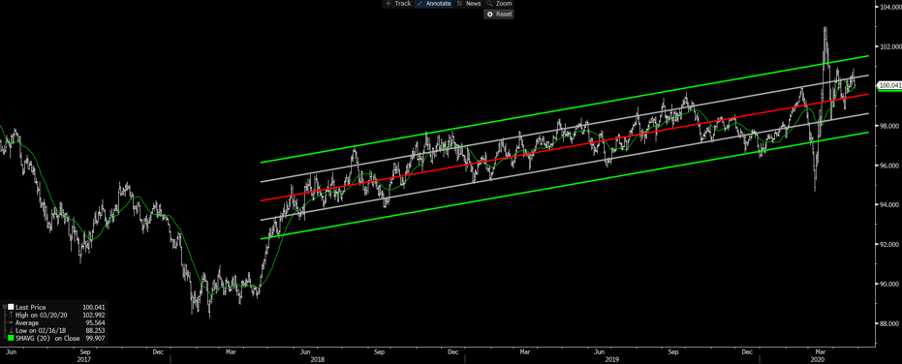
That has a lot to do with the lack of interest to buy EUR’s, but this set-up is not dissimilar to the Fed’s own trade-weighted USD index model.
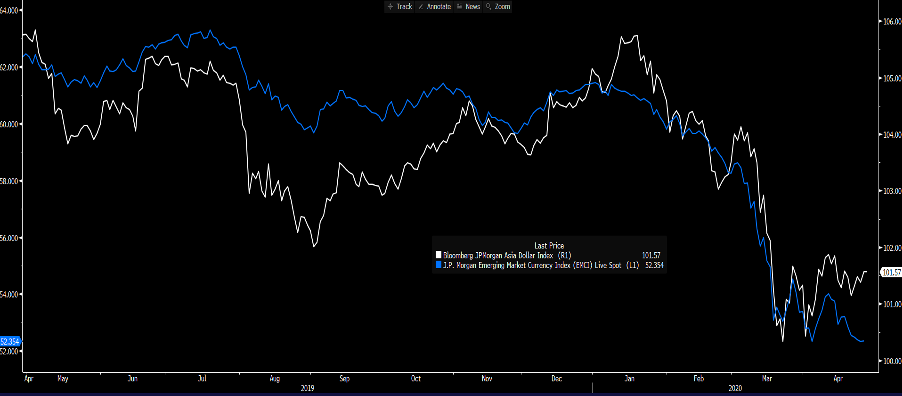
The interesting and clearly worrying aspect here is we are seeing the USD strength really manifest in emerging markets (EM) weakness. Here we see the JP Morgan EM index (blue) and the Asia USD index (ADXY). The ADXY works different for the DXY, in that it moves lower when the USD is strengthening against EM currencies. Either way, the JPM EM index is breaking down hard, despite Fed liquidity and strong moves in risk currencies like the AUD.
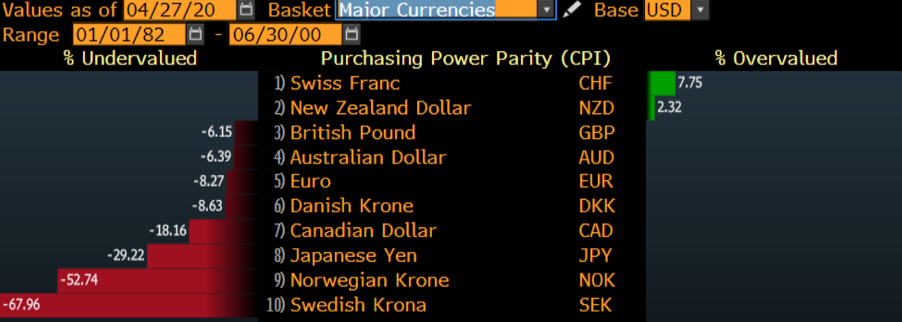
Valuation – Not something short-term traders look at closely, but the USD is expensive. FX valuations are always open to interpretation, but using a basic Purchasing Power Parity model (PPP) we see the USD overvalued against the bulk of major currencies. Economists would believe that over a longer-term period, currencies do mean revert. However, that time does not seem to be upon us, or perhaps we have not got to the point where the overvaluation has become too significant.
Relative growth dynamics
This chart paints a clear picture and seems key. Until we see Europe, Japan and other parts of Asia (notably with high savings rate) looking like they are on the mend, and performing well on a relative basis to the US, investors want US assets and are prepared to buy these assets (such as US Treasuries) with fairly low hedging ratios. Relative growth dynamics drive portfolio flows and the attractiveness of the investment destination – until market participants see the world healing, the USD will be supported.
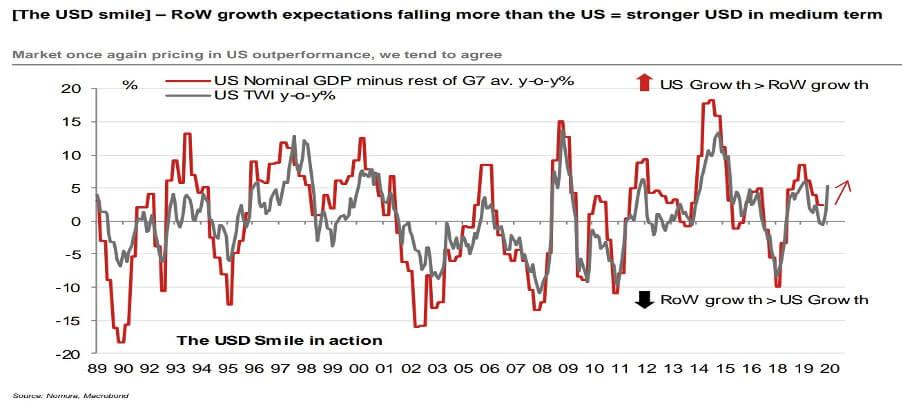
"(Source: Nomura)"
Balance sheet considerations
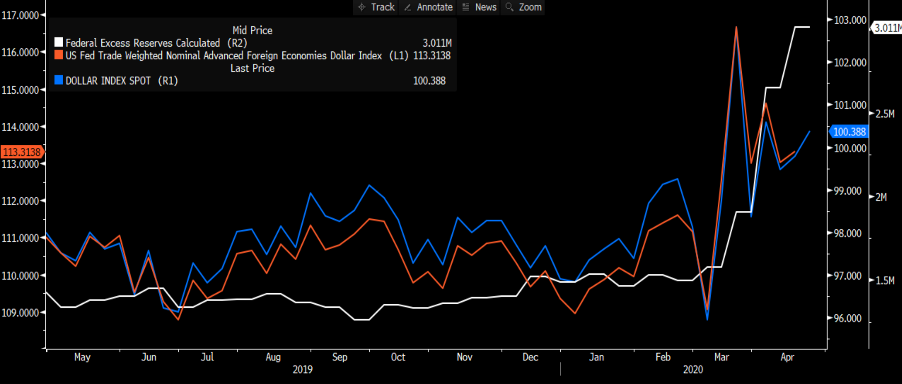
The market has seen an incredibly pragmatic Fed, who has taken the role as the dominant actor through March and April. Granted, all central banks have been unveiling unconventional monetary policy initiatives, but aside from the RBNZ, the Fed has taken it to another level. In terms of scale, the Fed’s balance sheet has increased a massive 58% in 2020 to $6.57t, which at 10% of GDP is a bigger percentage increase than any other G10 central bank.
Historically an increase in excess reserves, essentially the value of commercial banks capital reserves held with the Fed in excess of their regulatory requirements, were considered USD negative.
However, despite the Fed’s excess reserves more than doubling to $3.01t, we have seen the USD fail to materially weaken - in fact, we have actually seen the USD bid. One then must consider the backdrop by which the excess reserves are created – in this case, higher excess reserves are seemingly considered a positive, as it could make the system more stable. That dynamic would change if the Fed could actually create inflation and real yields fell as a result.
- White – Fed’s excess reserves
- Orange – Fed’s trade-weighted USD
- Blue – DXY
Universal policy easing – We should consider that unlike prior bouts of policy easing through asset purchases, where it was solely the Fed, the BoJ and the ECB – this time around everybody is in on the act. However, when we consider the combination of increasing central banks’ balance sheets and the change in the budget deficit (as a percentage of GDP) - the US, along with Canada, are the most aggressive. However, many argue the USD should be reacting far more negatively.
Funding costs matter in FX
One aspect that all FX strategists were watching on 13 March were the USD funding channels, with a multi-year premium to borrow USDs, with various measures showing a massive scarcity of USD liquidity. We can look at cross-currency basis swaps, but I like to look at 3-month FRA-OIS.
- White – 3M FRA-OIS
- Blue - DXY
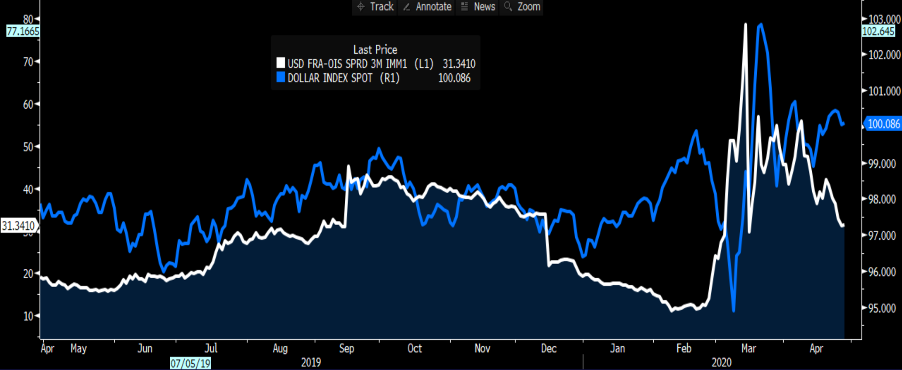
As we can see above, 3-Month FRA widened sharply against OIS (overnight index swaps) through February and into March. This pushed out 3M cross-currency basis swaps and portrayed a massive premium to borrow USD's. There was a hunt for USDs and US Treasuries, and this just pushed up the USD even more aggressively.
The Fed quickly acted to curb this, enacting USD swap lines with a number of other central banks with the idea to bring down funding costs. They also offered other banks, who were not part of swaps channels the ability to use their US Treasury holdings as collateral for USDs – a ‘repo’ facility. This meant overseas banks could get access to USDs but maintain and even buy US assets – the purpose being it erased fears of the USD losing its reserve status.
Either way, we are seeing a collapse in USD funding channels, but the USD is not following as many would expect – although, perhaps it will (watch USDJPY) if USD funding continues in this trajectory.
Another consideration is that despite the Fed’s programs, we’re not seeing inflation expectations pick up markedly. Many would argue that if they were then it should be a USD negative but if inflation expectations are headed lower, then real yield is increasing, and as we see in the chart below the USD is finding a relationship with US real yields. If Fed can engineer a belief that inflation is on the rise then risk currencies like the AUD and EM could really start to exert long-term trends. However, if real yield heads higher due to falling inflation expectations then the USD will stay firm.
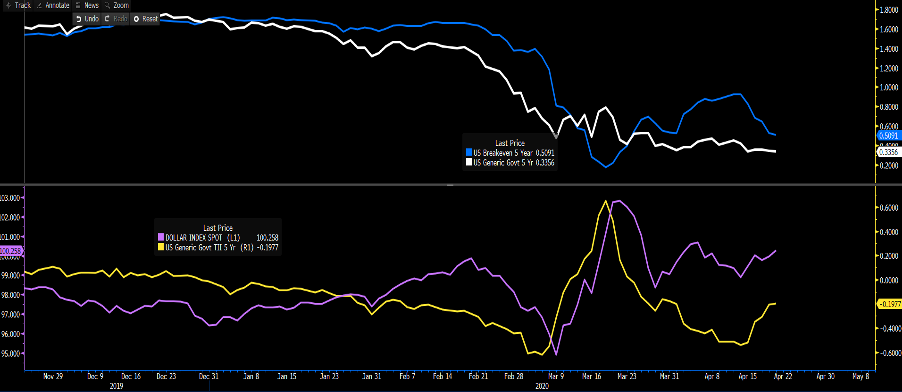
Again, it leads us to the belief that while the US is still the prime investment location for global capital, that the USD is unlikely to materially weaken. Granted, we may some idiosyncratic moves vs the AUD and JPY (etc), but on a trade-weighted basis a push higher may cause renewed concerns on global growth. The fact the Fed is so aggressive is actually incentivising capital here.
Ready to trade?
It's quick and easy to get started. Apply in minutes with our simple application process.
The material provided here has not been prepared in accordance with legal requirements designed to promote the independence of investment research and as such is considered to be a marketing communication. Whilst it is not subject to any prohibition on dealing ahead of the dissemination of investment research we will not seek to take any advantage before providing it to our clients.
Pepperstone doesn’t represent that the material provided here is accurate, current or complete, and therefore shouldn’t be relied upon as such. The information, whether from a third party or not, isn’t to be considered as a recommendation; or an offer to buy or sell; or the solicitation of an offer to buy or sell any security, financial product or instrument; or to participate in any particular trading strategy. It does not take into account readers’ financial situation or investment objectives. We advise any readers of this content to seek their own advice. Without the approval of Pepperstone, reproduction or redistribution of this information isn’t permitted.