- English
- Italiano
- Español
- Français
There's been small selling in US fixed income, with 10yr Treasuries +2bp and generally implied volatility has risen modestly, in line with the small drawdown in equities.
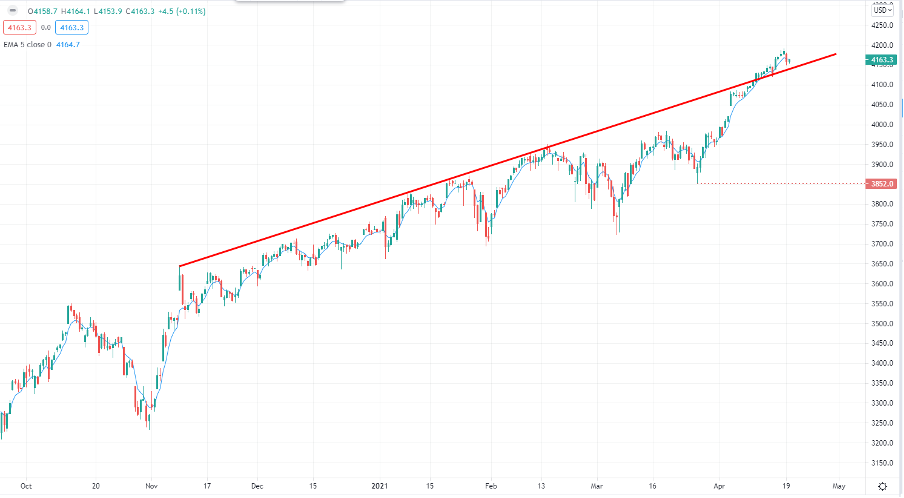
US500 4-hour

(Source: Tradingview)
It does concern that small caps cant find a friend at present with the Russell tracking a tight range – a break of 2217 would be a trading signal to increase bearish exposures to this index. In the large-cap space, I would like a test of the former trend resistance (now potentially support – see chart above) in the S&P 500 at 4140 - should the buyers support that would be a validation that the market is ready to trade higher again. Discretionary and tech have lost ground, and names like Microsoft and Home Depot, stocks which have shown incredible momentum are looking tired here. So, if the leaders give up then we may see a buyers strike emerge and the index may just fall under its own weight. It's hard to see these names pull back too hard in this environment.
For the single-stock traders, keep an eye on Netflix who report after the close of the upcoming US cash session. The implied move (derived from options pricing) is 6.5% on the day, so for those who like movement, which is most CFD traders, then this is a name to watch – a break above $554 would be a clear positive and likely a function on the reaction to net subscriber numbers, where management have pre-guided to 6m adds. The market is eyeing EPS at $3.18, on sales of $7.13b.
The lift in real US Treasury yields (10s are +4bp to -75bp) has failed to ignite a bid in the USD, as has the fall in US stocks. I guess we need to understand why the equity market is under pressure and for me it's likely funds de-grossing and taking a bit off the top, rather than a growth scare which is clearly not the case. The rise in real Treasury yields is weighing on gold, with trader selling into 1790 and it seems even though the technical target sits up at 1840 and the USD is weaker yields do matter from a fundamental input.

(Source: Tradingview)
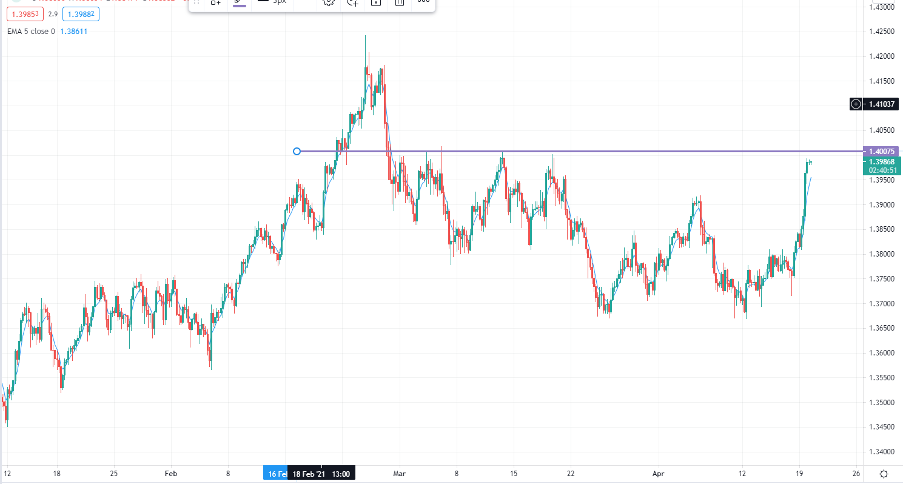
We’ve seen solid flows in EURUSD and GBPUSD, with GBP the star performer on the session. There doesn’t seem to be one smoking gun to promote a 1% rally in cable, with the banks talking about solid demand from real money accounts – so more flow than a clear-cut driver. On the daily chart the obvious resistance levels sit into 1.4000, so we may see offers here. So a break in upcoming trade would put the 24 Feb highs of 1.4242 in our sights – we see UK employment data in early upcoming UK trade but I’m sceptical this will be a vol event.
EURUSD has pushed into 1.2048, printing a strong bullish reversal and if this can kick on in upcoming trade then 1.2100 to 1.2150 is fair game. As mentioned yesterday I feel there will be a turning point in the USD soon and will be watching for signs. A sustained reversal will require higher US Treasury yields and again I feel we are closer to a point where better sellers will emerge again in the US bond market and we’ll see higher yields and a stronger USD.
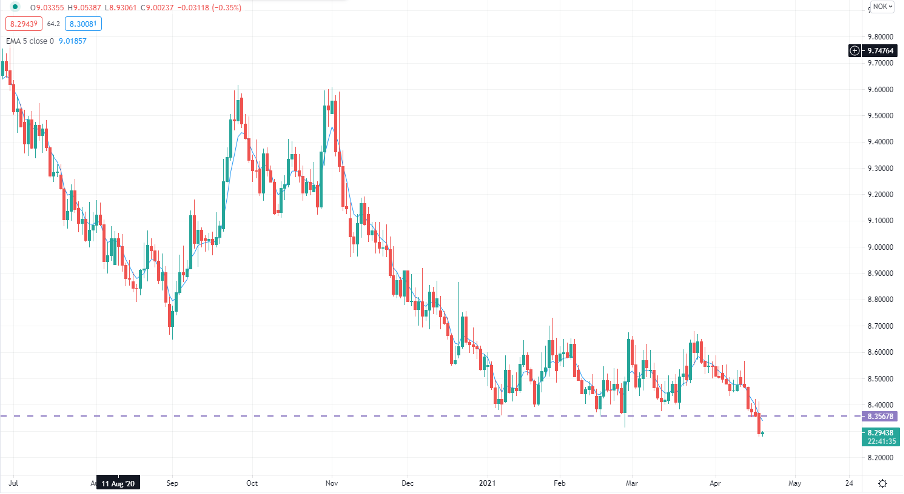
USDNOK daily

(Source: Tradingview)
Keep an eye on USDNOK too – crude is up smalls here as OPEC look to downgrade next week’s meeting to a ‘monitoring’ meeting, subsequently reducing the prospect of output increases. This has been a tailwind for a solid rise in the NOK, with USDNOK smashing through the low of the years trading range at 8.3823. This could be a significant development and rallies are likely to be sold – whether we see a series of lower highs and lows is one to question, but price is below the 5-day EMA and I would look to use strength into this average to works shorts. A daily close above the average would be a sign to cut.
Related articles
Ready to trade?
It's quick and easy to get started. Apply in minutes with our simple application process.
The material provided here has not been prepared in accordance with legal requirements designed to promote the independence of investment research and as such is considered to be a marketing communication. Whilst it is not subject to any prohibition on dealing ahead of the dissemination of investment research we will not seek to take any advantage before providing it to our clients.
Pepperstone doesn’t represent that the material provided here is accurate, current or complete, and therefore shouldn’t be relied upon as such. The information, whether from a third party or not, isn’t to be considered as a recommendation; or an offer to buy or sell; or the solicitation of an offer to buy or sell any security, financial product or instrument; or to participate in any particular trading strategy. It does not take into account readers’ financial situation or investment objectives. We advise any readers of this content to seek their own advice. Without the approval of Pepperstone, reproduction or redistribution of this information isn’t permitted.


