- English
- Italiano
- Español
- Français
- English
- Italiano
- Español
- Français
The Daily Fix: US tech on fire and leading the markets higher

I’d probably add some Microsoft, Netflix and some healthcare stocks in there too for good measure, as some of these names are in absolute beast-mode right now. If the market is telling us where leadership is to be seen in a COVID-19 world, well, these names are letting us know.
So, tech is working, as are staples and it won’t surprise to see that the NAS100 is the strongest performing US equity market, with a gain of 4.3% on the day. Although, if the aim is to buy strong, then the German DAX is on fire right now with a 5-day gain of 12.3% (13.2% in USD-terms). It continues to be hard to chase any of these equity markets and this is the new ‘most hated rally ever’. We also find the broad quality of the rally has been called into question. However, I would be a willing buyer of dips given the prevailing trend, especially with so much talk of normalisation and death rate curves flattening out.
That said, normalisation will not be a fast process and we now head into a period, not just where CEO’s will offer insight into the real economy. But where the economic data will roll in and that should test the theory that the economic deterioration is discounted, even if there are still solvency issues that need to be fully worked through. Keep an eye on March US retail sales (22:30 AEST tonight), April NY manufacturing (also 22:30 AEST) and March industrial production (23:15 AEST), with the market expecting some big declines here.
JPM down in a strong market
Indices aside, we’re certainly not seeing leadership coming from financials or energy. JP Morgan, the true definition of quality in the global financial landscape, hit the market with somewhat messy earnings and we see the stock closing -2.7%. A lot of focus has been placed on its $8.3b provision for loan losses and although this is obviously a huge number, some feel it's still lightweight and should continue to build. The question being whether the provision is installing enough confidence that its dividend is not under threat.
Energy is naturally not liking the 7.6% decline in crude and however you slice and dice the recent OPEC++ agreement, the market is speaking out that more is needed to fully balance the market. A damning assessment from the IMF, detailing that global growth will fall 3% this year is not helping the perception of demand either. Crude is a must-watch market here and a break of $19.27 (the 30 March low) would open up a move into the mid $10’s, with Brent crude looks to be headed into the March lows too.
It's surprising that we haven’t seen more of a reaction in the bond market and while US Treasuries have caught a bid, it’s hardly empathic and we see yields down a few basis points between 2’s to 10s. US 5-year breakevens (i.e. average expected inflation over the coming 5-years) are largely unchanged at 92bp and the reflation theme that pushed through market yesterday is taking somewhat of a backseat - even if we do see gold at $1726 (off session highs of $1747), copper up another 1% and the AUD maintaining its position as the top performer and at the top of the pack.
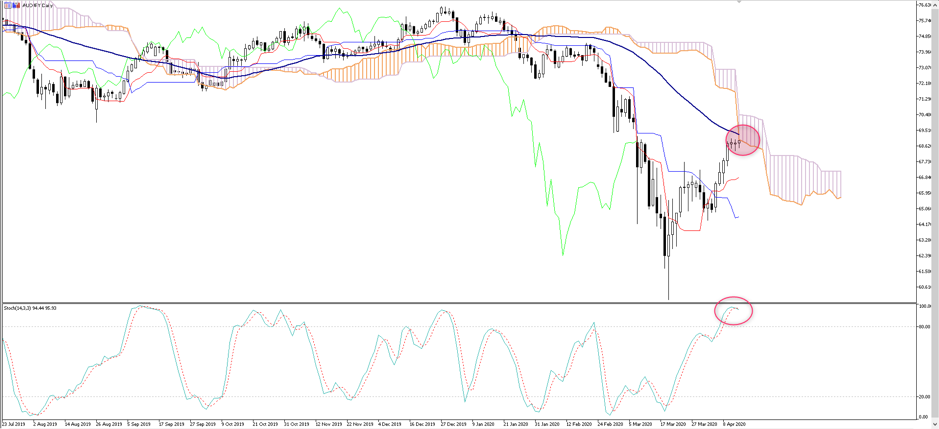
AUDJPY to roll over?
AUDJPY has been a pair on my radar and has worked nicely alongside the gains in equities. I am not quite out of the market here, but the balance of power looks to be shifting and if price rolls over, I am out. The daily chart shows we are in an area of decent resistance, with the 50-day MA and low of the I-cloud at current levels. Stochastic momentum is shifting, although needs work to offer a bearish signal.
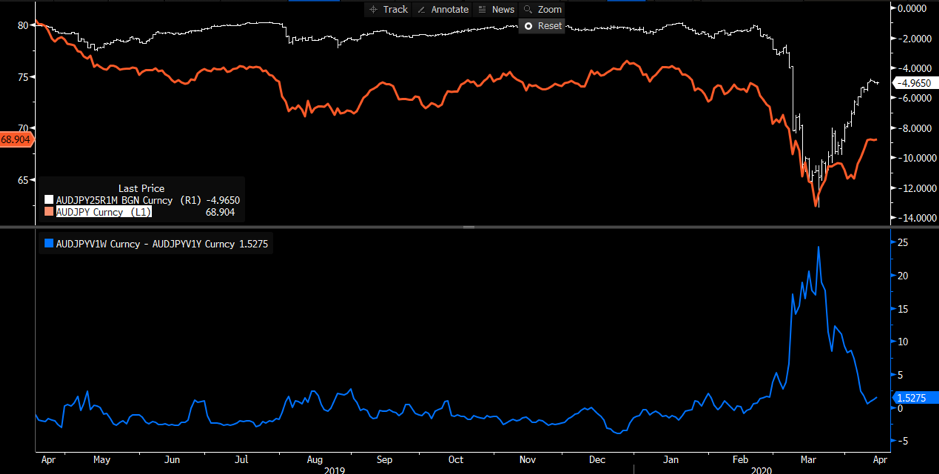
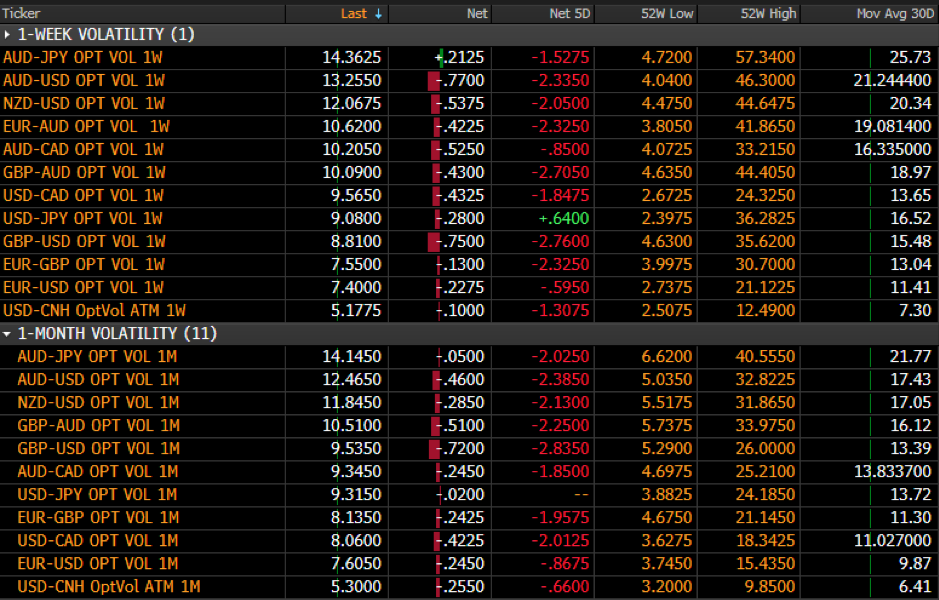
We can also see AUDJPY 1-month risk reversals have normalised (top pane – white line), while short term implied volatility (1-week – lower pane) is starting to rise relative to longer-term vols (1-year). A few red flags are waving in the distance.
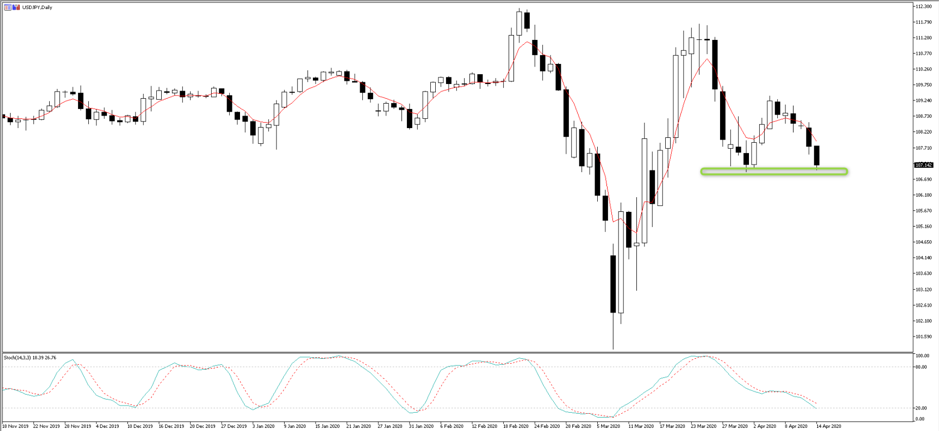
USDJPY is also on the radar for a break of 107-support. We are seeing some signs of buying support here, but if the weight of capital takes it through the figure then I’d be looking for 105.50 – it’s interesting that we’re not seeing more of a rise in USDJPY weekly implied vol, which remains under 10%
Implied volatility – 1-week and 1-month
"Source: Bloomberg"
1-week risk reversals
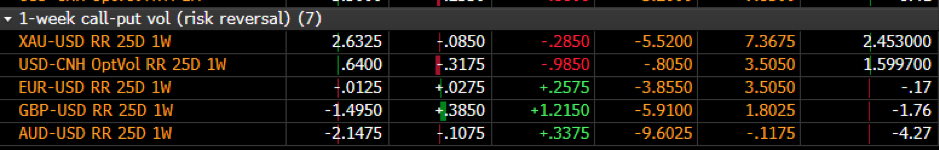
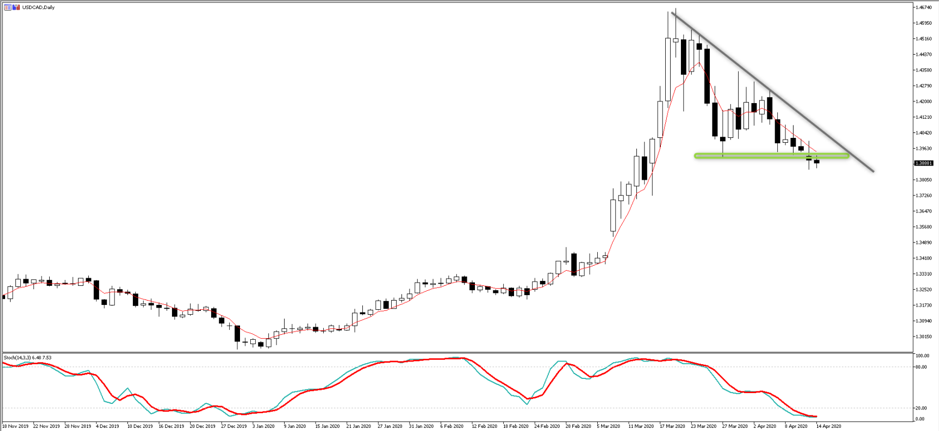
USDCAD – I think this is a fascinating set-up ahead of the BoC meeting (00:00 AEST). With crude lower, one would believe USDCAD should be higher, but I guess the USD has been in the doghouse over the last four days. On this daily set-up, I wouldn’t be buying as price is trending lower and until we see a close above the 5-day EMA shorts are preferred. However, like AUDJPY it feels like we could be on the cusp of a short squeeze higher. One to watch here.
The material provided here has not been prepared in accordance with legal requirements designed to promote the independence of investment research and as such is considered to be a marketing communication. Whilst it is not subject to any prohibition on dealing ahead of the dissemination of investment research we will not seek to take any advantage before providing it to our clients.
Pepperstone doesn’t represent that the material provided here is accurate, current or complete, and therefore shouldn’t be relied upon as such. The information, whether from a third party or not, isn’t to be considered as a recommendation; or an offer to buy or sell; or the solicitation of an offer to buy or sell any security, financial product or instrument; or to participate in any particular trading strategy. It does not take into account readers’ financial situation or investment objectives. We advise any readers of this content to seek their own advice. Without the approval of Pepperstone, reproduction or redistribution of this information isn’t permitted.