- English
- Italiano
- Español
- Français
- English
- Italiano
- Español
- Français
Analysis
Twitter (TWTR) Q3 earnings preview – for traders who like volatility

Date – after-market close 26 October (AEDT)
Trade Twitter all sessions on MT4 & MT5 with Pepperstone
Volatility and movement
- Volatility is almost assured - The implied move for TWTR on the day of earnings is 10.2% (higher or lower)
- The average absolute price change we’ve seen over the past eight quarters (on the day of earnings) is 12.5% - certainly in Q1 21 (-15.2%) and Q3 20 (-21.1%) we saw some incredible moves. This is a stock that can have huge moves over earnings
- Over the past 8 quarters, shares have had a mixed reaction on the day of reporting, rallying 4 of the past 8 announcements
- Going into earnings the 10-day realised volatility sits at 55%, a strong rise from the 11% level seen in August. It holds the highest levels of volatility since May and the 12th highest volatility read in our universe of US stocks
- Short interest sits at $25.7m, which is 3.3% of the free float. Still, while not at extreme levels, short activity has been rising since mid-June
- Twitter has a beta of 1.21 with the S&P 500, so relative to the index, Twitter typically has greater outsized moves.
Analysts review
Of the 39 analysts who cover TWTR, the bulk are neutral on TWTR, with 62% having a ‘hold’ rating. We see 10 with a ‘buy’ call and 5 with a ‘sell’. The consensus 12-month price target sits at $72.09, offering 16% potential upside from current levels, with the range set at $90 to $54.
Earnings considerations
Twitter has no clear edge when it comes to overdelivering on earnings, having beaten expectations on earnings-per-share in 5 of the past 8 quarters, and 6 of the past 8 on sales.
For Q3 21 expectations, the market is looking for:
- EPS of $0.178 (-6.5% YoY)
- Revenue of $1.28 (+37.1%)
- Gross margins of 64.43%
- Free cash flow of $77.64m
- Return on equity of 7.66%
Looking ahead, traders will question how the quarterly numbers and guidance feed into consensus expectations for:
- 2021 full-year EPS of $.894, 2022 EPS of $1.168
- 2021 revenue of $5.093b (37.04%), 2022 sales of $6.27b (23.1%)
- 2021 gross margins (GM) 80.85%, 2022 GM 80.42%
- 2021 CAPEX -$958m, 2022 CAPEX $974m
This is where the revisions will come from, which could have implications for the share price.
The market will be keen to focus on daily active users (DAU) and how they can effectively monetise that user base. Statistics around engagement could promote a reaction in the share price, as would levels of planned CAPEX.
Technical set-up
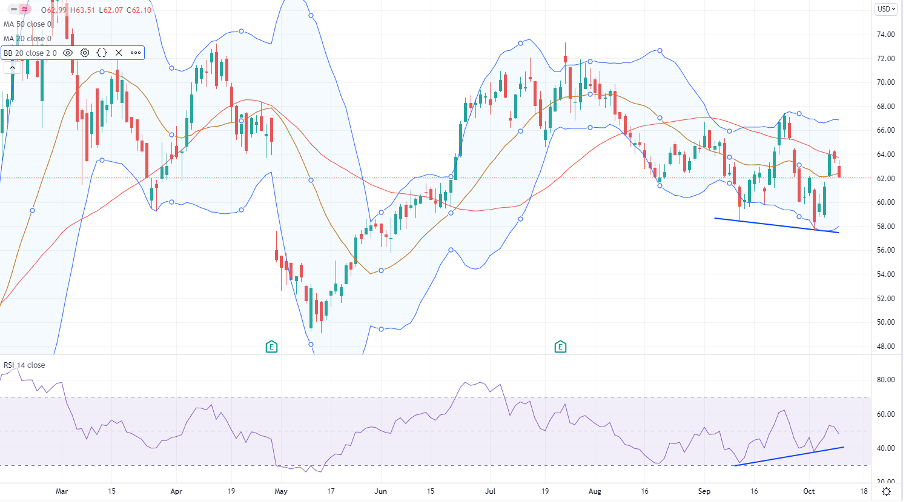
(Source: Tradingview - Past performance is not indicative of future performance)
Twitter is holding a $68 to $58 range well at present and have seemingly found a fair value. We see price oscillating around the 20- and 50-day moving average, and the Bollinger Bands (20 MA, 2 SD) look to contain moves for now. Clearly, a downside break of $58.50 changes the dynamic and I’d be asking if this is ready to start trending lower or establish a new lower trading range. A closing break of $67.45 and $74 would be the near-term target.
Into earnings, the base case is we see the range hold. Trade the potential opportunity with Pepperstone.
Related articles

Ready to trade?
It's quick and easy to get started. Apply in minutes with our simple application process.
The material provided here has not been prepared in accordance with legal requirements designed to promote the independence of investment research and as such is considered to be a marketing communication. Whilst it is not subject to any prohibition on dealing ahead of the dissemination of investment research we will not seek to take any advantage before providing it to our clients.
Pepperstone doesn’t represent that the material provided here is accurate, current or complete, and therefore shouldn’t be relied upon as such. The information, whether from a third party or not, isn’t to be considered as a recommendation; or an offer to buy or sell; or the solicitation of an offer to buy or sell any security, financial product or instrument; or to participate in any particular trading strategy. It does not take into account readers’ financial situation or investment objectives. We advise any readers of this content to seek their own advice. Without the approval of Pepperstone, reproduction or redistribution of this information isn’t permitted.