CFDs are complex instruments and come with a high risk of losing money rapidly due to leverage. 72.2% of retail investor accounts lose money when trading CFDs with this provider. You should consider whether you understand how CFDs work and whether you can afford to take the high risk of losing your money.
- English
- Italiano
- Español
- Français
Trading The March US Labour Market Report
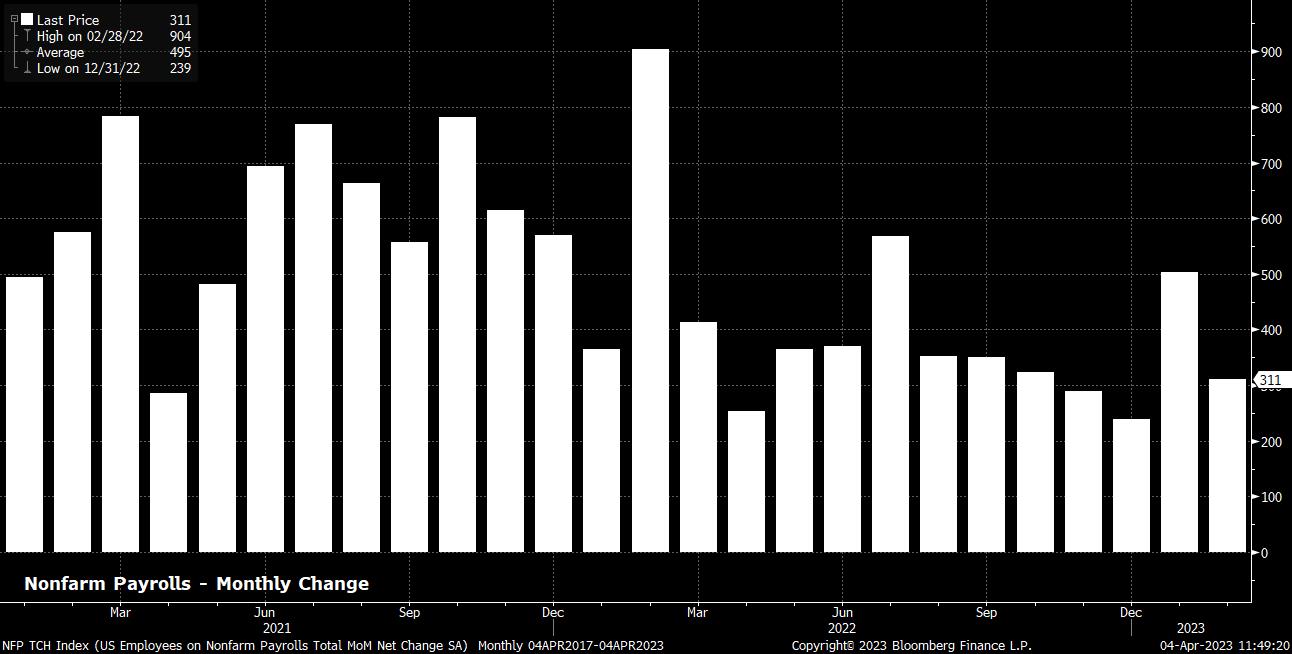
In any case, as for the jobs report itself, economists’ expectations are remarkably narrowly distributed for the headline payrolls print; consensus is seen at +240k, with a range of just 150k covering all estimates (or guesses!?) submitted to Bloomberg, ranging from +150k to +300k. Of note here, 11 payrolls prints in a row have surprised to the upside compared to consensus, the longest run of beats since the December 1996 report (as far as Bloomberg data goes back).

That said, it remains the other parts of the jobs report that are much more important from a macro, and policy, point of view; namely, the unemployment rate, and average hourly earnings figure.
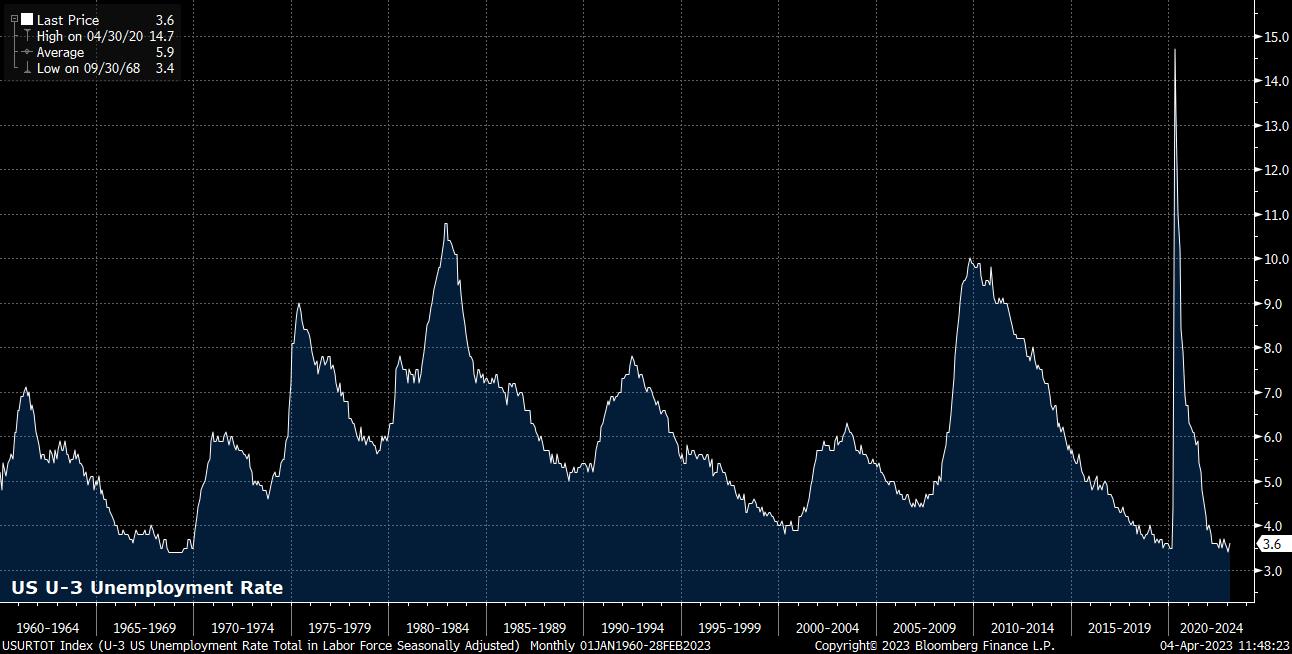
Unemployment is set to hold steady at 3.6%, after the 0.2pp rise seen in March, though this remains close to both cycle- and record-lows. It must be said, however, that such a rise is not necessarily a particular concern, especially if, as was the case in the prior report, it comes due to a rise in the participation rate (thus, effectively, being a result of more people looking for work, rather than job losses accelerating).

Earnings, meanwhile, are set to rise by a modest 0.3% MoM, a slight quickening on the 0.2% MoM pace seen in February, though a pace that remains far from sparking concern over a wage-price spiral, and one that shouldn’t cause too much consternation at the Fed.
A report in line with these expectations could, once again, be considered a ‘goldilocks’ report – one that is emblematic of a labour market that is not too hot, nor too cold, but just about right. It is, unsurprisingly, a deviation from this scenario where volatility, and therefore opportunity for traders.
One could consider any payrolls print below the 150k mark as a miss, something that would be compounded if unemployment were to come in north of the 3.7% expectation, without an accompanying rise in labour force participation. Conversely, a print above the top end of the forecast range at 300k, coupled with a better than expected set of unemployment and earnings figures, can be considered a beat compared to expectations.
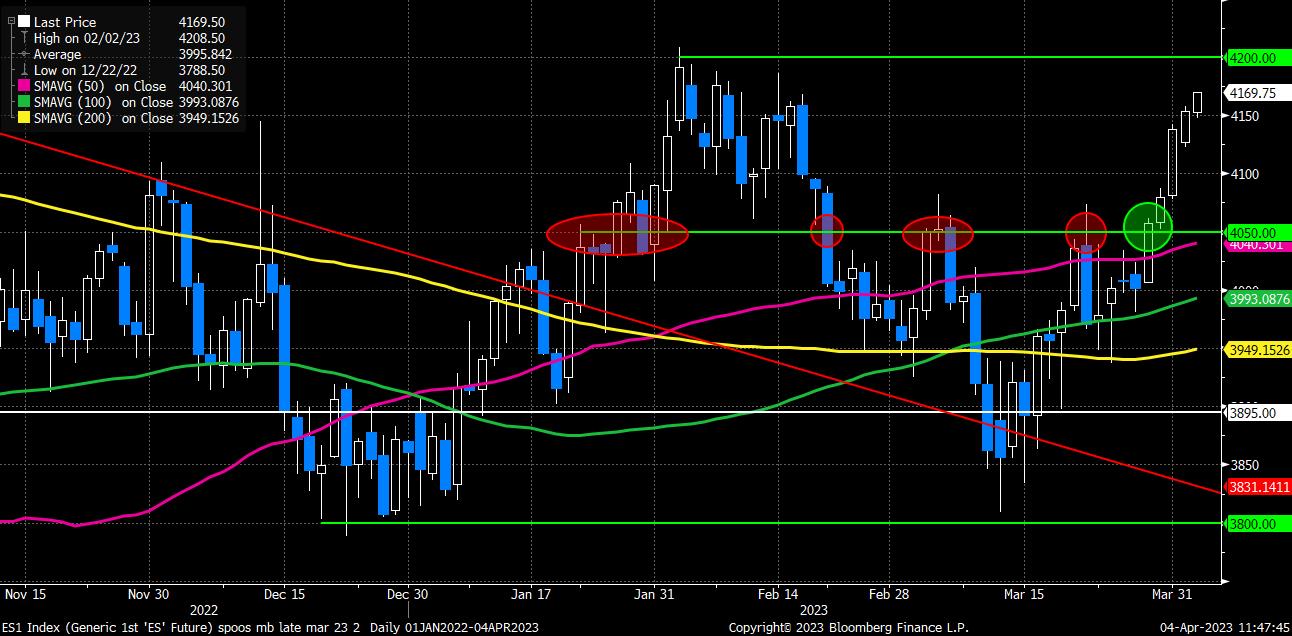
The data is likely to prove to be a classic case of ‘good news is bad news’ for riskier assets, in a similar way to that seen in reaction to the softer than expected ISM manufacturing report earlier this week. Having broken above the key 4,050 level late last week, that would put all eyes on 4,200 when it comes to the S&P 500, a level that the market hasn’t traded above since Q3 22. To the downside, the 50-day moving average remains the key dividing line, below which the bears are likely to regain control.

As for the USD, we also sit in an interesting position, with the bears in command, though holding much less of a firm grip on proceedings than we see with bulls and the equity market. Looking at the DXY in particular, the 102 level is firmly in the bears’ sights, with the market thus far respecting the descending trendline that has been running the show since mid-March.
_D_2023-04-04_11-47-17.jpg)
A break below the 102 handle opens the door to test prior support from January around 101.5, while an extension to the downside would target the early-February low of 100.80.
As always, it’s not just equities and the USD which are likely to experience heightened volatility over the NFP release. Gold also tends to see significant moves over the most important data release of the month, however this time around we will have to wait until Monday to see the yellow metal move, owing to markets being closed for Good Friday.
In any case, spot gold remains rather contained between well-defined support at $1,950/oz, and strong resistance at $2,000/oz; these two levels will be key as the market reacts (albeit belatedly) to the jobs report.
_xa_2023-04-04_11-46-55.jpg)
Related articles
The material provided here has not been prepared in accordance with legal requirements designed to promote the independence of investment research and as such is considered to be a marketing communication. Whilst it is not subject to any prohibition on dealing ahead of the dissemination of investment research we will not seek to take any advantage before providing it to our clients.
Pepperstone doesn’t represent that the material provided here is accurate, current or complete, and therefore shouldn’t be relied upon as such. The information, whether from a third party or not, isn’t to be considered as a recommendation; or an offer to buy or sell; or the solicitation of an offer to buy or sell any security, financial product or instrument; or to participate in any particular trading strategy. It does not take into account readers’ financial situation or investment objectives. We advise any readers of this content to seek their own advice. Without the approval of Pepperstone, reproduction or redistribution of this information isn’t permitted.
