- English
- Italiano
- Español
- Français
More sellers than buyers
Working in the London financial markets, I would hear traders ask, “why is the stock market down today?” Someone would always answer with the same sarcastic statement, “more sellers than buyers!” Although this is not the case, there is an element of truth behind the saying.
A more accurate synopsis is that there has been more ‘selling’ than ‘buying’. The volume of sell trades outweighs the amount of buy trades. The simple theory of supply and demand driving the market lower.
Volume – an important indicator
Volume indicators are an important factor when looking at stock market moves. Often, technical traders will look for confirmation that there are large orders going through the market.
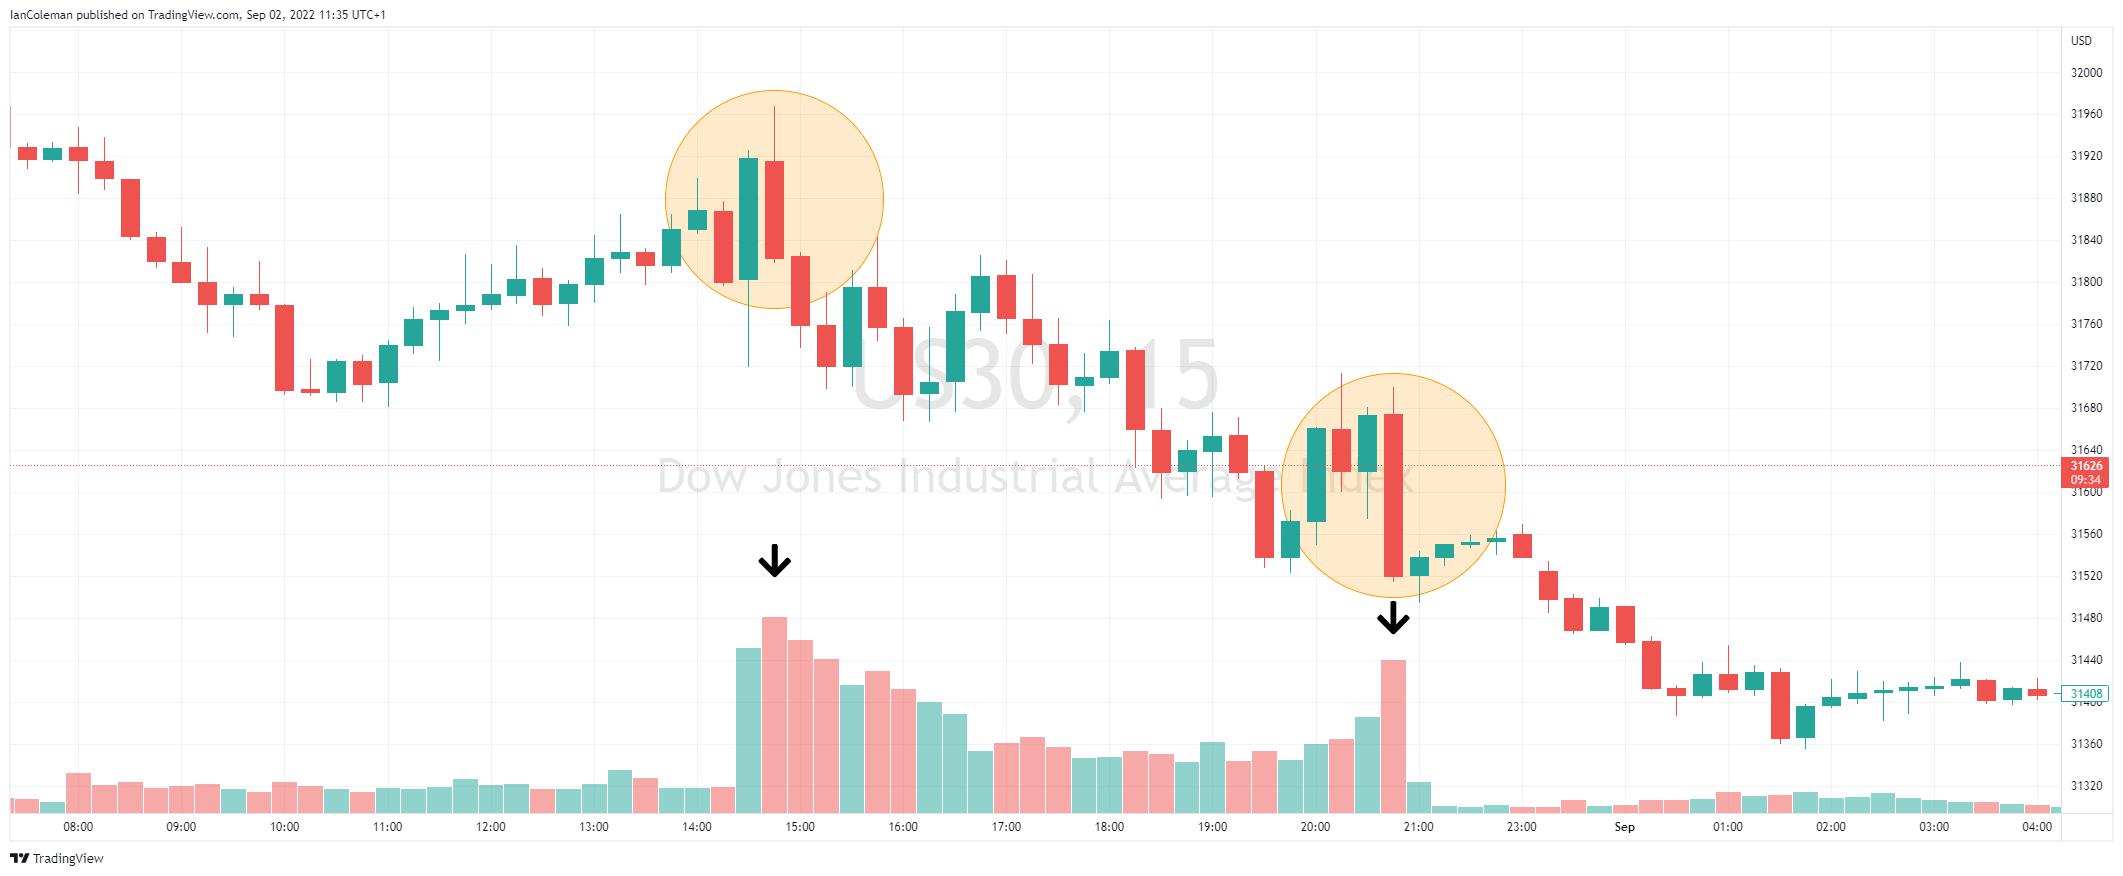
In the chart below we can clearly see the high-volume spikes. The first happened just after the US stock market opened, with the accompanying initial selloff. The second, just before the market closed, pushing the index to the low of the day.

Figure 1 TradingView Volume spikes
Factors that drive the markets
These moves are normally initiated by a fundamental driver. This can be varying elements, like the continuation of an overnight negative sentiment from other world indices. Perhaps figures have highlighted a slowdown in Chinese growth.
Let us look at some of the Key Drivers:
Earning reports
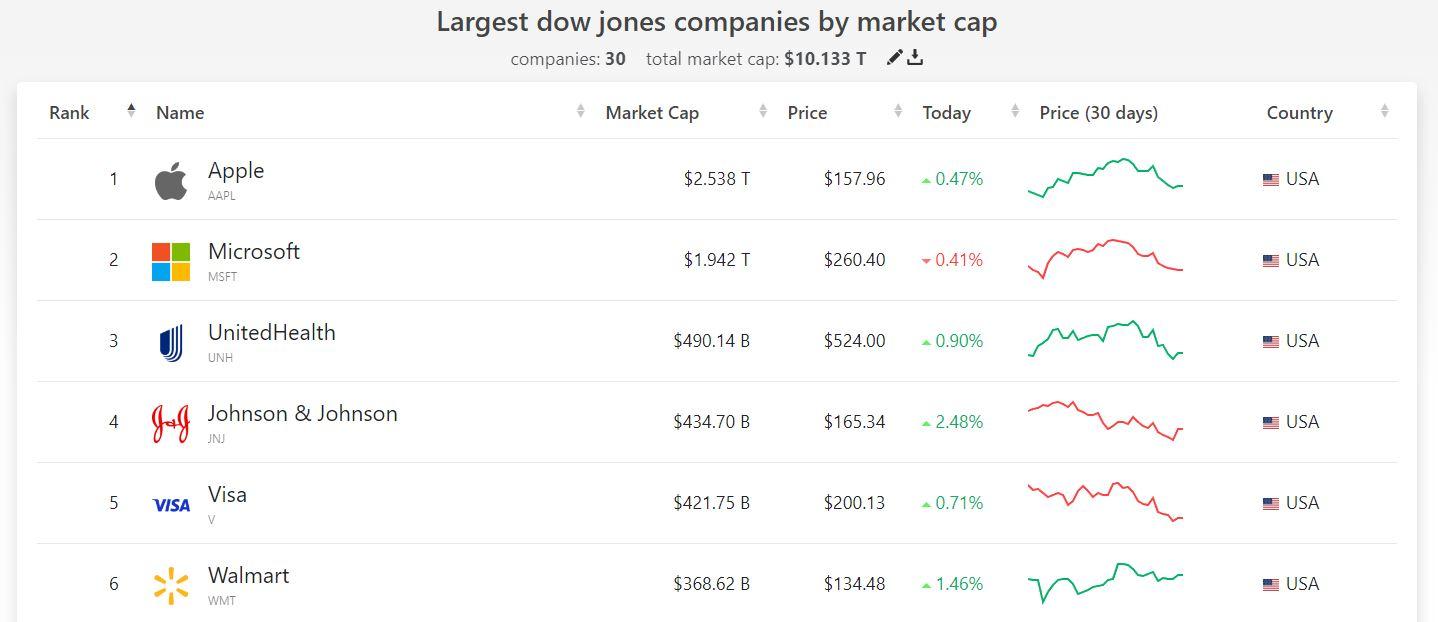
Stock Indices are made up of a basket of companies. The larger the companies Market Cap (Market Capitalization), the more that stocks movements will be reflected in the index.
Apple has a huge Market Cap of 2.538 trillion USD. It makes up over a quarter of the Dow Jones 30 index (10.133 trillion). A large move in Apple will have a knock-on effect to the Dow Jones 30 and other stock indices.

Figure 2 companiesmarketcap.com
Central Bank Speakers – fiscal policy
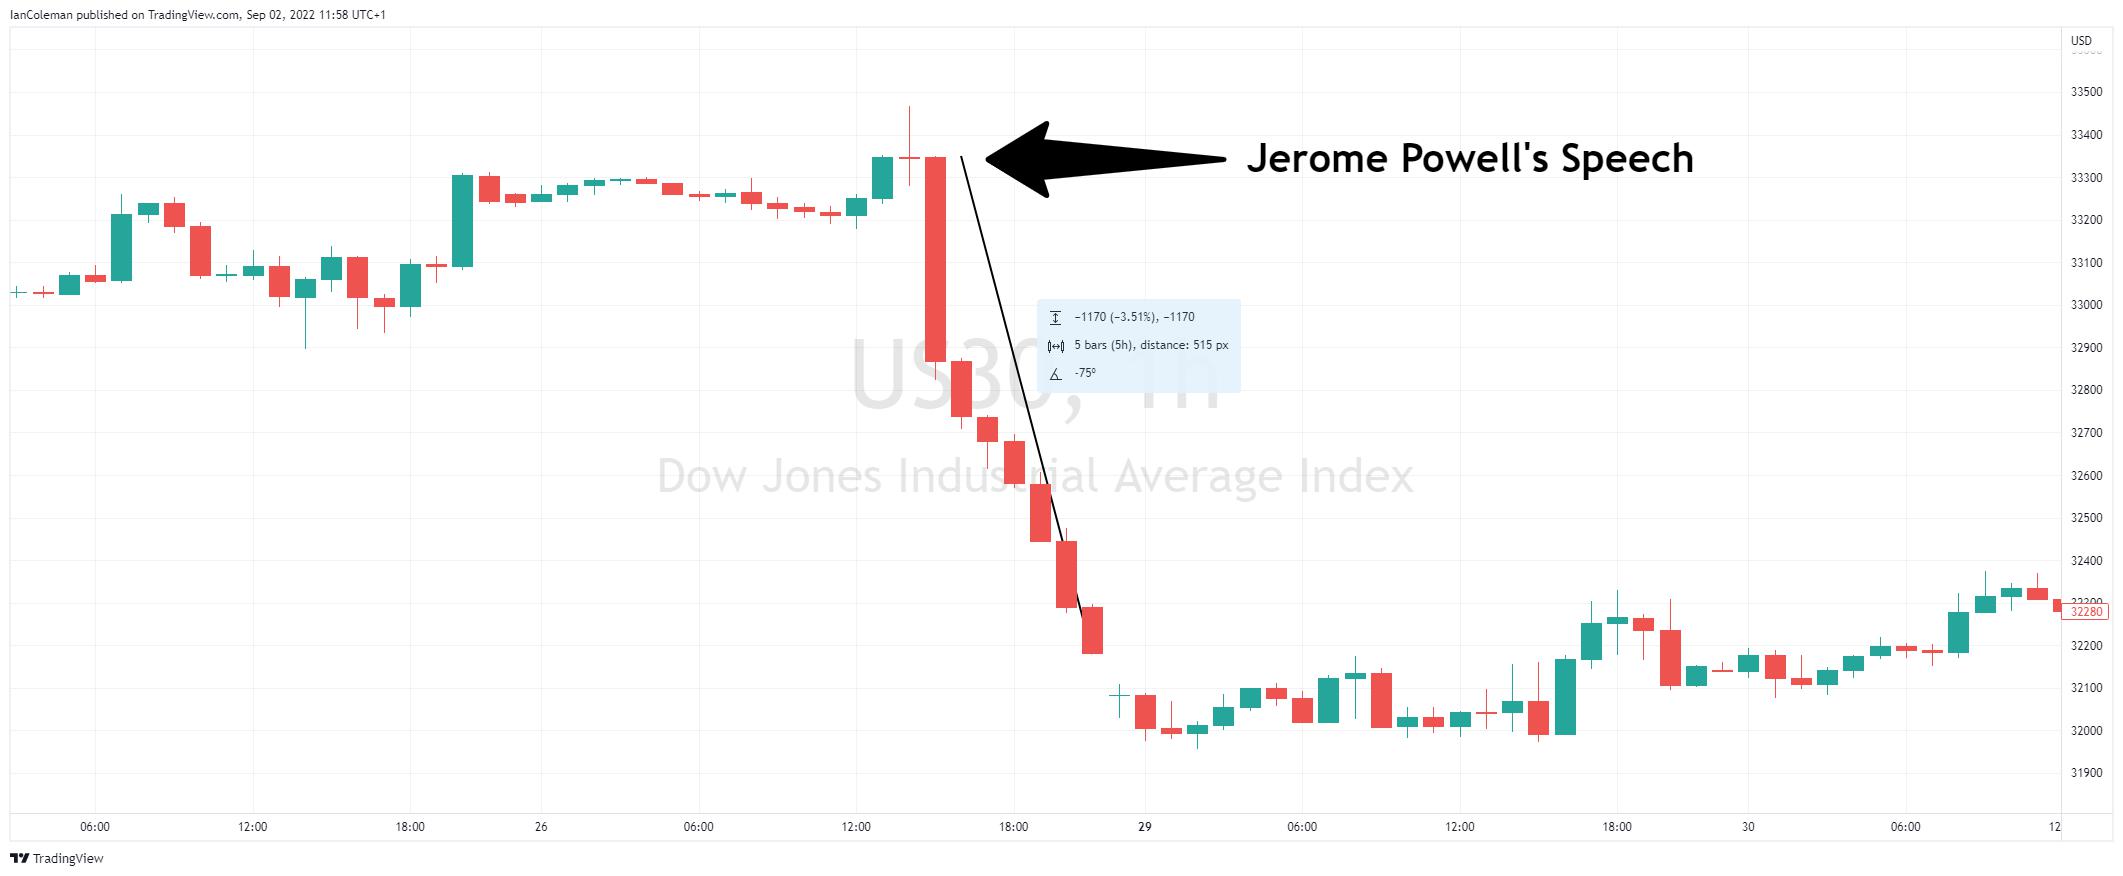
Central Bank speakers can have a dramatic effect on the price of stocks. Jerome Powell’s speech at Jackson Hole resulted in the Dow Jones 30 (US30) devaluing by 3.51% during the trading session.

Figure 3 TradingView Jerome Powell’s Speech
Economic Releases
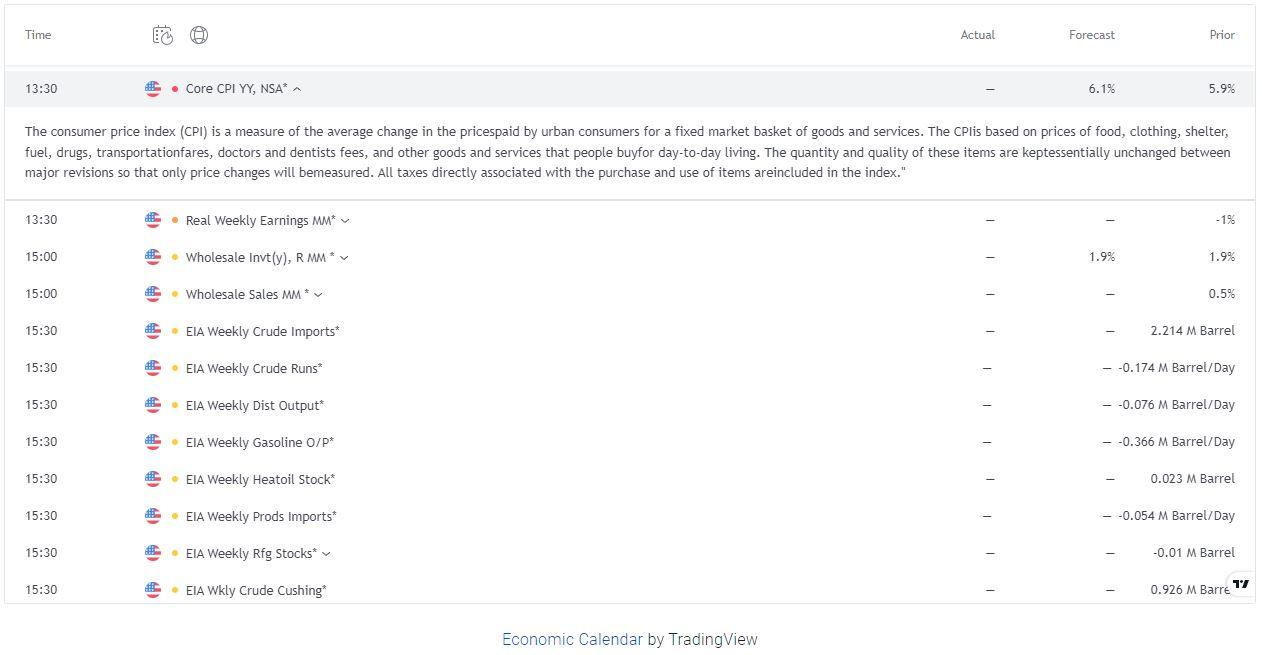
What can make the stock market move down today are economic releases. The most widely watched and anticipated is the N.F.P. This stands for Non-farm payroll. It is the employment figure from the United States.
You should also keep a keen eye on inflation and growth figures such as Consumer Price Index (C.P.I) and Gross Domestic Product (G.D.P).

Figure 1 TradingView Economic Calendar
For further information look at the economic calendar at Pepperstone.
Related articles
The material provided here has not been prepared in accordance with legal requirements designed to promote the independence of investment research and as such is considered to be a marketing communication. Whilst it is not subject to any prohibition on dealing ahead of the dissemination of investment research we will not seek to take any advantage before providing it to our clients.
Pepperstone doesn’t represent that the material provided here is accurate, current or complete, and therefore shouldn’t be relied upon as such. The information, whether from a third party or not, isn’t to be considered as a recommendation; or an offer to buy or sell; or the solicitation of an offer to buy or sell any security, financial product or instrument; or to participate in any particular trading strategy. It does not take into account readers’ financial situation or investment objectives. We advise any readers of this content to seek their own advice. Without the approval of Pepperstone, reproduction or redistribution of this information isn’t permitted.

