- English
- Italiano
- Español
- Français
- English
- Italiano
- Español
- Français
Learn to trade
Let us dig deeper into the FTSE100
We are going to look at a brief history, what constituents make up the FTSE100, why the FTSE has a fundamental difference to other indices, some trading strategies for the index and the performance so far this year.
Shown on spread betting and CFD platforms as the UK100, the index is a popular trading product for day traders and investors alike. This is due to the high liquidity, making the spread, or cost to trade, limited.
A brief history
The FTSE was launched in 1984. Owned and run by the FTSE Russell Group, it looks to track the performance of the top 100 companies listed on the London Stock Exchange by market capitalization.
Market capitalization is the overall value of the company. It is derived from the current share price multiplied by the amount of listed shares.
The top 5
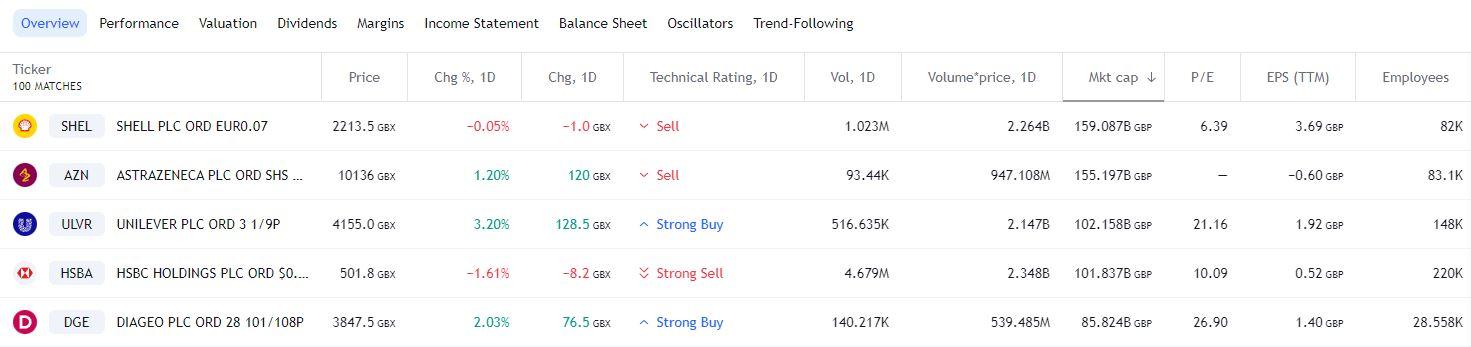
Figure 1 TradingView FTSE100 top five market cap 26/09/2022
The top 5 companies by market cap are:
- Shell, listed under Energy and Minerals, with a market cap of £159 billion
- AstraZeneca, Health Technology, with a meerkat cap of £155 billion
- Unilever, Consumer non durables (household, personal care), with a market cap of £102 billion
- HSBC Holdings, Finance, with a market cap of £101 billion
- Diageo, Consumer non durables (beverages and alcohol), with a market cap of £85 billion
Sub sectors and weighted %
The FTSE100 is broken down into twenty ‘supersectors’. It is important to note that the top three sectors by market cap are Energy, Healthcare and Banks.
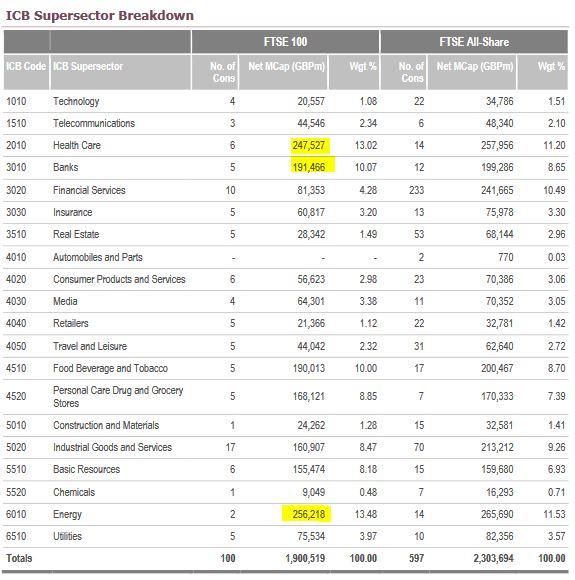
Figure 2 FTSERussell Factsheet 26/06/2022
A fundamental difference to other bourses
Other global bourses are normally a solid reflection of the country of origin's financial health. The DAX30 (GER30) is a good bellwether for the financial health of Germany for example.
This is where the FTSE100 has a fundamental difference. A look at the top 5 companies and the top 3 sectors by market cap, and the majority produce their income from sales or revenues overseas.
With the companies then converting their overseas income back into GBP (the Great British Pound), the strength of weakness of the GBP can have an influential effect on the index.

Figure 3 TradingView Index comparison 26/09/2022
This has resulted in the FTSE100 fairing far better in 2022 than other financial indices. The DAX is down -23.71%, the US30 down 18.93% while the FTSE100 has only devalued -4.9% by comparison.
The Great British Pound has devalued against the US dollar (GBPUSD) -20.35% over the same period.
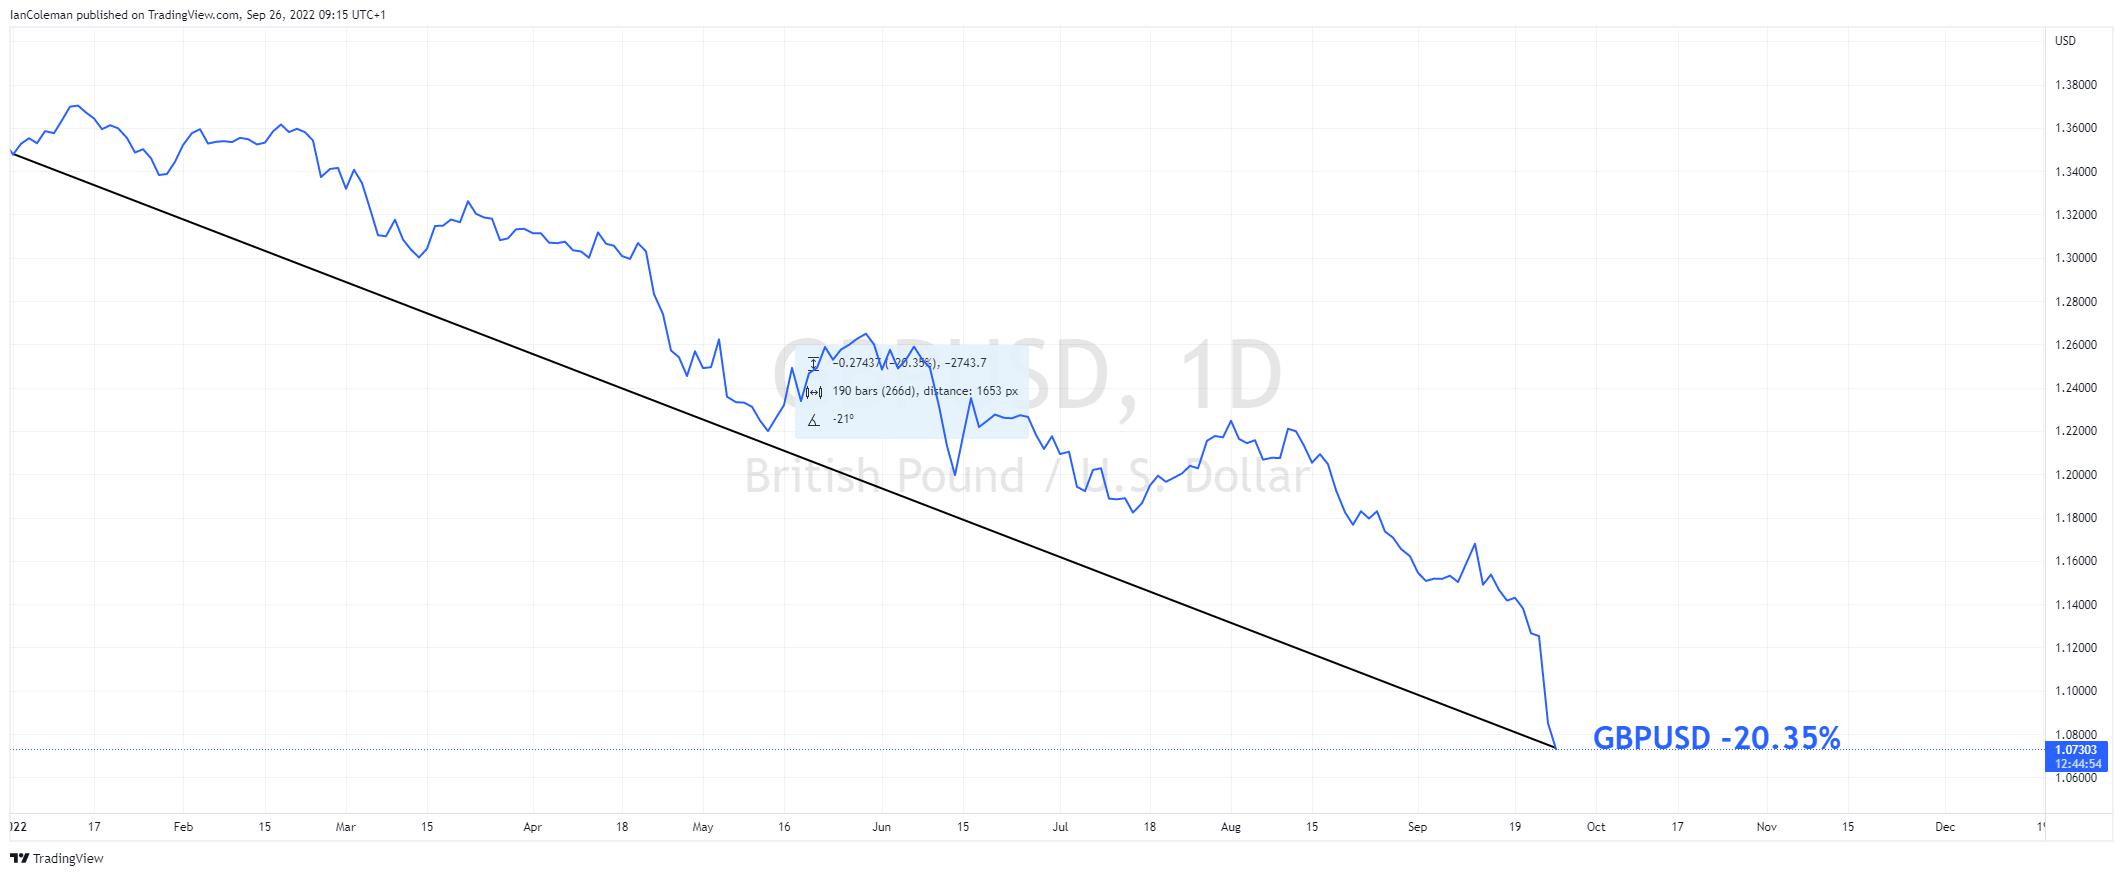
Figure 4 TradingView GBPUSD 26/09/2022
Hedging GBPUSD and FTSE
With these facts in mind, selling GBPUSD while buying the FTSE100 can be a good hedge. Conversely, buying GBPUSD while selling the FTSE100 could also be a sound strategy.
FTSE100/DAX30 spread trade
This disparity can result in the FTSE100 not reacting in the same manner as other indices. Some traders look to take advantage of this difference in sentiment.
Looking at the FTSE100 and DAX30 overlay chart, we can see that both indices moved to the upside mid-session on the 8th September, 2022. However, at the peak the DAX30 had rallied over 2% more than the FTSE100.
Traders look to take advantages of this FTSE/DAX spread by selling the higher index (DAX30) and buying the lower index (FTSE100).
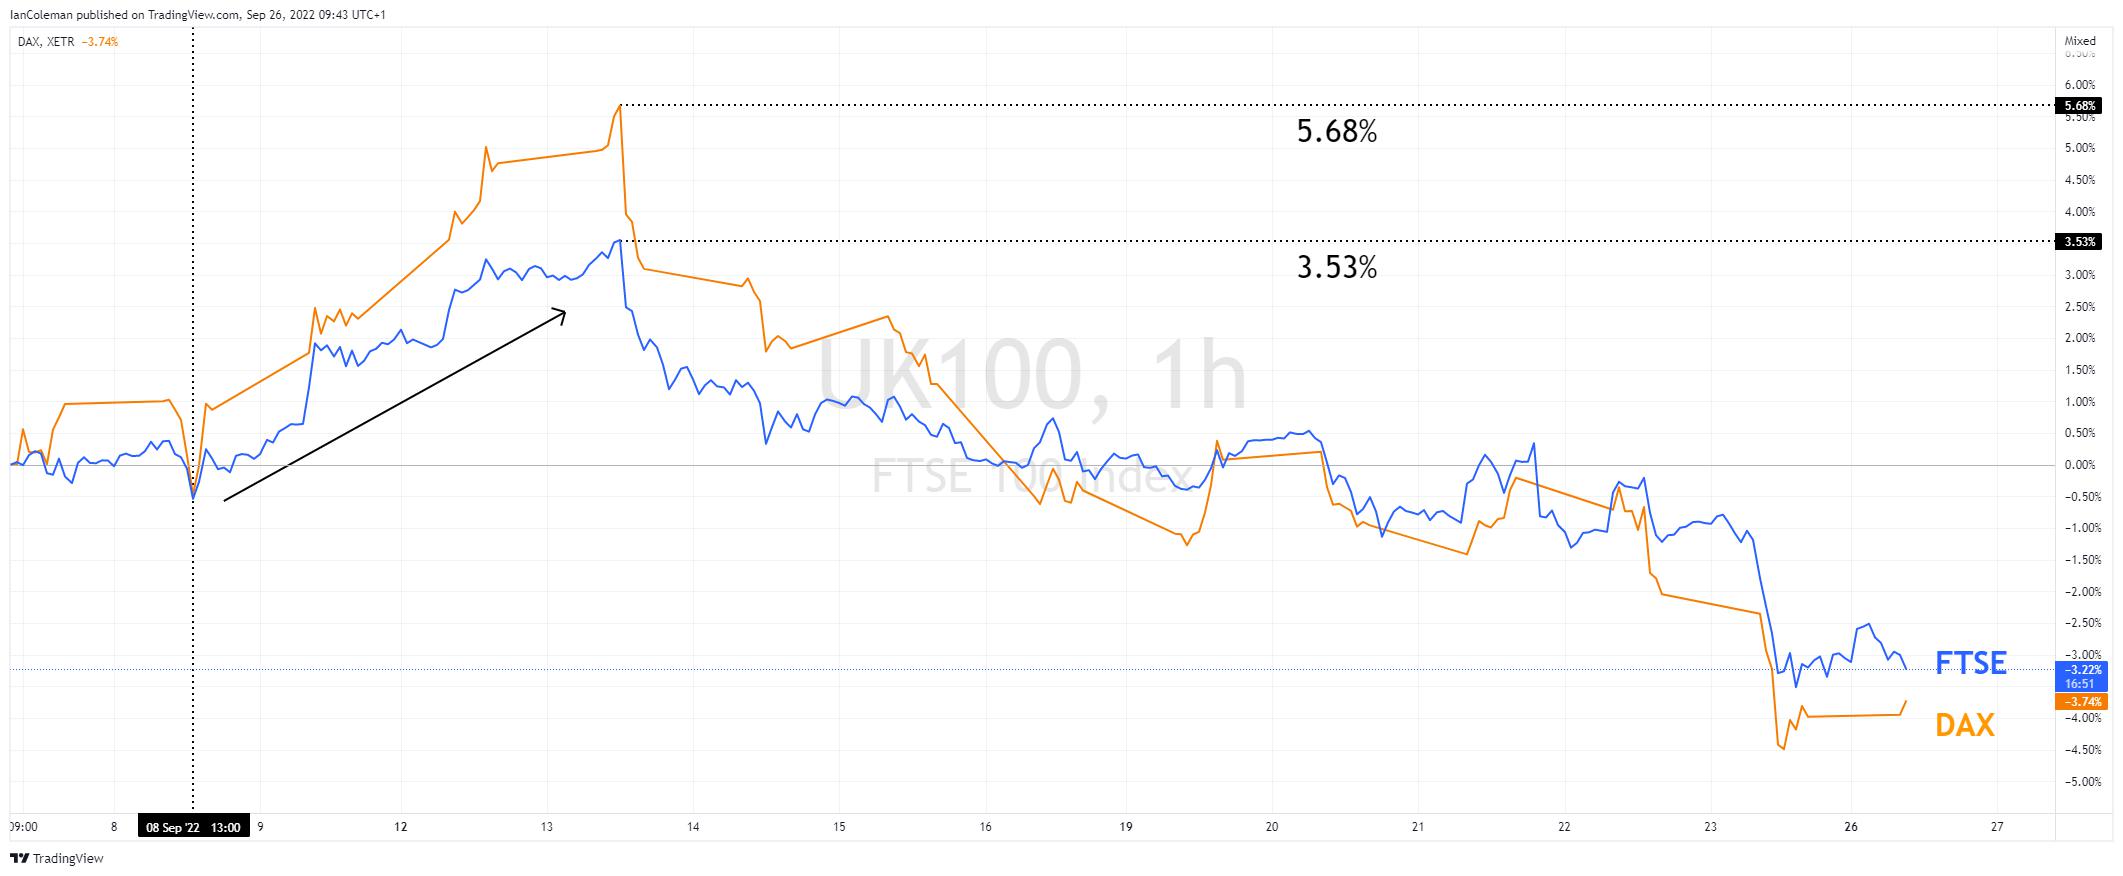
Figure 5 TradingView FTSE/DAX spread 26/09/2022
The trade is then closed on the 16th of September when the two bourses meet at 0.13%. The spread has been closed.
- The calculation for the profit and loss is:
- DAX30 selling at 5.68% closing at 0.13% = +5.5%
- FTSE100 buying at 3.53% closing at 0.13% = -3.4%
- Overall profit of 2.1%
*It should be noted that a separate calculation is needed to gain the correct weight (trade size) between the two indices.
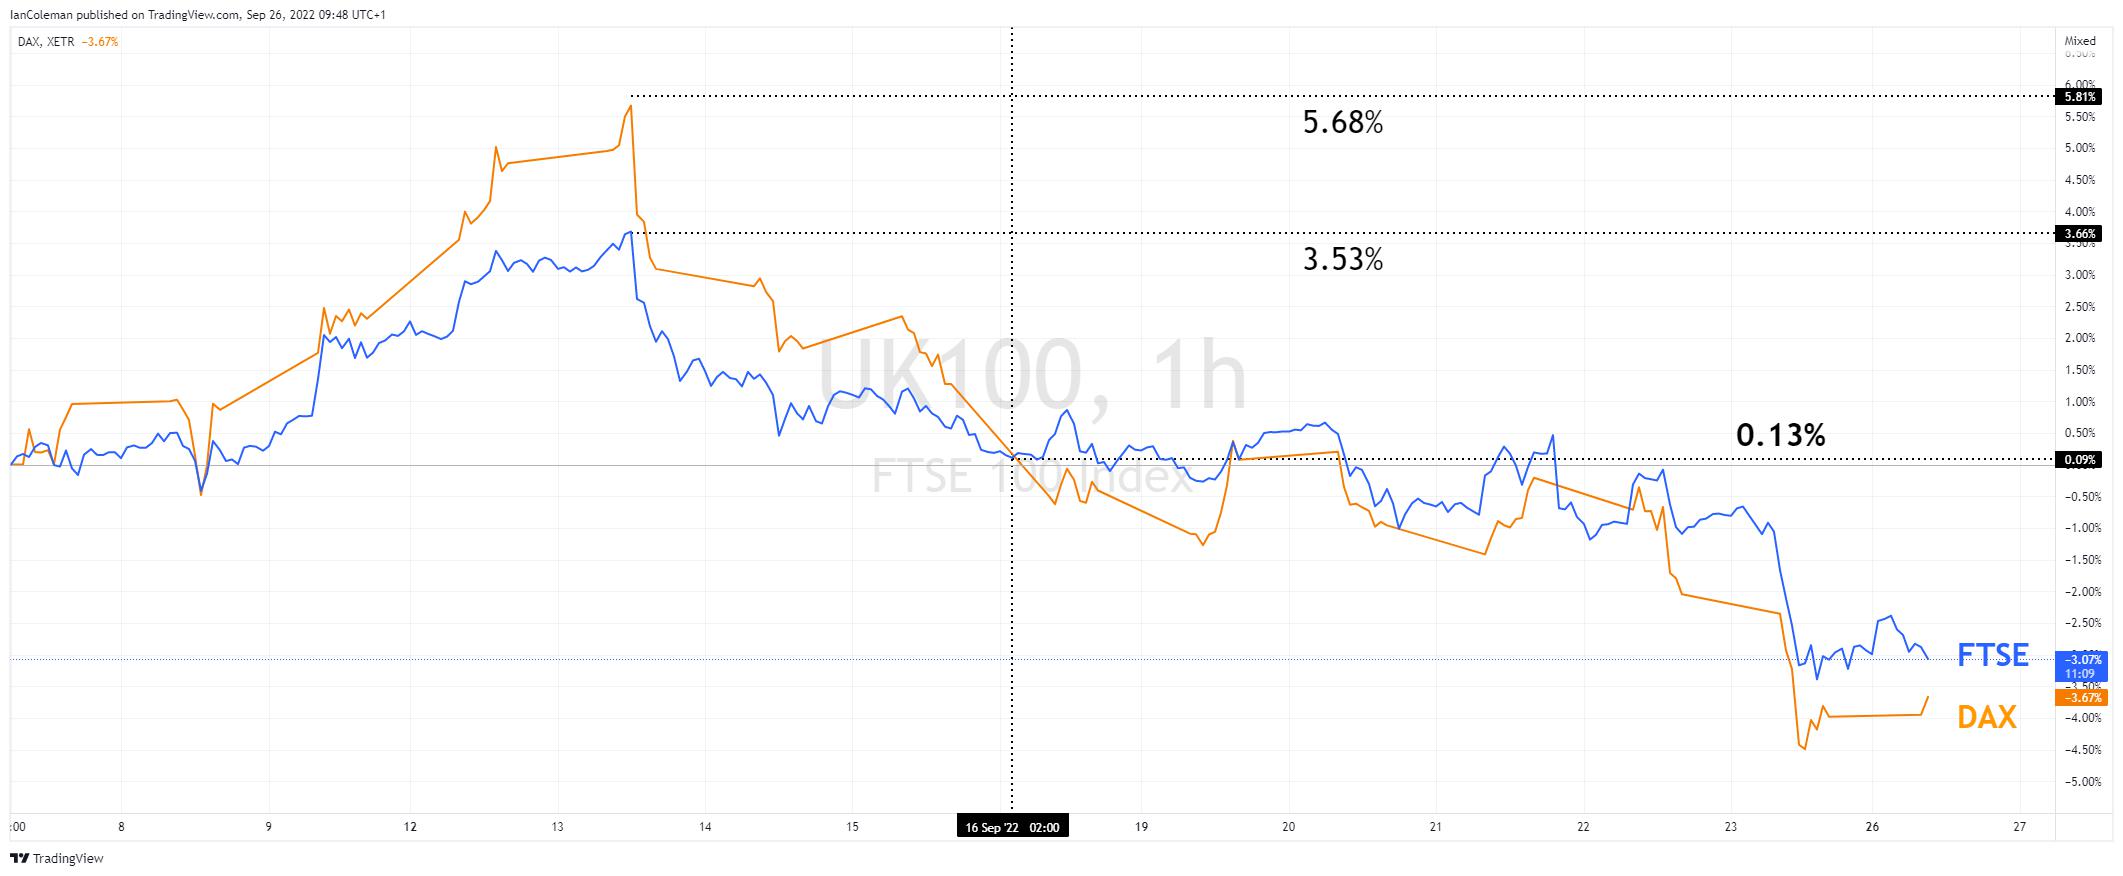
Figure 6 TradingView FTSE/DAX spread closed 26/09/2022
A look from a technical perspective
GBPUSD
With the exchange rate having such a dramatic effect on the index, let us first look at GBPUSD.
At the time of writing, the GBPUSD exchange has just traded to the lowest level since the 1985 low of 1.0520.
From an Elliott Wave perspective, the last move lower can be seen in a 5-wave pattern. This could highlight that a low is now in place and an upside correction could take place. It may be worth watching current price action on the weekly chart. A high close next week could form a Morning Doji Star pattern and highlight that a base is in place.
Will the long awaited GBPUSD strength weigh on the FTSE100?
FTSE100
The FTSE100 completed a three-candle formation known as an Evening Doji Star on the week 22nd of August. This formation is often seen at the top of the trend and the start of a new downward bias.
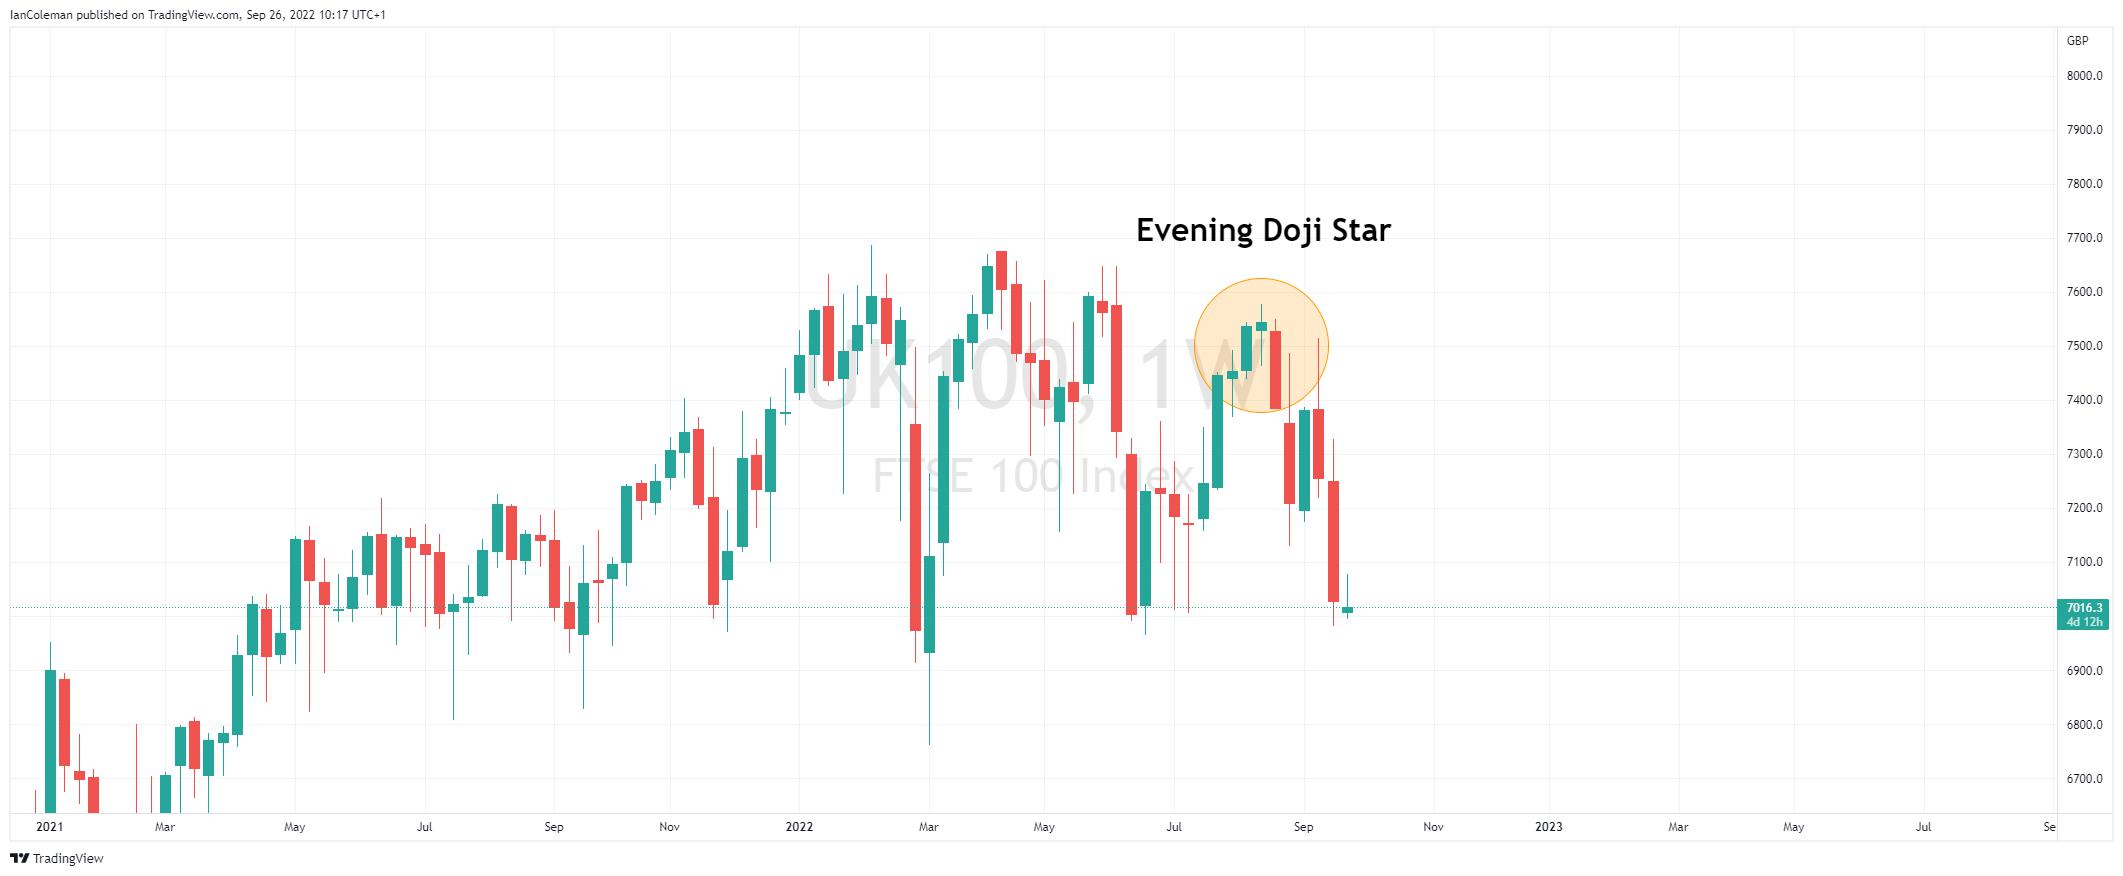
Figure 7 TradingView FTSE100 Evening Doji Star 26/09/2022
Negative sentiment has been strong from the 13th of September with a net decline of -6.6%
From a technical perspective, there is a Fibonacci confluence area to the downside at 6521-6509. A move to this zone would produce a Cypher pattern known as a Butterfly formation and could signal a temporary base.
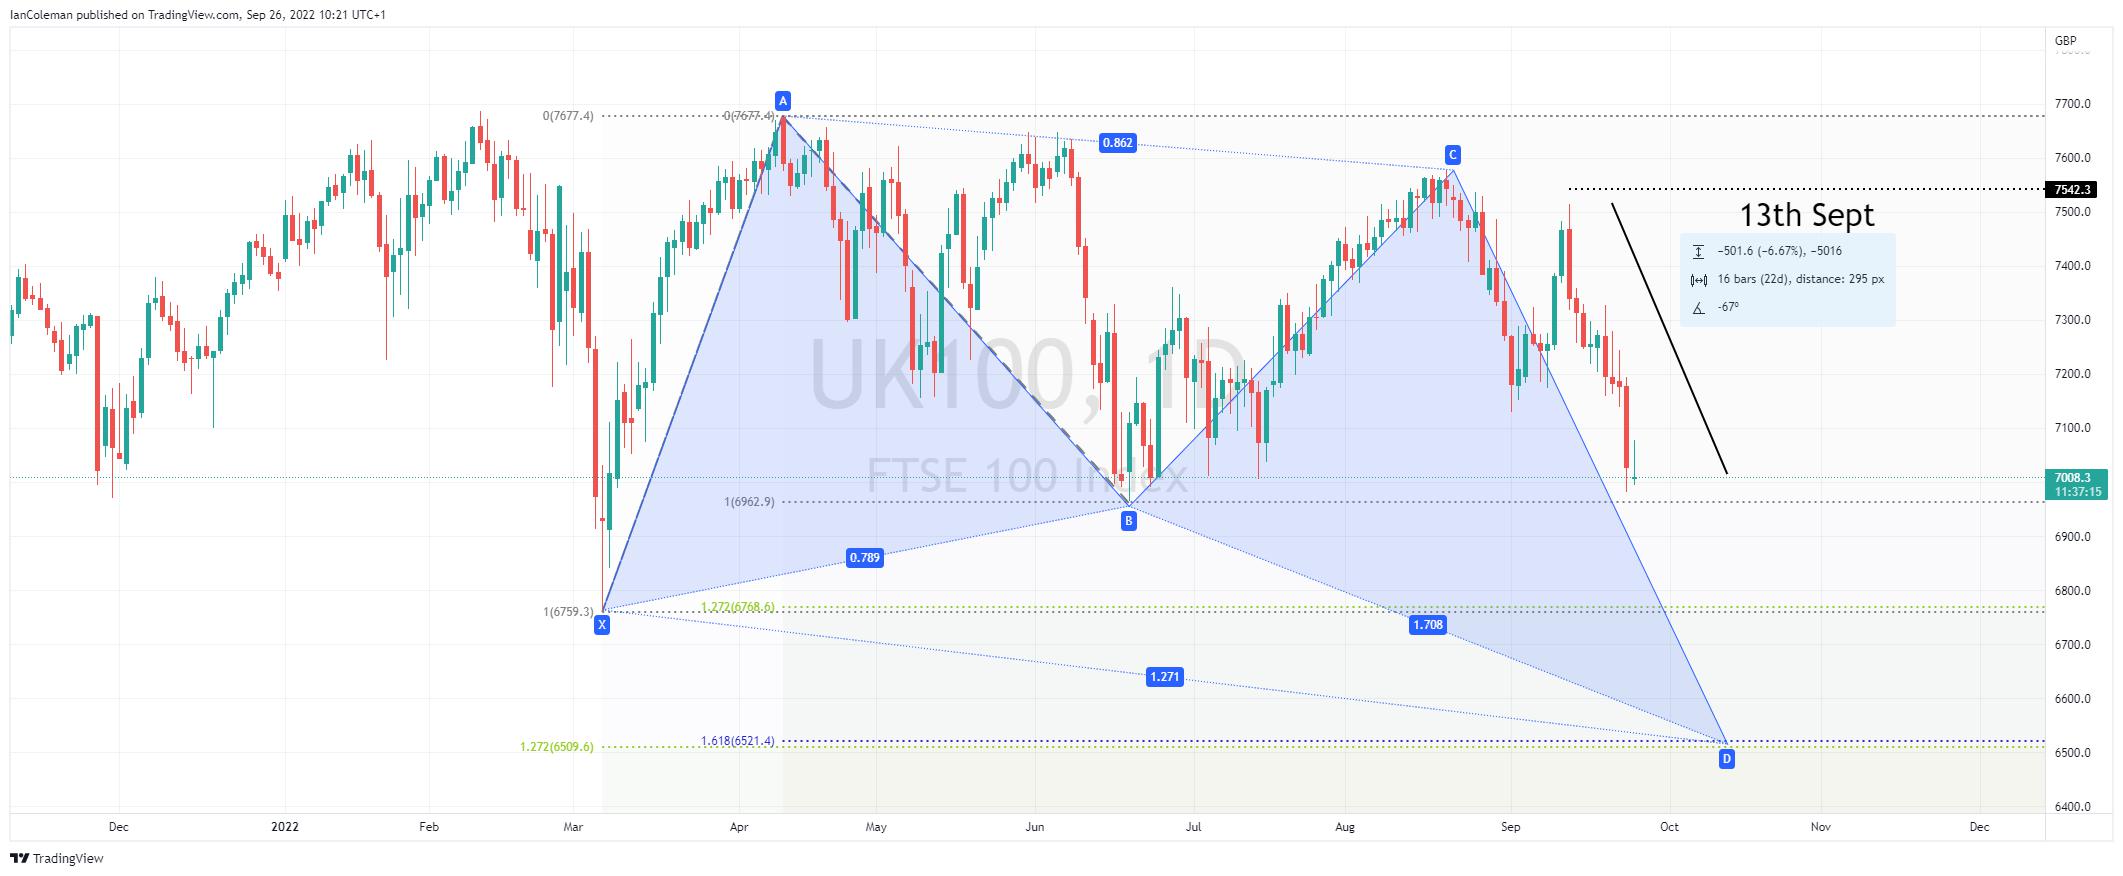
Figure 8 TradingView FTSE100 Butterfly formation 26/09/2022
To learn more about technical analysis, click on the link.
Related articles

The material provided here has not been prepared in accordance with legal requirements designed to promote the independence of investment research and as such is considered to be a marketing communication. Whilst it is not subject to any prohibition on dealing ahead of the dissemination of investment research we will not seek to take any advantage before providing it to our clients.
Pepperstone doesn’t represent that the material provided here is accurate, current or complete, and therefore shouldn’t be relied upon as such. The information, whether from a third party or not, isn’t to be considered as a recommendation; or an offer to buy or sell; or the solicitation of an offer to buy or sell any security, financial product or instrument; or to participate in any particular trading strategy. It does not take into account readers’ financial situation or investment objectives. We advise any readers of this content to seek their own advice. Without the approval of Pepperstone, reproduction or redistribution of this information isn’t permitted.