What is Bitcoin trading and how do you trade it?
Bitcoin trading has revolutionised the traditional investment landscape. As the leading cryptocurrency, Bitcoin continues to be the most traded and discussed digital asset. But how does Bitcoin trading work, and what strategies should you employ?
What is Bitcoin trading?
Trading Bitcoin is simply the act of buying or selling the cryptocurrency with the goal of making a profit. Unlike more traditional investment channels, Bitcoin trading can be done through cryptocurrency exchanges or via financial derivatives like contracts for difference (CFDs).
Because of the decentralised nature of Bitcoin, it’s not controlled by any government or financial institution. This creates something of a unique trading experience – especially if you’re new to crypto.
Traders can capitalise on Bitcoin’s price movements, influenced by factors ranging from market demand to global economic conditions. Given Bitcoin's inherent volatility, there are numerous opportunities for traders to profit, or incur losses, from short-term price fluctuations.
How does Bitcoin trading work?
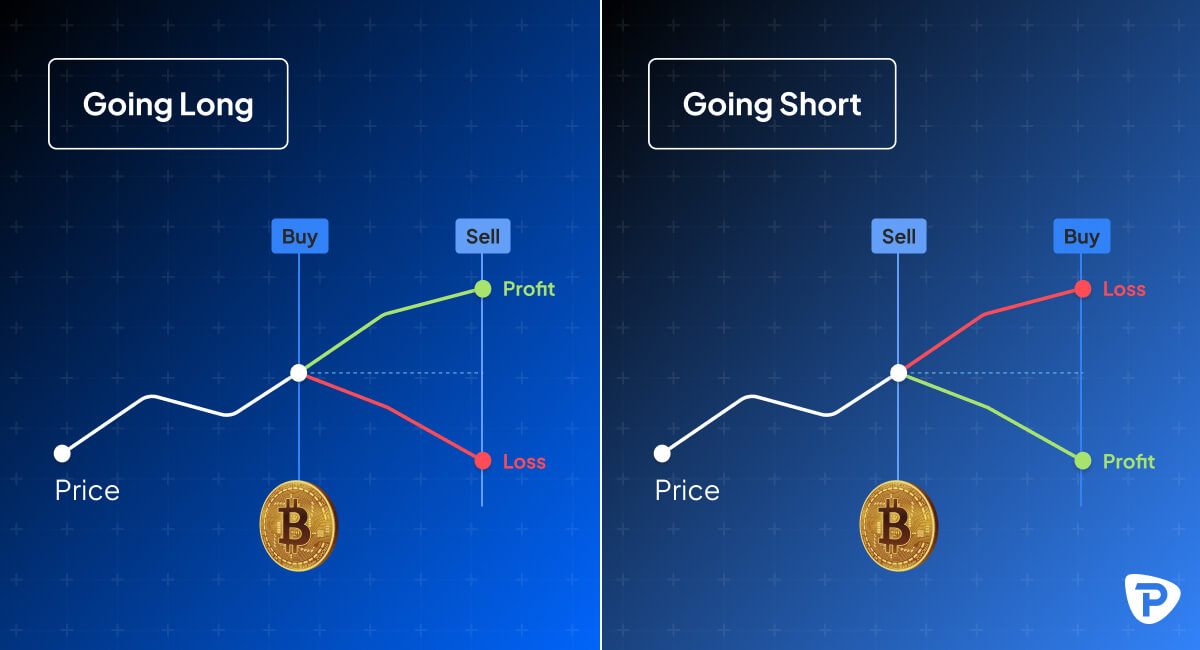
Bitcoin trading involves speculating on the cryptocurrency's price movements. This can be done by taking a long position (buy) if an increase in price is anticipated, or a short position (sell) if a decrease is expected.
Bitcoin trading can occur through cryptocurrency exchanges, where actual Bitcoins are bought and sold, or through brokers offering Contracts for Difference (CFDs). CFDs allow traders to speculate on future market movements of the price of Bitcoin without owning the actual asset, which can help in reducing overall risk.
Traders may use tools like leverage and margin, which have the potential to boost profits but also increase risks. A solid understanding of market analysis, including both technical and fundamental analysis, is essential for successful trading.
How to trade Bitcoin CFDs with Pepperstone
- The first step to trading Bitcoin CFDs is to open a live trading account with us, choosing your preferred trading platform; MT4/MT5, cTrader, TradingView or Pepperstone Platform.
- You can fund your account using various funding methods, including bank transfer, credit card, or e-payments such as PayPal and more.
- Before you open a trade, it is important to have a plan and do fundamental and technical analysis to stay up-to-date with news events and market trends. Follow our daily market analysis.
- Ready to trade? Go to your chosen trading platform to open your first position.
- From the left-side “Market Watch” / “Symbols List” bar, select the BTC instrument.
- All set to place your trade! You can go long or short and based on your prediction and the size of the market movement you will profit or lose.
You should regularly monitor the market to track performance. You can close your position manually or set stop loss/take-profit orders to close it automatically once it reaches your desired price levels.
Why is Bitcoin the most popular cryptocurrency?
Bitcoin's popularity stems from its status as the first cryptocurrency.
Beyond being the pioneering crypto, Bitcoin is highly liquid and widely accepted as a digital asset for payments. It enjoys strong brand recognition and has a large, active community supporting its development and use.
Bitcoin has a finite supply of 21 million coins, creating scarcity that can drive demand. Its widespread use as a store of value and medium of exchange further solidifies its position as the leading cryptocurrency. Additionally, significant institutional interest and adoption by major companies had contributed to its prominence.
What factors move Bitcoin pricing?
The price of Bitcoin can be influenced by various factors, including:
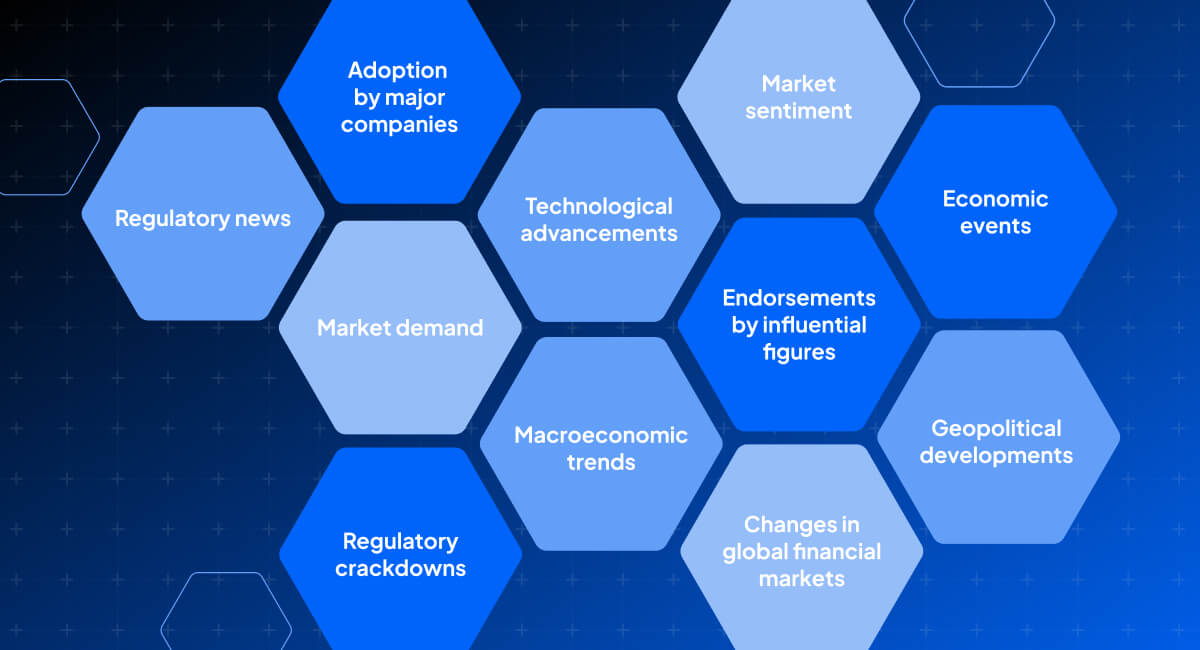
Staying updated with the latest market news is essential to remain well-informed about these and other factors that can impact Bitcoin pricing.
Bitcoin strategies
Bitcoin traders employ various strategies tailored to different trading styles and market conditions. It’s important to thoroughly research and understand each strategy before applying them:
- Day trading
This involves buying and selling Bitcoin within a single ‘trading day’ to capitalise on short-term price movements. Experienced traders will use technical analysis to identify entry and exit points, and they will often rely on market indicators and chart patterns to make quick decisions. Be aware that day trading requires constant monitoring of the market and can be very time-intensive. - Swing trading
Swing trading focuses on capturing gains from price swings over days or weeks. Traders hold positions longer than a day but shorter than long-term investors, using market trends and patterns to guide their decisions. Swing trading provides a balance between trading frequency and potential gains. - Scalping
Bitcoin scalpers focus on making small profits from minor price changes, often by holding positions for just minutes at a time. Scalping requires a highly disciplined mindset and fast decision-making. Scalpers can make numerous trades throughout the day, all with the goal of building profits incrementally. A high level of market understanding and quick execution skills are essential to improve performance, although success is not guaranteed. - HODL
HODLing is a term popular in the Bitcoin community for holding Bitcoin for an extended period, regardless of market volatility, with the belief that its long-term value will increase. This strategy is based on the fundamental belief in Bitcoin’s future growth and potential as a store of value. HODLers often disregard short-term price fluctuations in favour of long-term gains. - Arbitrage
Arbitrage involves buying Bitcoin on one exchange at a lower price and selling it on another exchange at a higher price, profiting from the price difference. This strategy requires quick actions and knowledge of different exchanges' pricing and fee structures at any given moment. Arbitrage opportunities can be fleeting and are very time-sensitive. - Trend trading
Trend trading capitalises on the momentum of Bitcoin’s price movements. Trend traders identify the direction of the trend and open positions accordingly, either long or short. This strategy relies on the assumption that current trends will continue, allowing traders to ride the trend for a profit until it shows signs of reversal. - Breakout trading
Breakout trading involves entering the market at the beginning of a trend when the price breaks out of a defined support or resistance level, with further movement in that direction expected. Key levels on a chart are identified, and trades are placed when these levels are breached, aiming to catch the early part of a new trend. - Mean reversion
Mean reversion is a strategy based on the assumption that Bitcoin’s price will return to its average over time. This approach involves buying when prices are low and selling when prices are high, with the expectation that deviations from the mean are temporary. It relies on the statistical concept that prices will revert to their historical average. - Fundamental analysis
Fundamental analysis involves determining Bitcoin’s intrinsic value by examining factors such as the technology, adoption rate, and market conditions. This analysis considers underlying factors driving Bitcoin’s value, including network activity, regulatory developments, and macroeconomic indicators, to make informed trading decisions. - Technical analysis
Technical analysis uses historical price data and chart patterns to predict future price movements. Traders use indicators like moving averages, relative strength index (RSI), and Fibonacci retracement levels to analyse market trends and identify potential trading opportunities. This approach is based on the belief that historical price movements can provide insights into future behaviour.
Should you hedge Bitcoin?
Hedging Bitcoin involves taking offsetting positions to reduce the risk of adverse price movements.
While hedging can protect against significant losses, it can also limit potential gains. This strategy is often used to manage risk in volatile markets, reducing exposure to unfavourable price swings. A solid understanding of derivative instruments and careful planning are essential for effective Bitcoin hedging.
Benefits of trading Bitcoin
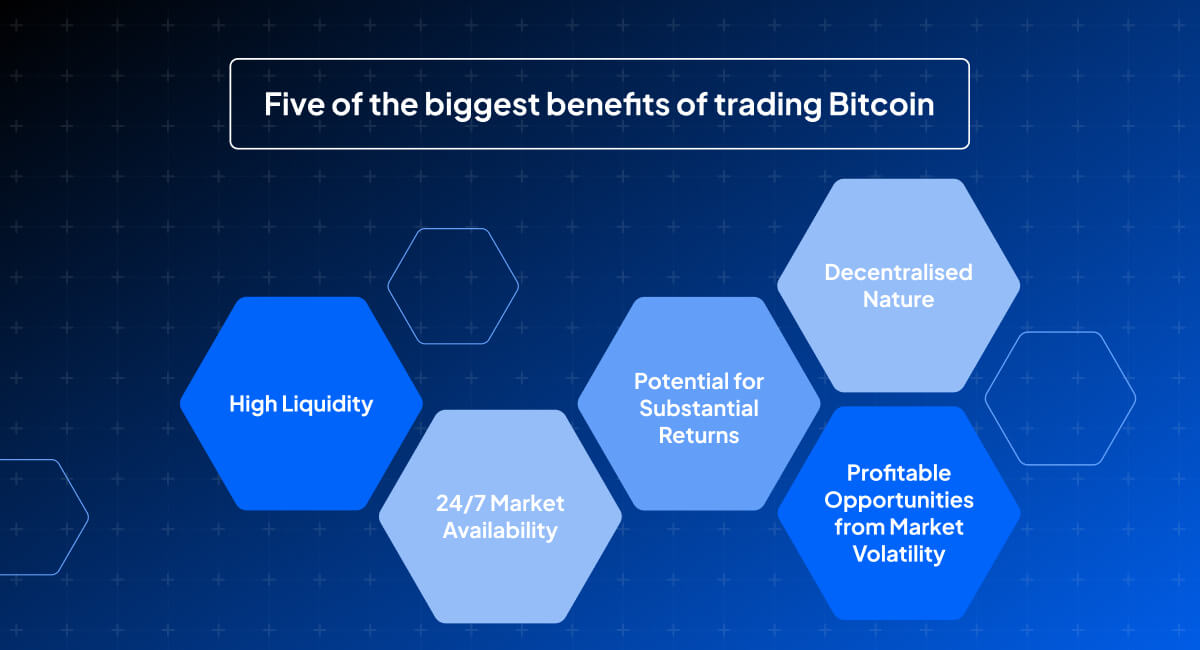
- High Liquidity: Bitcoin can be quickly bought or sold, making it an attractive option for traders seeking to enter or exit positions with ease.
- 24/7 Market Availability: The Bitcoin market is open 24 hours a day, 7 days a week, allowing for trading at any time, regardless of time zone.
- Potential for Substantial Returns: The significant price fluctuations in the crypto market offer opportunities for high returns.
- Profitable Opportunities from Market Volatility: The volatility of the crypto market can result in numerous profitable trading opportunities.
- Decentralised Nature: Bitcoin's decentralisation provides a degree of independence from traditional financial systems, which can be appealing for traders looking to diversify.
What are the risks of trading Bitcoin?
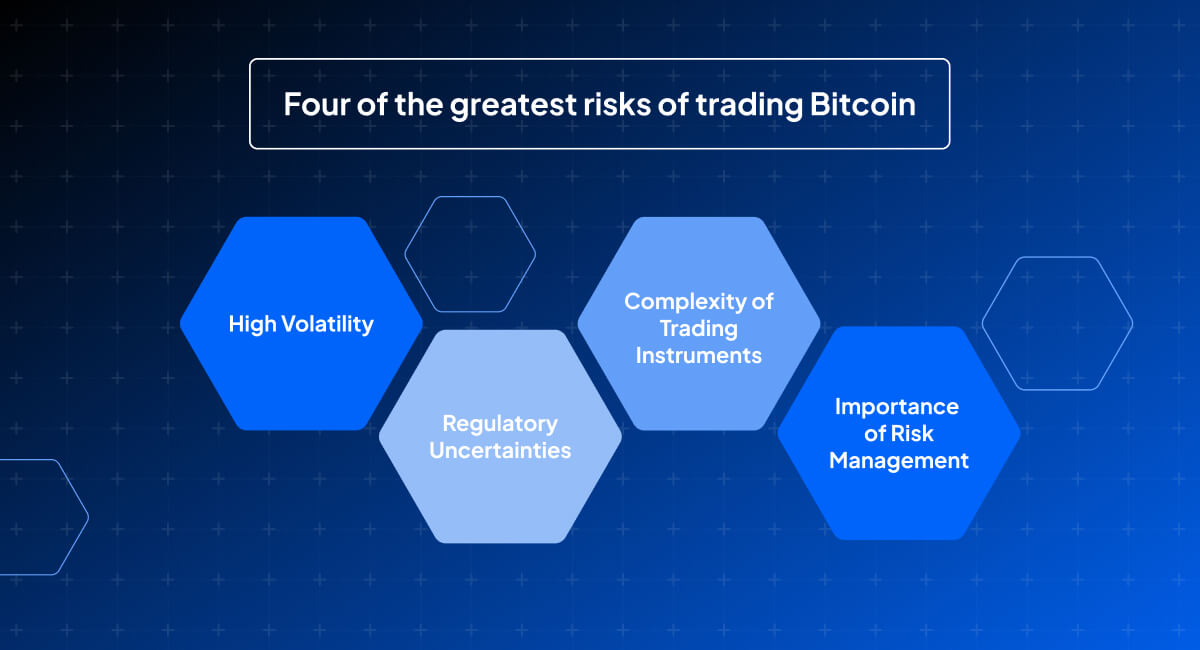
- High Volatility: Bitcoin prices can fluctuate dramatically, leading to significant gains or losses. This volatility is a primary risk for traders.
- Regulatory Uncertainties: The lack of consistent regulation in some markets can expose traders to fraud or market manipulation issues.Regulatory changes can also impact the market unpredictably.
- Complexity of Trading Instruments: For those new to trading, instruments like CFDs (Contracts for Difference) can be complex.Using leverage without proper experience or understanding can significantly increase overall risk levels.
- Importance of Risk Management: It is crucial to be prepared for rapid market changes. Having solid risk-management strategies in place is essential before starting to trade Bitcoin.
What is Bitcoin CFD?
A Bitcoin CFD (contract for difference) is a financial derivative that lets traders speculate on Bitcoin’s price movements without owning the actual asset. When trading CFDs with brokers like Pepperstone, you can take advantage of both rising and falling markets.
CFDs also offer leverage, enabling traders to control larger positions with a smaller amount of capital. However, it is important to be familiar with the risks involved, as leverage can amplify both gains and losses.
Overall, trading Bitcoin CFDs can be a flexible and efficient way to navigate the volatile Bitcoin market.
Cryptocurrency FAQs
What is Bitcoin?
Bitcoin is a decentralised digital currency that operates on a peer-to-peer network. Users can send and receive payments without the need for a central authority. It was created by an unknown person or group of people using the pseudonym Satoshi Nakamoto in 2009.
Why trade Bitcoin?
Many traders believe Bitcoin is a profitable endeavour thanks to its high volatility. It’s also a way to diversify from more traditional financial assets and can be traded 24/7.
How much will 1 Bitcoin be worth in 2030?
The future value of Bitcoin is highly speculative and it’s dependent on factors like uptake, regulatory developments and of course market demand. Predictions vary widely, with some experts forecasting substantial increases and others predicting a decline.
What is Bitcoin mining?
Bitcoin mining is the process of validating and adding new transactions to the blockchain. Miners use powerful computers to solve complex mathematical problems, which earns them Bitcoin as a reward. This process also secures the network and maintains the integrity of transactions.
What are Bitcoin trading pairs?
Bitcoin trading pairs are combinations of Bitcoin and other cryptocurrency (or fiat currency). For example, BTC/USD is the trading pair of Bitcoin and US Dollar. Trading pairs are what traders use to speculate on the relative value of Bitcoin against other currencies.
How do I track Bitcoin prices?
You can easily track Bitcoin prices by creating a Pepperstone account and using the online platform or Pepperstone Trading App, which provides real-time price data, charts and market analysis tools. Staying updated with market movements and news is crucial for successful trading.
What is Bitcoin halving?
Bitcoin halving is an event that happens approximately every four years. It reduces the block reward for miners by half. This mechanism controls the supply of Bitcoin and can impact its price by creating more scarcity. The most recent halving event was in April 2024 – four years after the previous (and third) halving in May 2020. The next Bitcoin halving event is projected to occur around April 20, 2028.
The material provided here has not been prepared in accordance with legal requirements designed to promote the independence of investment research and as such is considered to be a marketing communication. Whilst it is not subject to any prohibition on dealing ahead of the dissemination of investment research we will not seek to take any advantage before providing it to our clients.
Pepperstone doesn’t represent that the material provided here is accurate, current or complete, and therefore shouldn’t be relied upon as such. The information, whether from a third party or not, isn’t to be considered as a recommendation; or an offer to buy or sell; or the solicitation of an offer to buy or sell any security, financial product or instrument; or to participate in any particular trading strategy. It does not take into account readers’ financial situation or investment objectives. We advise any readers of this content to seek their own advice. Without the approval of Pepperstone, reproduction or redistribution of this information isn’t permitted.