- English
- Italiano
- Español
- Français
Macro trends and talking points
- Where is the bottom in risk (namely equity markets)? After a 3.7% rally in the NAS100 on Friday (US500 +2.4%), the market asks has this got further legs? With US 5y5y inflation swaps pushing back to the top of its range at 2.8%, Crude is above $110, the USD sits at multi-year highs and the equity markets pricing a 50-60% chance of a recession, it’s clear we’re at a make-or-break stage, so this week could be huge
- There is a belief we could feasibly see a short-term calming before another leg lower with a greater degree of panic involved – after five consecutive weeks lower, this move, while painful, has been orderly and consider the Fed have guided that a further deterioration in financial conditions may be needed
- The market is desperate to hear comments from a core Fed official (Powell, Williams, Brainard) that if financial conditions tighten too dramatically that it could threaten its objectives - in which case the Fed will ease back on QT – this could set off a sustained rally. Are we getting any close to this point? Feels like we’ll need to see another leg lower in risk and the VIX above 45% for the Fed to throw down the put
- Will we start hearing of money managers seeing signs of ‘value’ and fund flow data highlights evidence of inflows into equity funds? With the US equity risk premium (ERP) at 5.5%, I am not sure we’re there yet
- Can EURUSD break the 2017 low of 1.0341?
- Eyes on China this week, notably around covid trends amid further rounds of mass testing - will the PBoC finally deliver on what the market wants?
- Will we see a further unwind of the long commodity, short JPY trade? Some are watching the CNYJPY cross for guidance here, as it correlates nicely with a broad suite of commodities
- Will the Musk Twitter bid unravel?
- More crypto craziness? Aside from some idiosyncratic issues, Crypto remains a high beta play on tech and will keep an eye on reserves on the liability side of the Fed’s balance sheet.
Interest rate matrix
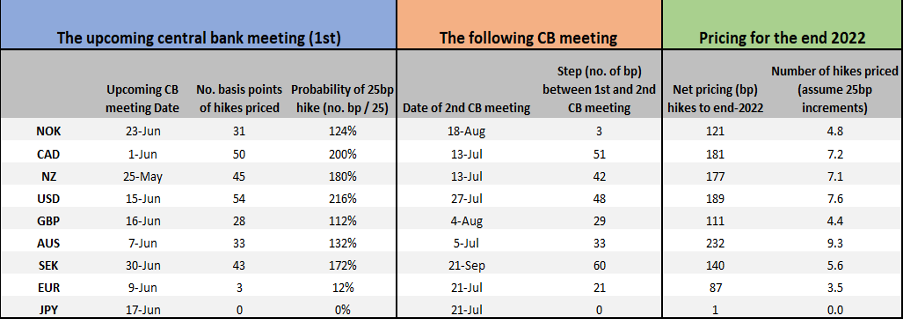
This portrays market pricing (expectations) for the next central bank meeting – the step (in basis points) from the next meeting to the second, and number of hikes priced for the full-year.

(Source: Pepperstone - Past performance is not indicative of future performance.)
Key event risks to navigate
- China – 1-Year Medium-term Lending facility (Monday 11:20 AEST) – will this be cut from 2.85%? The consensus suggests it won’t, but it’s a line-ball call
- Why does this matter? - The market wants to see more aggressive monetary policy stimulus and given Chinese authorities have recently suggested growth is a growing priority it feels the risk is that the MLF is cut by 10bp to 2.75% - could we see a more bullish trend in the CN50 and CHINAH if this plays out?
- China - Industrial production, fixed asset investment, retail sales (all Monday 12:00 AEST) – I suspect this data flow gets less airtime than the two rates’ decisions, but clearly, the risks are we see some big declines in April, notably retail sales
- China – 1- & 5-year prime rate (Friday 11:15 AEST)
- Again, I see the prime rate easing modestly to 3.65% and 4.60% respectively – the market will be disappointed if we don’t see easing, so this could be one for those trading the CN50, CHINAH, HK50 and USDCNH
- Australia – Q2 wage Price Index (Wed 11:30 AEST)
- The market expects this to rise to 2.5% (from 2.3%) – Wages are trending higher and should justify the recent hawkish pivot from the RBA. As you see in the rates matrix, the market prices 33bp of hikes for the June RBA meeting, so a hot number should see that move above 35bp and the AUD a buy vs the NZD. A number below 2.3% YoY would be a surprise and should see a more pronounced move lower in the AUD
- Australia - April jobs report (Thur 11:30 AEST)
- Unless we see a major miss, the jobs report should not be a lasting vol driver, especially given its coming in the wake of the Q2 wage data – The market expects 30k jobs to have been created in April, and a slight tick down to 3.9% on the U/E rate driven by a 66.4% participation rate
- 9 Fed speakers – Williams, Bullard, Harker *2, Kashkari *2, Powell (at a WSJ live event), Mester, Evans
- US – April retails sales
(Tues 22:30 AEST) – the market eyes +1% gain in advanced sales, with the control group expected to increase +0.8% - with all the talk of recessions consider the Atlanta fed Q2 GDP nowcast model is running at 1.8%
- UK - April jobs report
(Tues 16:00 AEST) - claimant count, jobless claim change, earnings, unemployment
- UK – April CPI (Wed 18:00 AEST) – the market consensus is positioned for inflation to rise to 9.1% (from 7%) and 6.2% on core CPI
- The market expects a super-hot number here, modestly above the MPC’s May forecast, but then the view is the YoY change should subside. GBPUSD is tracking equity markets as a risk proxy, but if taking a view on how the data effects rates pricing, trading vs the AUD or EUR may be a better way to go
- BoE speakers – Bailey, Ramsden, Haskel, Saunders, Cunliffe and Pill – Pill should be the pick of the speakers (Fri 17:30 AEST) for the market to key off, especially in the wake of the CPI read
- Canada – April CPI – the market eyes 6.6% (from 6.7%)
- With 50bp of hikes priced for the June meeting, a big miss/beat could impact the CAD. CADJPY looks interesting, with a bounce off the 200-day MA – further upside in the equity bear market rally could lift CADJPY
- Eurozone – I’d look most closely at the raft of ECB speakers due this week, and May consumer confidence (Sat 00:00 AEST)
- Japan – National CPI (Friday 09:30 AEST)
- The market expects headline CPI to rise to 2.5% from 1.2% and core (ex-food and energy) to rise to 0.7% (from -0.7%) – core looks like the more important reading, as the headline print will be impacted by base effects from mobile phone charge dropping out of the calculation. Not sure how influential this will be on the JPY though, as the JPY seems to have reverted to being a full risk proxy – i.e. equity lower, the JPY rallies (and vice versa).
Volatility matrix
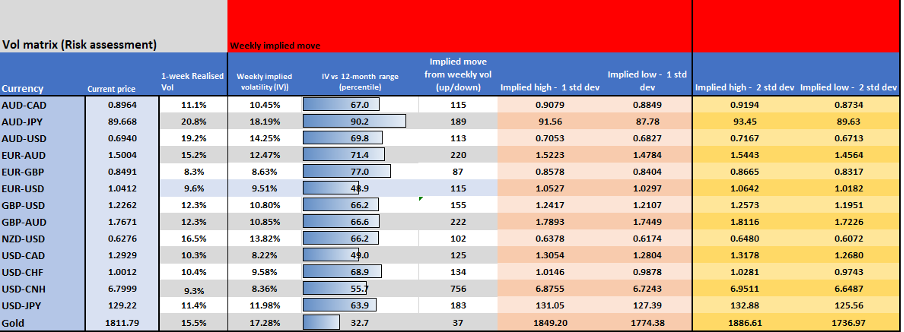
Given the data flow above and the moves in price we've seen of late, we can use the options market to understand the expected movement priced into the volatility markets. Using the weekly ‘straddle’ price we can project the implied/breakeven move onto spot and see the expected range on the week with a 68.2% and 95% level of confidence. If we look at markets as a series of probabilities or distribution of outcomes, these can offer guidance in that assessment. This can help with mean reversion and our risk process.

(Source: Pepperstone - Past performance is not indicative of future performance.)
Ready to trade?
It's quick and easy to get started. Apply in minutes with our simple application process.
The material provided here has not been prepared in accordance with legal requirements designed to promote the independence of investment research and as such is considered to be a marketing communication. Whilst it is not subject to any prohibition on dealing ahead of the dissemination of investment research we will not seek to take any advantage before providing it to our clients.
Pepperstone doesn’t represent that the material provided here is accurate, current or complete, and therefore shouldn’t be relied upon as such. The information, whether from a third party or not, isn’t to be considered as a recommendation; or an offer to buy or sell; or the solicitation of an offer to buy or sell any security, financial product or instrument; or to participate in any particular trading strategy. It does not take into account readers’ financial situation or investment objectives. We advise any readers of this content to seek their own advice. Without the approval of Pepperstone, reproduction or redistribution of this information isn’t permitted.


