Trader thoughts - scanning our markets for movement

There's been a good defence of key levels in Crypto. Here’s my video on Crypto yesterday which may interest. There's been solid buying in the NAS100, which has moved to a more bullish structure, as per my movement matrix.
We’re looking for alignment in the three variables. For a bullish read, I want price to be above the 5 & 20-day EMA, central pivot point and the RSI >60 and vice versa (<40 on the RSI).
Recall this matrix is not a systematic strategy, it's designed to scan for what's moving higher and lower, and therefore to help align my understanding around the flow of capital – it's based on the daily timeframe, so gives a high-level perspective of recent trends. I can drill down into the 1-hour or lower. For those interested, I built this using Excel RTD Smart Trader Tool on MT4.
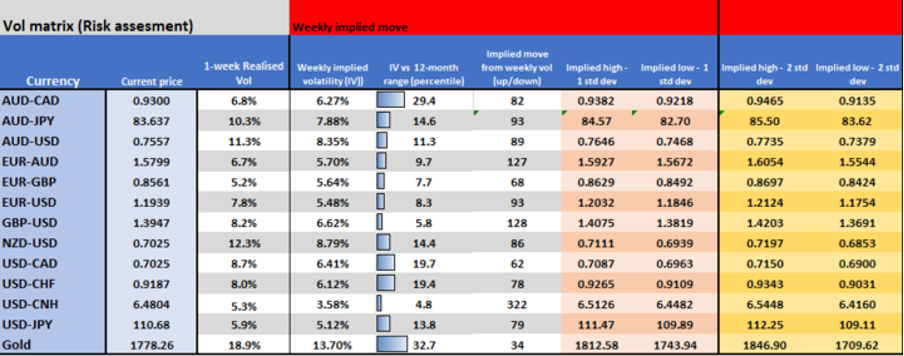
For a greater understanding of movement in our core FX markets and Gold, I’ve looked at 1-week options implied volatility (IV) – implied vol is driven by the pricing of options, but it tells us the expected move in pips (up or down) over this timeframe. The IV level represents an annualised standard deviation number – so by dividing by 7.2 we can understand the weekly implied move.
I use it for risk purposes and a way of defining movement which can help with position sizing – similar to the ATR which you can find on MT4/5 or cTrader. But, it can be used for mean reversion too – similar to Bollinger Bands or Keltner Bands.
Equity scans
Switching focus we’ve just significantly increased our range of stocks across the US, Australia, Germany and UK, so do take a look if you trade equities – long or short.
I’ve set up a series of scans to help identify movement – which is really what CFD trading is all about – finding what's hot or not and either going with the flow or looking for mean reversion. We can scalp, swing or cut our craft whichever way, but for me, CFD trading is to be involved with movement.
Here are a few scans (there's about 12) I have picked out today, but if clients see value in these I can run these more often in the Daily or do a separate equity-specific report.
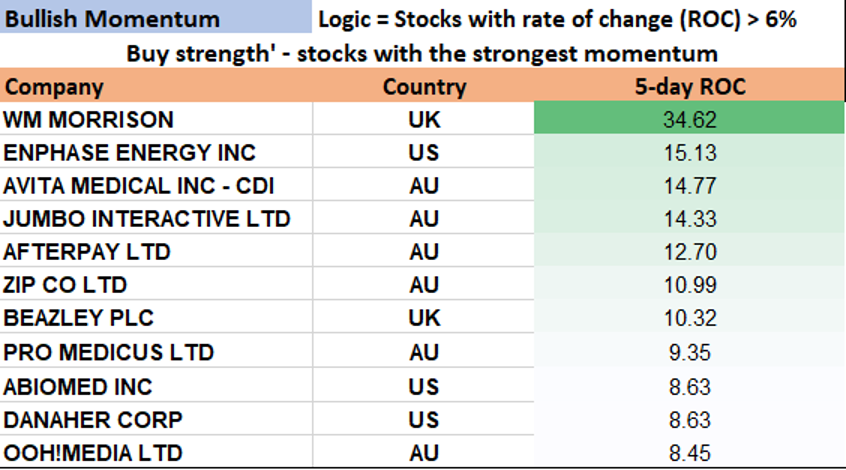
Rate of change (ROC) is arguably the best momentum tool going. This is a simple scan for stocks that have the highest 5-day ROC from our universe of stocks. Past performance doesn’t signal future results of course, but for those who subscribe to the view that a body in motion stays in motion, these names can be on the radar, and we revert straight to the charts.
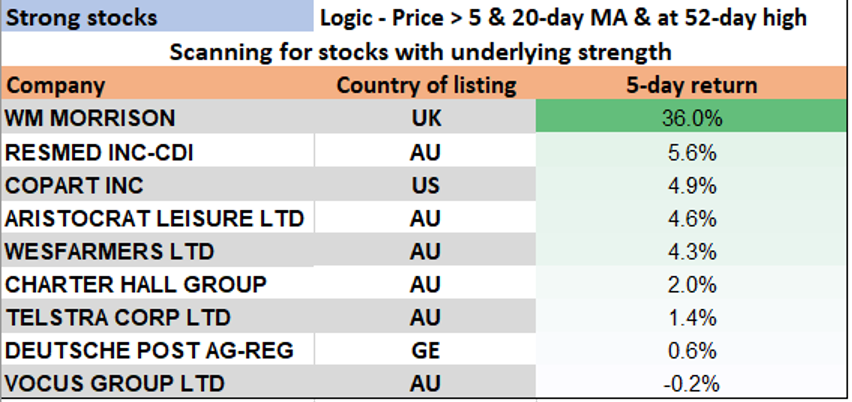
Strong stocks - Scanning for stocks that trade above the 5- and 20-day MA, and where price is at, or 0.5% away, from a 52-week high. Again, similar to the ROC scan, it tells me what’s trending and where real momentum holds true. Some will see these as levels to initiate short, but personally, I like to buy strong…the idea though is to identify movement.
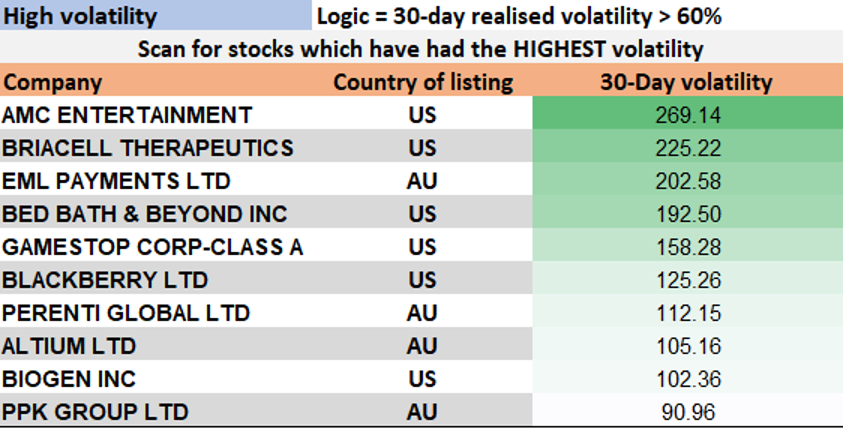
Going on pure statistical movement, I’ve scanned for the stocks with the highest 30-day realised volatility. Probably wont surprise that these include the meme names.
Related articles


The material provided here has not been prepared in accordance with legal requirements designed to promote the independence of investment research and as such is considered to be a marketing communication. Whilst it is not subject to any prohibition on dealing ahead of the dissemination of investment research we will not seek to take any advantage before providing it to our clients.
Pepperstone doesn’t represent that the material provided here is accurate, current or complete, and therefore shouldn’t be relied upon as such. The information, whether from a third party or not, isn’t to be considered as a recommendation; or an offer to buy or sell; or the solicitation of an offer to buy or sell any security, financial product or instrument; or to participate in any particular trading strategy. It does not take into account readers’ financial situation or investment objectives. We advise any readers of this content to seek their own advice. Without the approval of Pepperstone, reproduction or redistribution of this information isn’t permitted.