- English
- Italiano
- Español
- Français
- English
- Italiano
- Español
- Français
.jpg?height=93&quality=100)
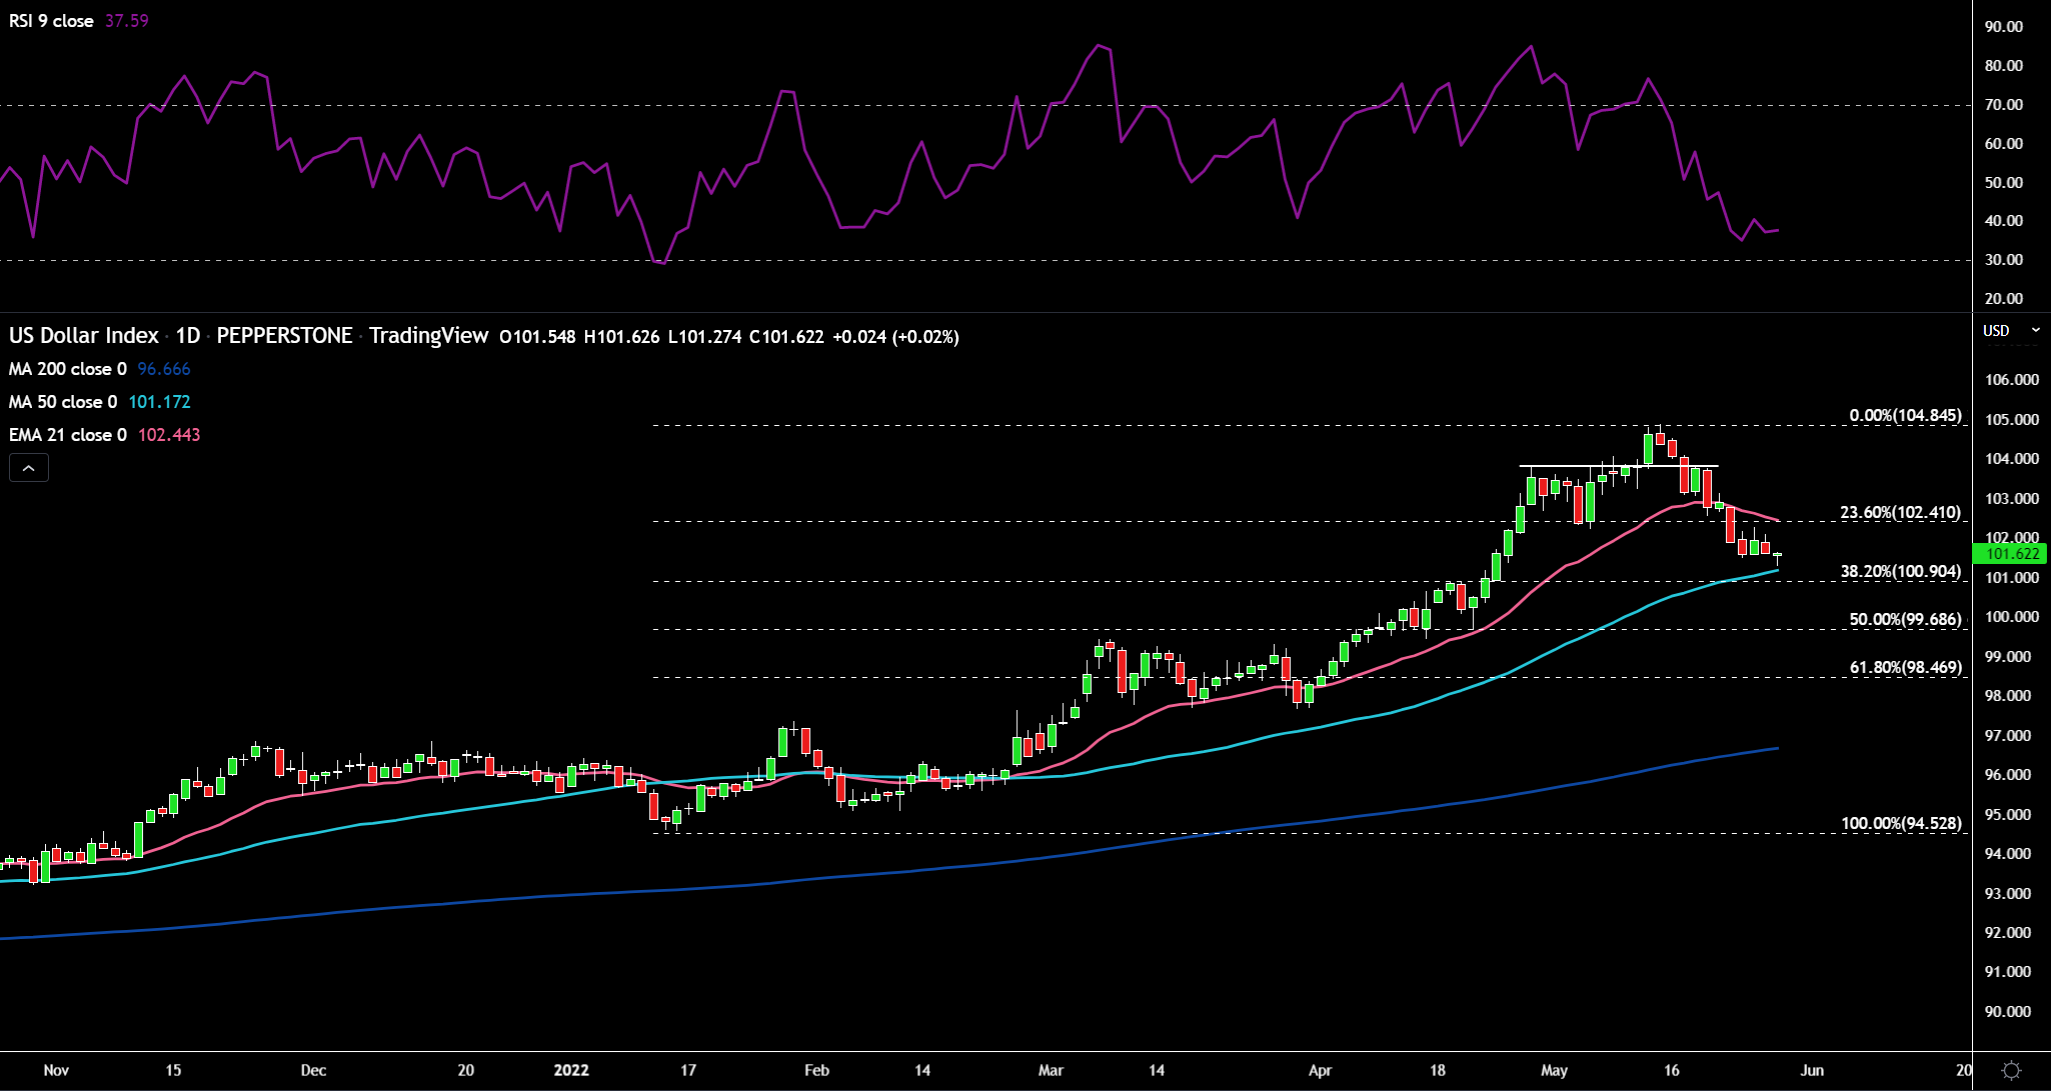
Dollar Index (DXY):
Monday saw a drubbing of the dollar as typical risk sentiment measures were flashing the green light – bitcoin, S&P500 and AUDJPY. This was off the back of President Biden’s announcement that the removal of Trump’s tariffs on China are under consideration. Tuesday was not much better for the greenback with a confluence of bearish factors such as weaker than consensus PMI data (employment and prices are still robust, but growth continues to deteriorate), US new home sales collapsing by 16.6% MoM and rate expectations as well as 2-year and 10-year yields falling by at least 10bps. Wednesday saw risk sentiment sour and dollar longs come back in for a nibble. Durable goods orders in the afternoon missed expectations by 0.2% points, which saw the 10-year yield decline to its 50-day SMA. This also saw a touch of brief dollar selling.
The appreciation on Wednesday could have been down to strong month-end buying flows. Major investment bank models point to robust USD demand as asset managers rebalance portfolios, increasing their US equity allocations due to relative weakness in US equity markets. This despite rate expectations continuing to be priced out. The other day we saw the odds of a 50bps rate hike in September slip, now even July no longer prices in a 50bps hike. Terminal rate expectations have also declined from circa 3.2% to around 2.88%. Are we seeing the beginning of peak hawkishness being repriced lower?
The Fed minutes out on Wednesday evening came out on the lower end of the hawkish spectrum. The main takeaways were as follows 1) Some believed that inflation may be starting to peak 2) Most see 50bps hikes at the next couple of meetings as appropriate 3) Monetary policy should be moved expeditiously to neutral, with a restrictive stance potentially appropriate too 4) An assessment of further adjustments to policy could be looked at later this year (pause in hiking cycle?) 5) Minor concerns regarding the affect on liquidity and broader financial conditions with QT. Do we see three 50bps hikes into September then a pause?
The 2nd estimate of GDP data indicated a larger slowdown in the US economy than expected (-1.5% vs -1.3% exp and -1.4% prev). Jobless claims rolled over a touch from its previous 218k as it printed at 210k. The trend is what will be important here with one dip in the data not enough to change the direction of travel. Pending home sales declined by 3.9% MoM, almost 2x the expected 2%. This is the 6th consecutive monthly drop. The Fed’s preferred inflation metric is set to print later today with a core PCE figure of 4.9% YoY expected (decline on last month’s number of 5.2%) and 0.3% MoM. A shock to the upside could reignite hawkish pricing and give the dollar a boost into the weekend.
(Source: Tradingview - Past performance is not indicative of future performance.)
Price remains tenuously above the 50-day SMA as market wait for the PCE data. The RSI hovers near to oversold territory. The 102.2 low has now turned into resistance. A break of the 50-day SMA and 38.2% Fibonacci level would spell bad news for the bulls.
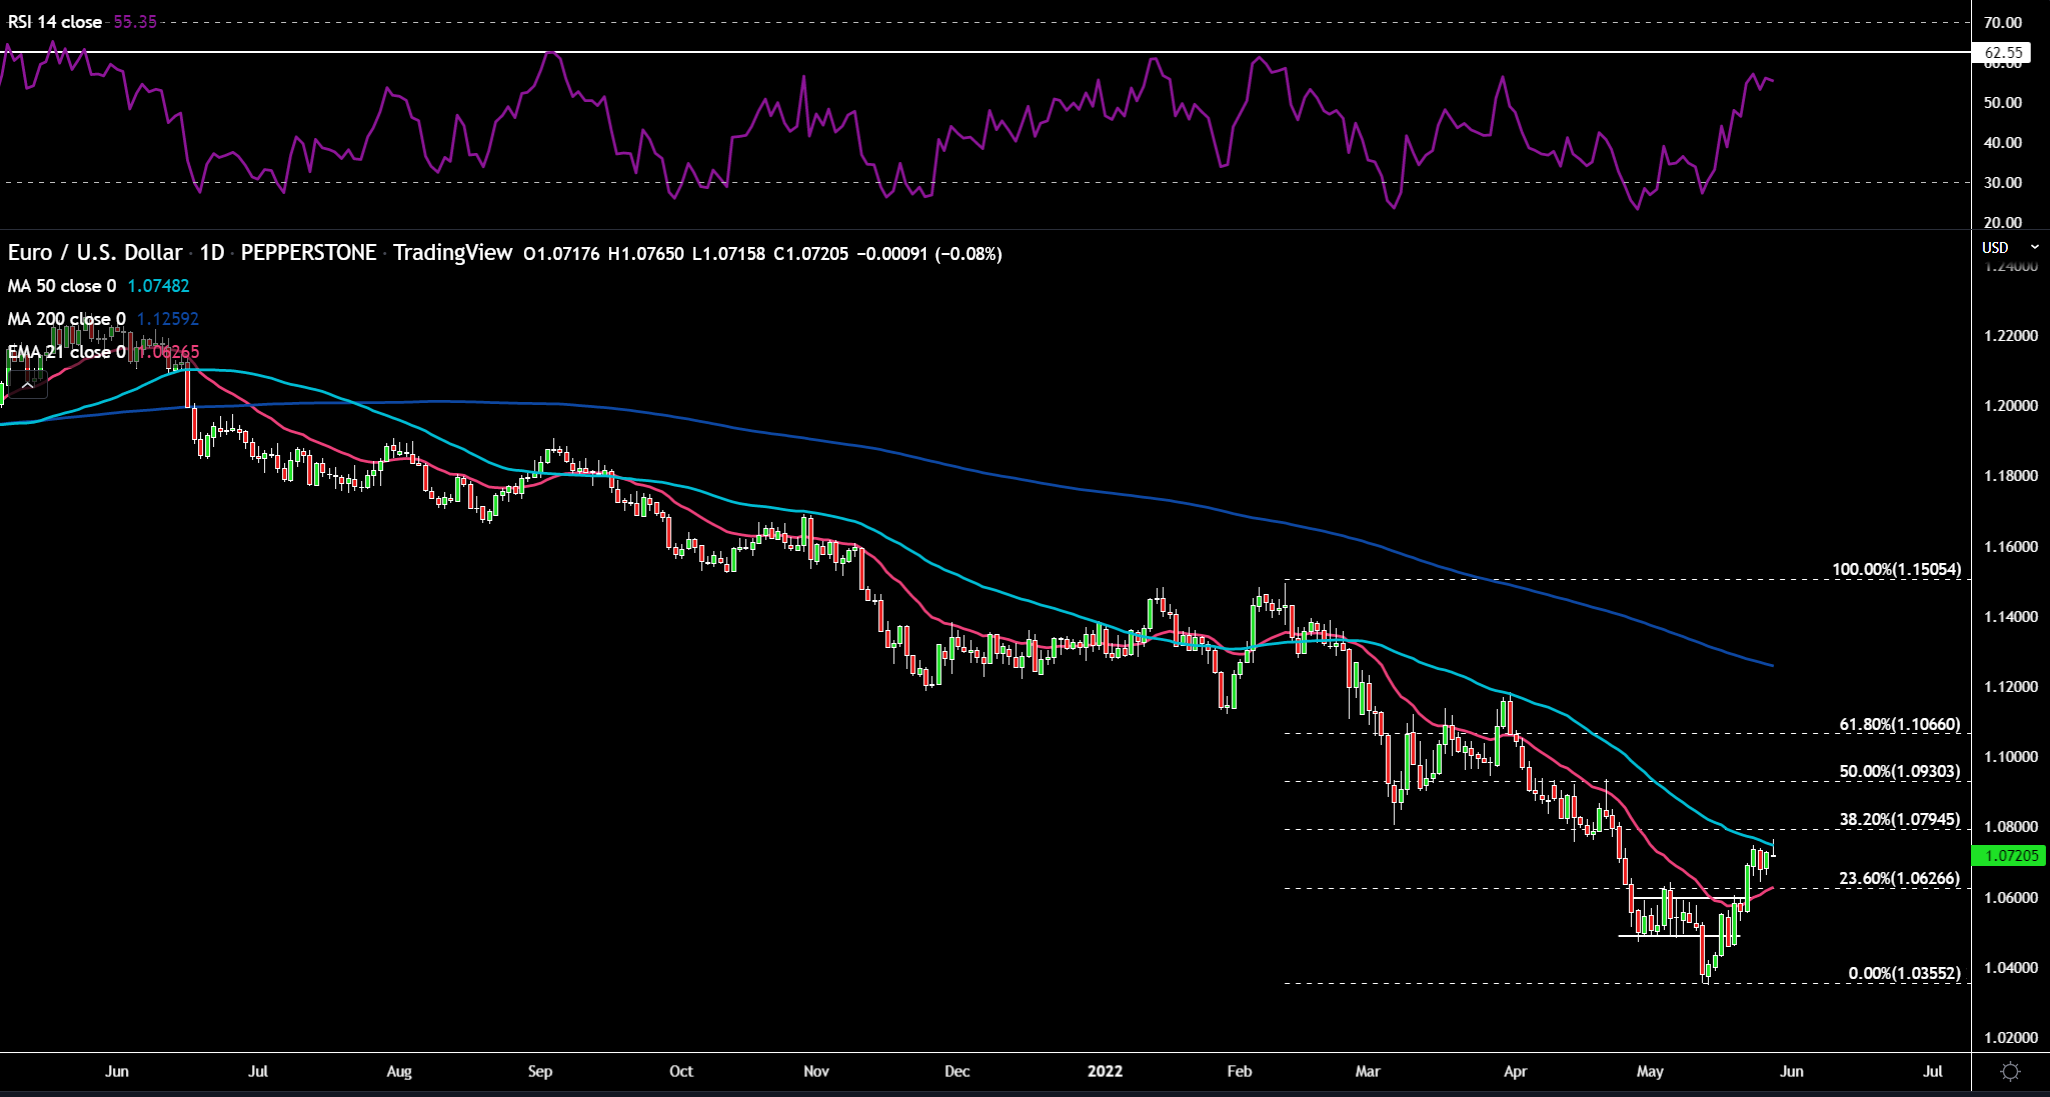
EURUSD:
The beginning of the week was very positive for the euro as a blog post from ECB President Lagarde provided firm rate guidance for the first time. She wrote that they’re likely to be in a position to exit negative rates by the end of Q3. This would mean two 25bps hikes at the July and September meetings. Bund yields across the curve repriced higher and the spread between 2-year German and US bonds narrowed helping the EURUSD surge higher. Visibility in the short term is clear, but beyond that we have “gradualism and flexibility”. This positivity spilled over into Tuesday when 3 GC members (albeit on the hawkish side of the spectrum) raised the spectre of 50bps hikes. Lagarde also backed up her blog post with commentary about being at a turning point and that she currently doesn’t see a recession across the euro area.
Additionally, the resiliency of growth within the eurozone PMI numbers added fuel to the bullish euro fire. Wednesday saw the euro give back all of its gains on Tuesday as sellers arrived in numbers with no specific catalyst, however, German yields fell more than the US and risk sentiment hit the skids. German wages excluding one-off payments have increased to 2% for Q1 2022 vs 1.6% in Q4 2021. The ECB will be keeping a close eye on this. STIRs are pricing in north of circa 32bps for the July meeting, which means a slight chance of a 50bps hike is creeping in. We’ll hear from Chief Economist Lane around lunch time today.
(Source: Tradingview - Past performance is not indicative of future performance.)
Price ran into a wall at the 50-day SMA and this could be the level to break through to keep the bullish momentum in place. The 38.2% Fibonacci level is just above there too. Support would likely come in at the 23.6% Fib level and the 21-day EMA around the 1.06 level. The RSI is not far away from the 62.55 level, which marked previous price peaks.
GBPUSD:
Similarly to the euro, the pound had a great start to the week as cyclical currencies were in vogue. Bailey’s speech didn’t really provide any ammunition for bears or bulls. Tuesday was horrific for sterling. PMI data fell off a cliff. This paragraph from the HIS’s Chief Economist sums it up - “The survey data therefore point to the economy almost grinding to a halt as inflationary pressure rises to unprecedented levels.” Gilts slumped, especially the 2-year tenure. Additionally, to add to the bearish sentiment Ofgem, the UK’s energy regulator, announced that it predicts the price cap on energy will rise by 42% in October. The pound puked as a result. Wednesday’s Sue Gray report was a damp squib with not much fallout for Boris Johnson, yet cable was still lower as the dollar flexed its muscles.
Thursday brought some Brexit timeline news – on June 6 the UK Gov will introduce legislation allowing them to unilaterally disapply NI Protocol. We also had Rishi Sunak shaking the taxpayer’s money tree to open up the fiscal taps. The major policy changes were 1) Windfall tax of 25% on the profits of oil and gas (phased out when profits return to normal) 2) One-off £650 payment to around 8mln of the lowest income households 3) 8mln pensioners an extra payment of £300 4) Increased the energy bills discount from £200 to £400. These packages and others not mentioned bring the total support to £37bln (1.5% of GDP).

(Source: Tradingview - Past performance is not indicative of future performance.)
The long wick to the upside indicates some selling pressure is creeping into cable. The next major resistance level resides at 1.265 and 1.27 where the RSI would likely move towards the 60.44 level, which capped price rallies previously. 1.25 would be good to monitor on the downside for any retracements lower.
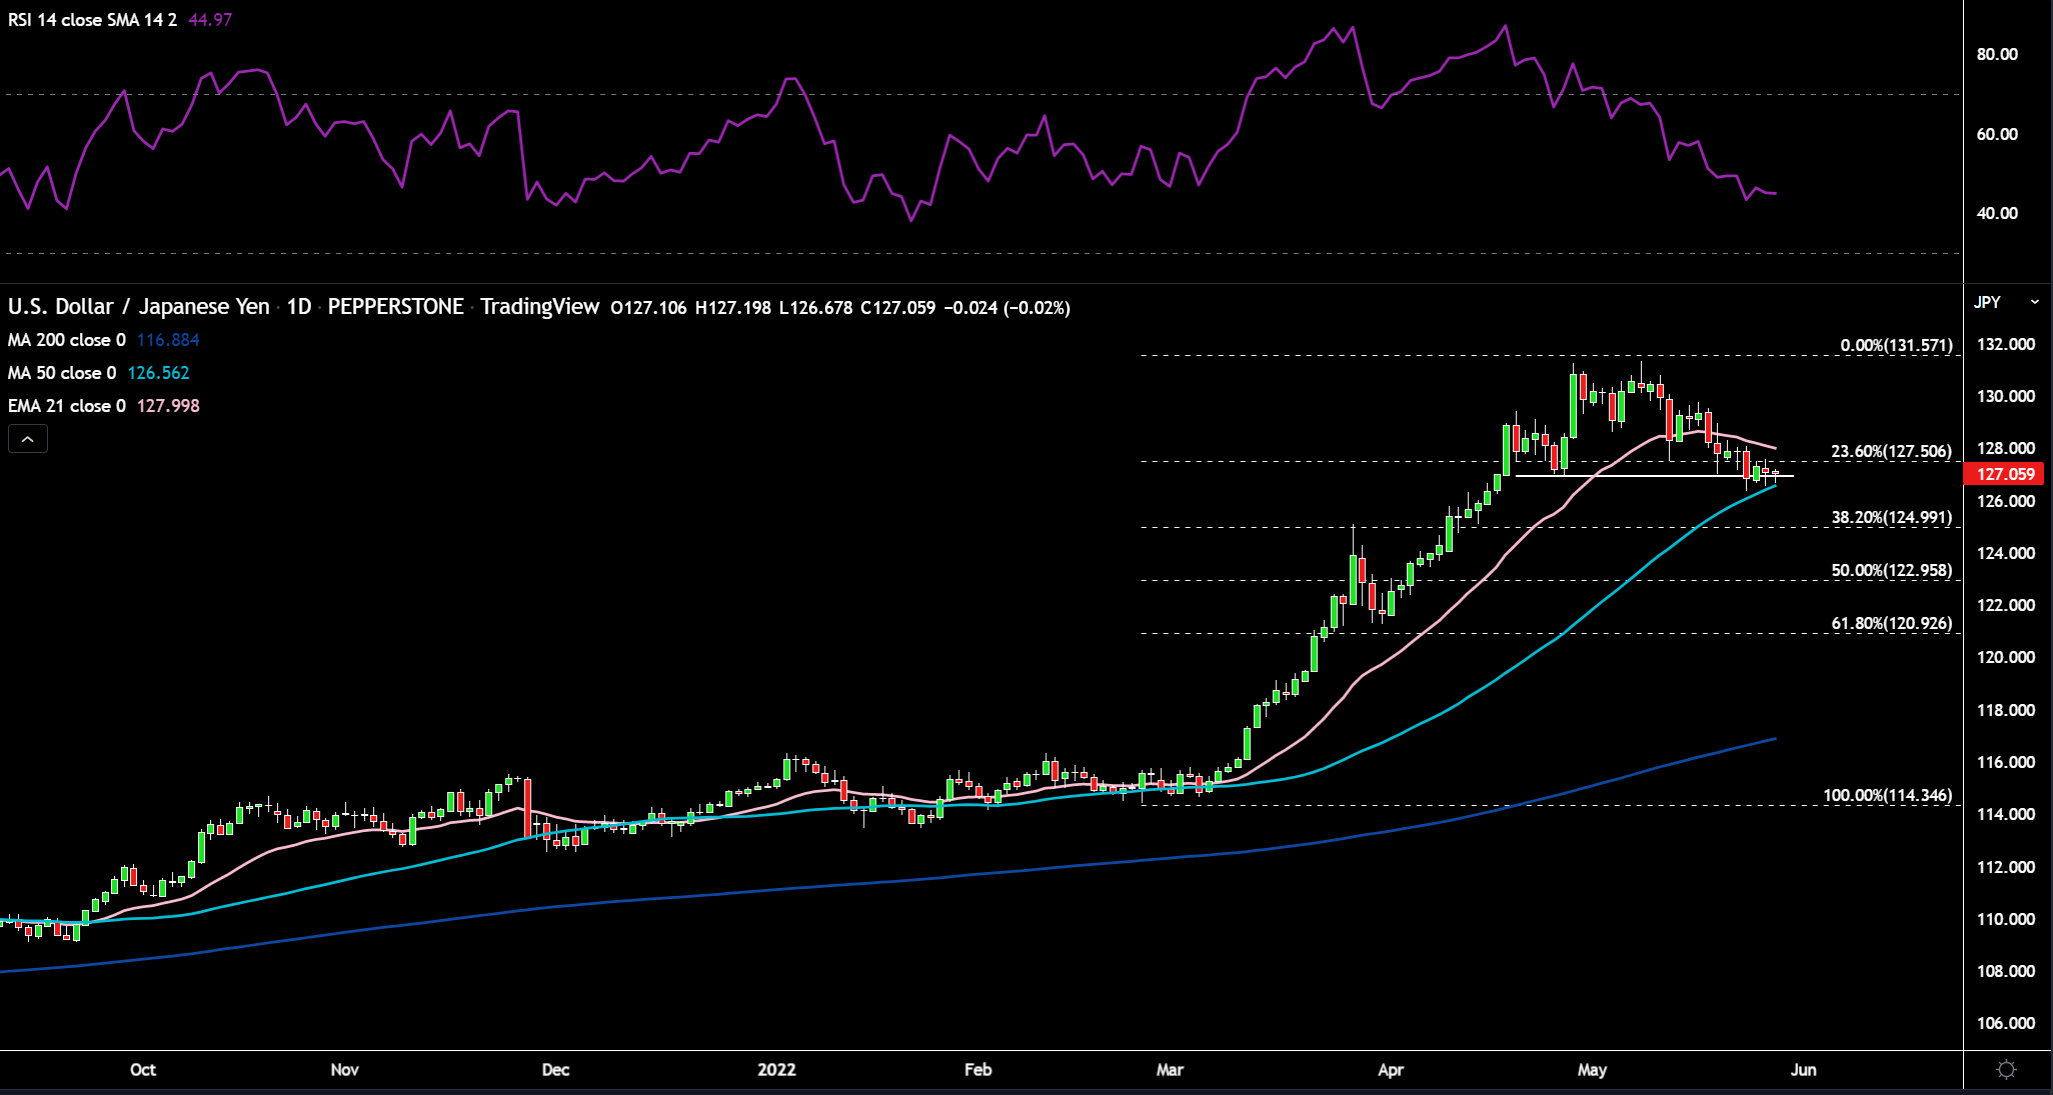
USDJPY:
The yen has been very quiet on the news front with Kuroda’s speech on Wednesday not injecting any volatility into the pair. There was some excitement for yen bulls on Tuesday when a key level of support at 127 was broken as US-yields slumped and risk sentiment weakened. On Thursday we did get a bit of excitement from Kuroda and strength in the yen when he stated the BOJ can execute a smooth exit from its ultra-loose monetary policy and that US yields rising would not necessarily keep the yen on the back foot. Additionally, government announced that border controls will be relaxed and foreign tourism allowed from June 10 onwards. This would improve Japan’s large current account deficit. PCE data could see some movement in JPY given the sensitivity to yields.
(Source: Tradingview - Past performance is not indicative of future performance.)
USDJPY is right on the 127 horizontal support level and just above the 50-day SMA. A break of that could definitely spark a short squeeze lower given the crowded short positioning. The RSI has been moving lower, but still has room to go before oversold concerns creep in. On the upside, 128 would likely act as resistance.
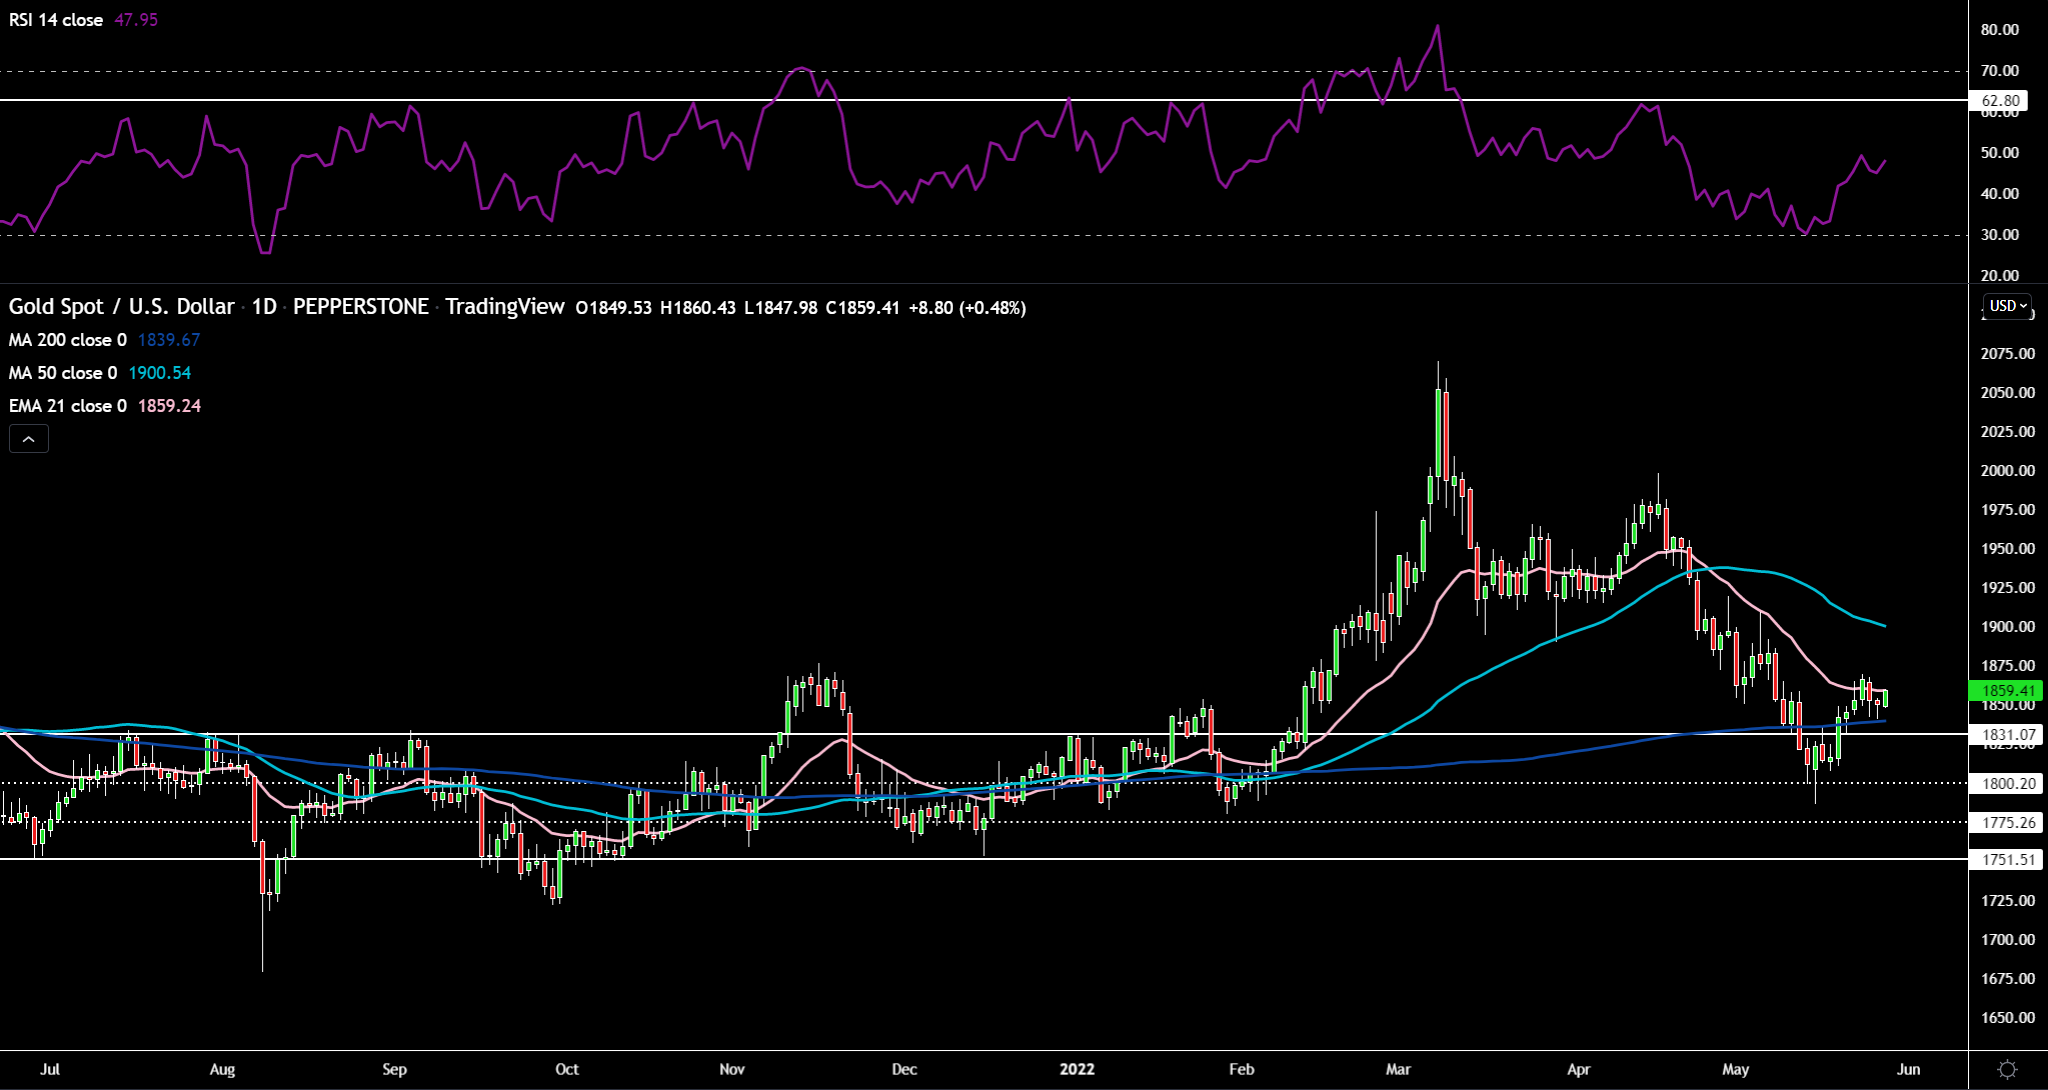
Gold:
The yellow metal had a decent start to the weak as recession fears crept back into markets, real yields declined and the dollar was offered. Wednesday saw higher real yields and a stronger green back which saw the yellow metal out of favour. Thursday was the opposite, but with the strong surge in equity markets risk-off assets such as gold would have likely seen outflows. Inflation data out later today could see some volatility in gold.
(Source: Tradingview - Past performance is not indicative of future performance.)
Gold remains well supported into the $1850 level and the 200-day SMA slightly below. $1870/5 seems to be attracting the sellers with price stalling around there. $1830 and the 200-day SMA will provide a bit of a floor for price.
Oil:
Oil news flow has been tepid with the only reports of significance being that the EU’s oil embargo on Russia remains at a stalemate as Hungary digs in. Crude remains in a tug of war between growth fears/risk-off and China’s ever developing covid policy. The IAEA is at a difficult juncture with Iran on unanswered questions regarding uranium. Prospects for the US Iran deal remain remote at present. The US envoy to Iran stated the situation is “tenuous”. US inventory data showed a more significant drawdown in stock levels than anticipated. Crude had a very good session yesterday as price surged through the $115 range resistance. Nothing in particular in terms of oil flow news, but a weaker dollar and a rebound in risk sentiment likely helped. Also six OPEC+ sources stated the June 2 meeting will see output raised by the standard 432k bpd.
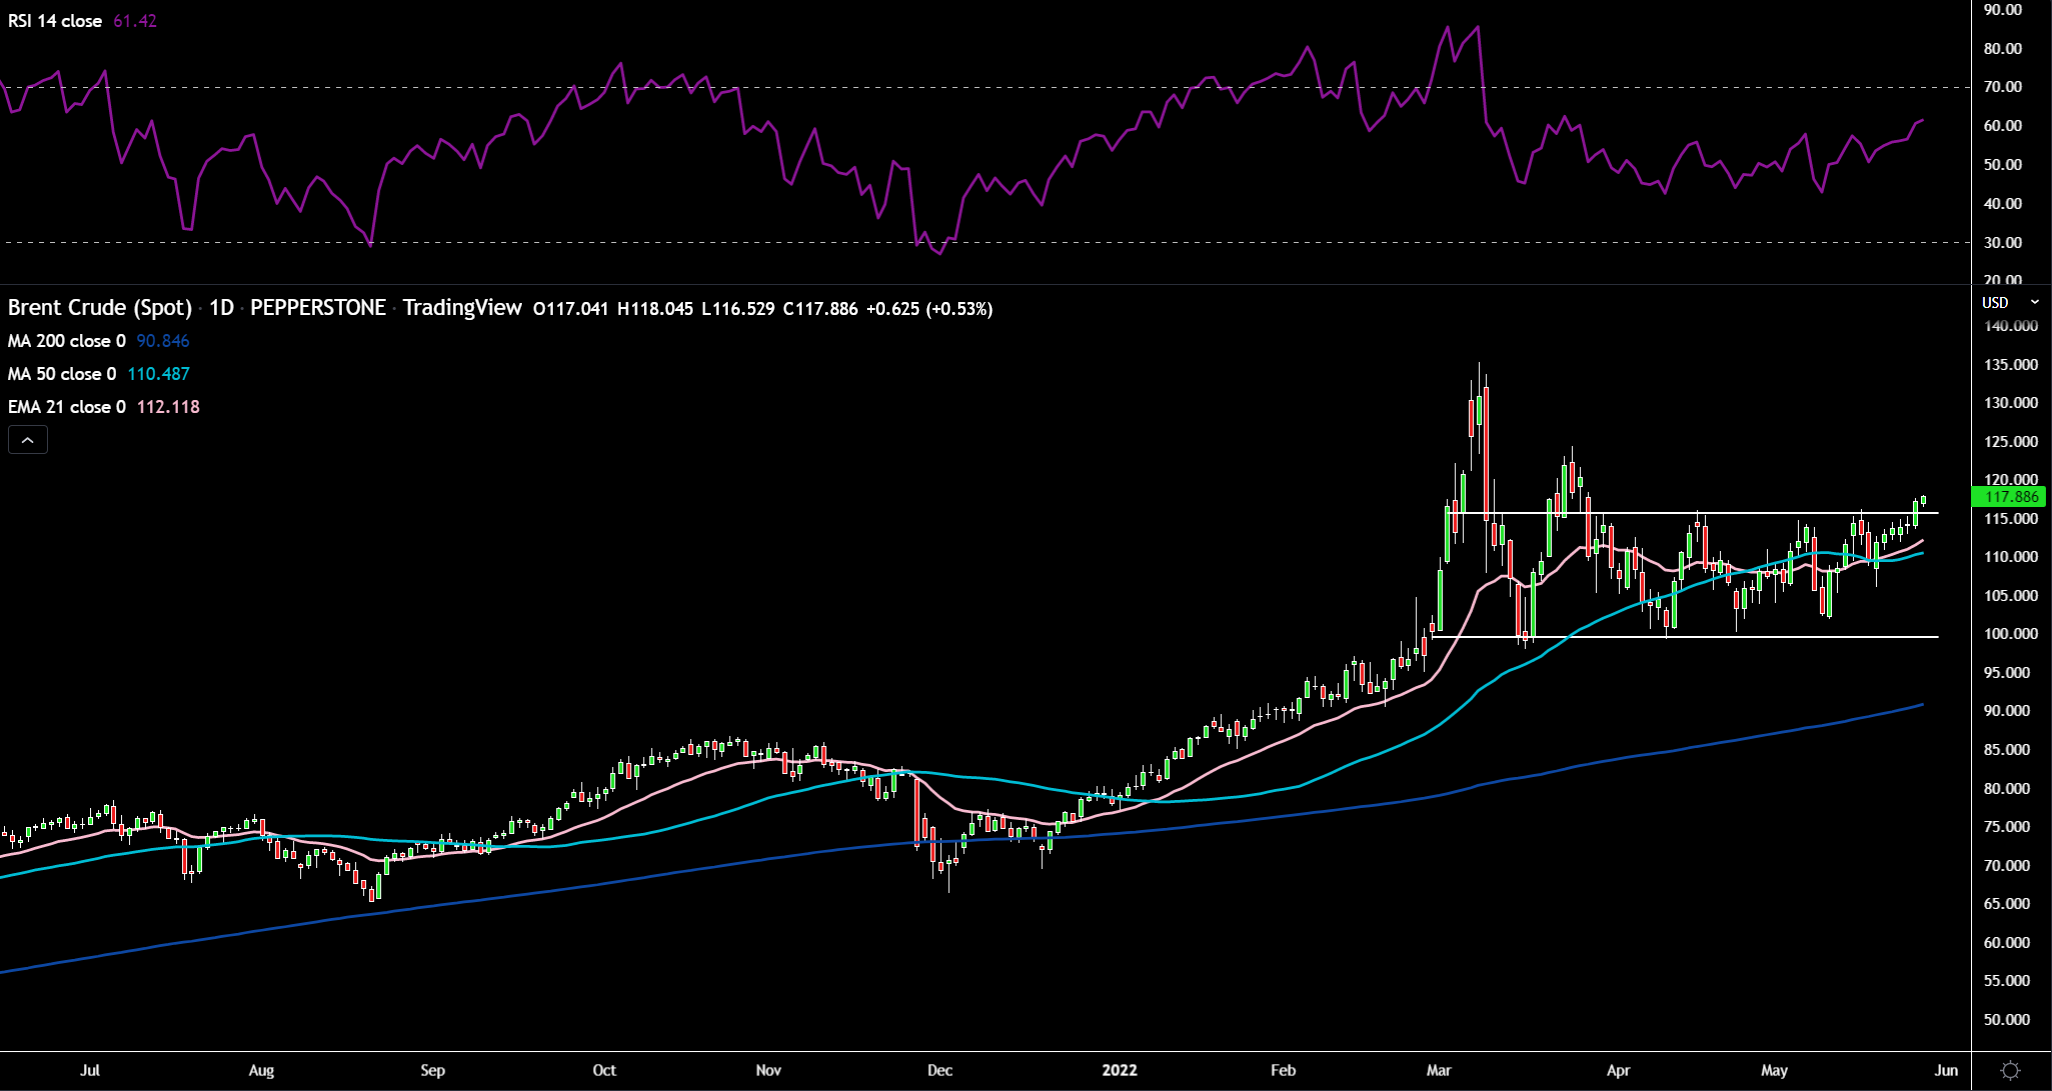
(Source: Tradingview - Past performance is not indicative of future performance.)
With crude having broken to the topside of its range resistance at $115, $120 now becomes the next score on the door. The RSI has about another 9 points before it hits overbought 70 readings. I think $115 could now act as support as well as the $110 50-day SMA area.
Related articles


Ready to trade?
It's quick and easy to get started. Apply in minutes with our simple application process.
The material provided here has not been prepared in accordance with legal requirements designed to promote the independence of investment research and as such is considered to be a marketing communication. Whilst it is not subject to any prohibition on dealing ahead of the dissemination of investment research we will not seek to take any advantage before providing it to our clients.
Pepperstone doesn’t represent that the material provided here is accurate, current or complete, and therefore shouldn’t be relied upon as such. The information, whether from a third party or not, isn’t to be considered as a recommendation; or an offer to buy or sell; or the solicitation of an offer to buy or sell any security, financial product or instrument; or to participate in any particular trading strategy. It does not take into account readers’ financial situation or investment objectives. We advise any readers of this content to seek their own advice. Without the approval of Pepperstone, reproduction or redistribution of this information isn’t permitted.