- English
- Italiano
- Español
- Français
- English
- Italiano
- Español
- Français
.jpg?height=93&quality=100)
Dollar Index (DXY):
The dollar has been rumbling along, close to flat post the NFP drift from last week. The bounce in equity markets mid-week, helped some high beta commodity currencies gain. Even the funding currencies such as the euro and yen was also up against the greenback. This was likely due to a pullback in US yields across the entire curve. Looking at the dollar’s price action post the inflation print, you’d think there was a big miss below expectations, not a decent beat and highest inflation print since 1982.
Headline YoY inflation came in at 7.5% (exp 7.3%) while core printed at 6% (exp 5.9%). MoM figures also came in with beats vs expectations. The monthly figures will be key going forward as unfavourable base effects begin to kick in as the year progresses. Inflation was broad based across a multitude of categories – this raised the risk of inflationary pressures becoming more entrenched. Bullard then dropped some zingers late Thursday, stating that he supports raising rates by a full percentage point by the start of July as well as favouring a 50bps hike. In terms of what this all meant for Fed rate hike expectations, the market is now pricing very close to a 100% chance of a 50bps hike in March, over 1% by July and close to 7 hikes by December 2022. Yet, the dollar has been like a rollercoaster, up and down instead of strengthening. In my opinion, it may have to do with the policy mistake narrative currently swirling around. This is evident from the 2s10s curve which has been aggressively flattening as well as swap curves for STIRs actually inverting (so rate cuts being seen down the line). There is now even talk of an intermeeting emergency hike. I think at a minimum QE should be ended, the Fed do seem to be behind the curve here and need to react fast. Maybe a shock emergency hike and end to QE will alleviate some of those fears.

(Source: Tradingview - Past performance is not indicative of future performance.)
The technicals are a bit messy to be honest. Price has sneaked above the trend line and horizontal resistance. The 50-day SMA is providing some pressure to further moves higher. The RSI is galloping higher but remains away from key inflection points. In terms of levels I’d be monitoring, on the upside – 96.5 and on the downside 95.5.
EURUSD:
The single currency was light on data, but heavy on ECB speakers this week. Kicking the schedule off was Christine Lagarde, the European Central Bank president, on Monday who tried to play down the market’s hawkish reaction from last week by stating any policy changes would be gradual and that she believed that elevated inflation was unlikely to become entrenched. Bank of France Governor Villeroy believes markets have over-reacted to last week’s ECB meeting. Markets are currently pricing in 50bps from the ECB by the end of this year. Schnabel one of the more prominent members within the governing council and considered fairly hawkish spoke in relation to the risks from higher energy prices de-anchoring inflation expectations. She knows that interest rates won’t do anything for energy price rises, but in order maintain their inflation credibility they would need to act against inflation expectations spiralling higher.
Some have even expressed doubts over the veracity of the models used by the ECB to forecast inflation. Philip Lane the Chief Economist defended his models and also spoke on Thursday. Once again, he believes the primary driver are bottlenecks which will eventually resolve in order to allow inflation to return to its trend without a need for a significant adjustment in monetary policy. He wants to avoid causing a supply and demand shock to the economy. The European Commission released new inflation forecasts on Thursday. They eurozone inflation hitting 3.5% over 2022 and then falling below the ECB’s 2% target to 1.7%. The 3.5% for 2022 is above the ECB’s latest forecasts from December at 3.2%. The BTP-Bund spread continues to climb higher. Which traditionally has not been a positive factor for the euro. Despite the hotter than expected US inflation number the EURUSD surged higher, but then retraced after Bullard’s commentary. Lagarde gave an interview to a German radio station overnight and turned on her dovish persona. In essence, the takeaways were – 1) raising rates wouldn’t solve the current problems associated with inflation 2) gradual move vs a sharp move as that could choke of the recovery 3) the eurozone economy is not the US and isn’t as strong 4) inflation being higher than 2% target in the medium term would need to see significant pressure in wages, which she says is not the case currently. Euro crosses are down as a result.
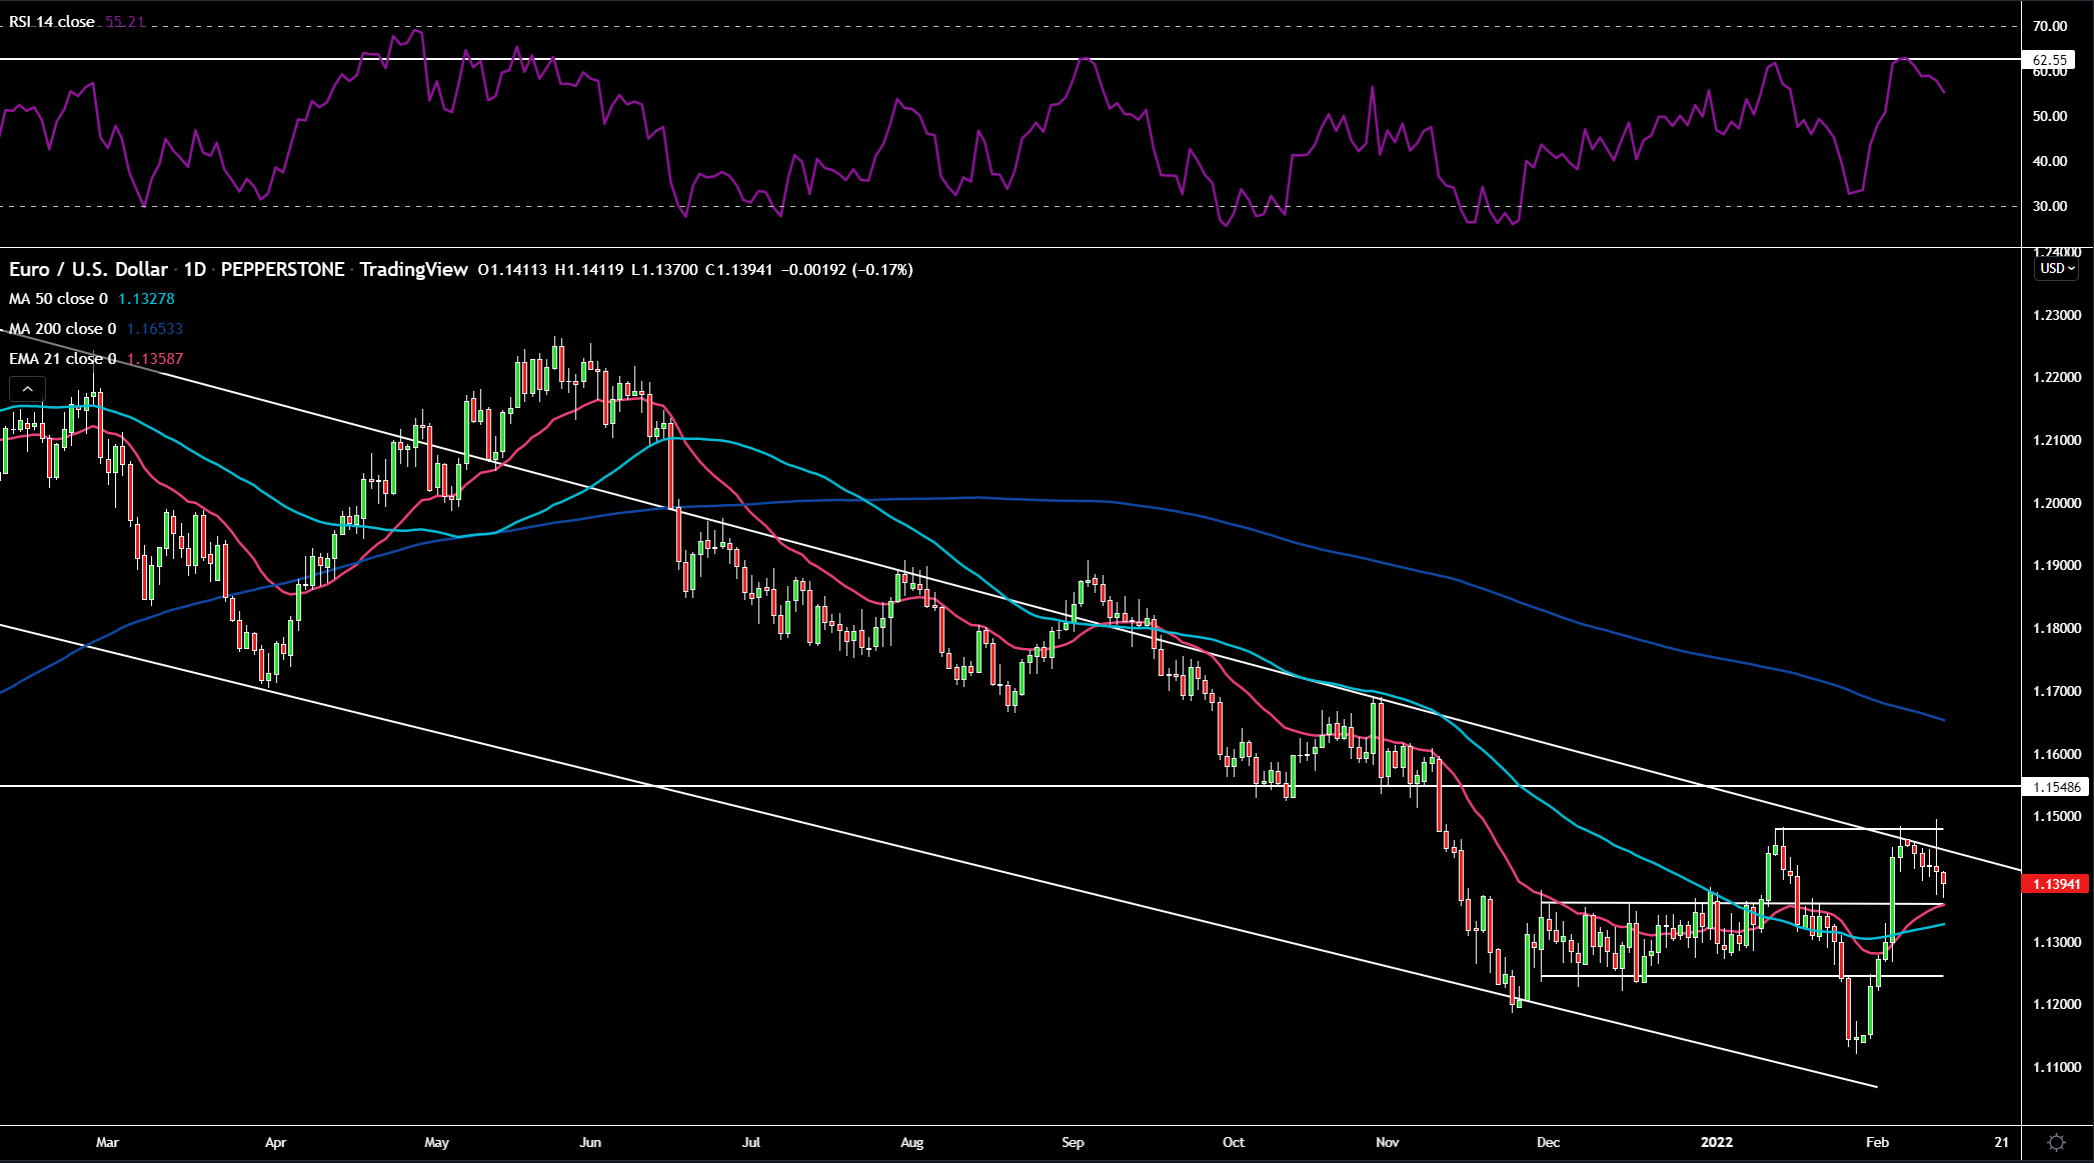
(Source: Tradingview - Past performance is not indicative of future performance.)
EURUSD seems to be rolling over after hitting multiple resistance levels in the form of the horizontal resistance at 1.15, the upper trend line of the descending channel and the RSI which rolled over from the 62.55 zone. Price is now coming close to the former range resistance around 1.135. With the 21-day EMA just below and the 50-day SMA not much further.
GBPUSD:
The biggest news out of the UK this week was with regards to the scrapping of Covid restrictions for England, which could occur a month earlier than originally anticipated on 24 February. This would mean no more self-isolating in the case of a positive test as the government prepares England for “living with Covid”. News flow on the NI Protocol remains light, with both the UK and EU likely not penning any agreement until the local May Elections have finished. There is chatter that Truss may offer the EU some fresh proposals to try and break the deadlock. We’ll hear on this later. We had the Bank of England’s Chief Economist Huw Pill on the wires yesterday who tried to row back some of the market’s aggressive rate pricing (currently 1.75% bank rate priced by end 2022). He believes a measured rather than activist approach is best, so a 50bps hike is clearly considered too large a step in his opinion. He also alluded to active sales of gilts not an automatic response to the bank rate hitting 1%. UK GDP data out Friday morning showed a smaller MoM decline than forecasted at -0.2% vs -0.6%. That brings GDP for 2021 to 7.5% (fastest since WW2). Did have a lower base to recover off though, which must be kept in mind. The UK economy has now recovered back to levels seen in February 2020.
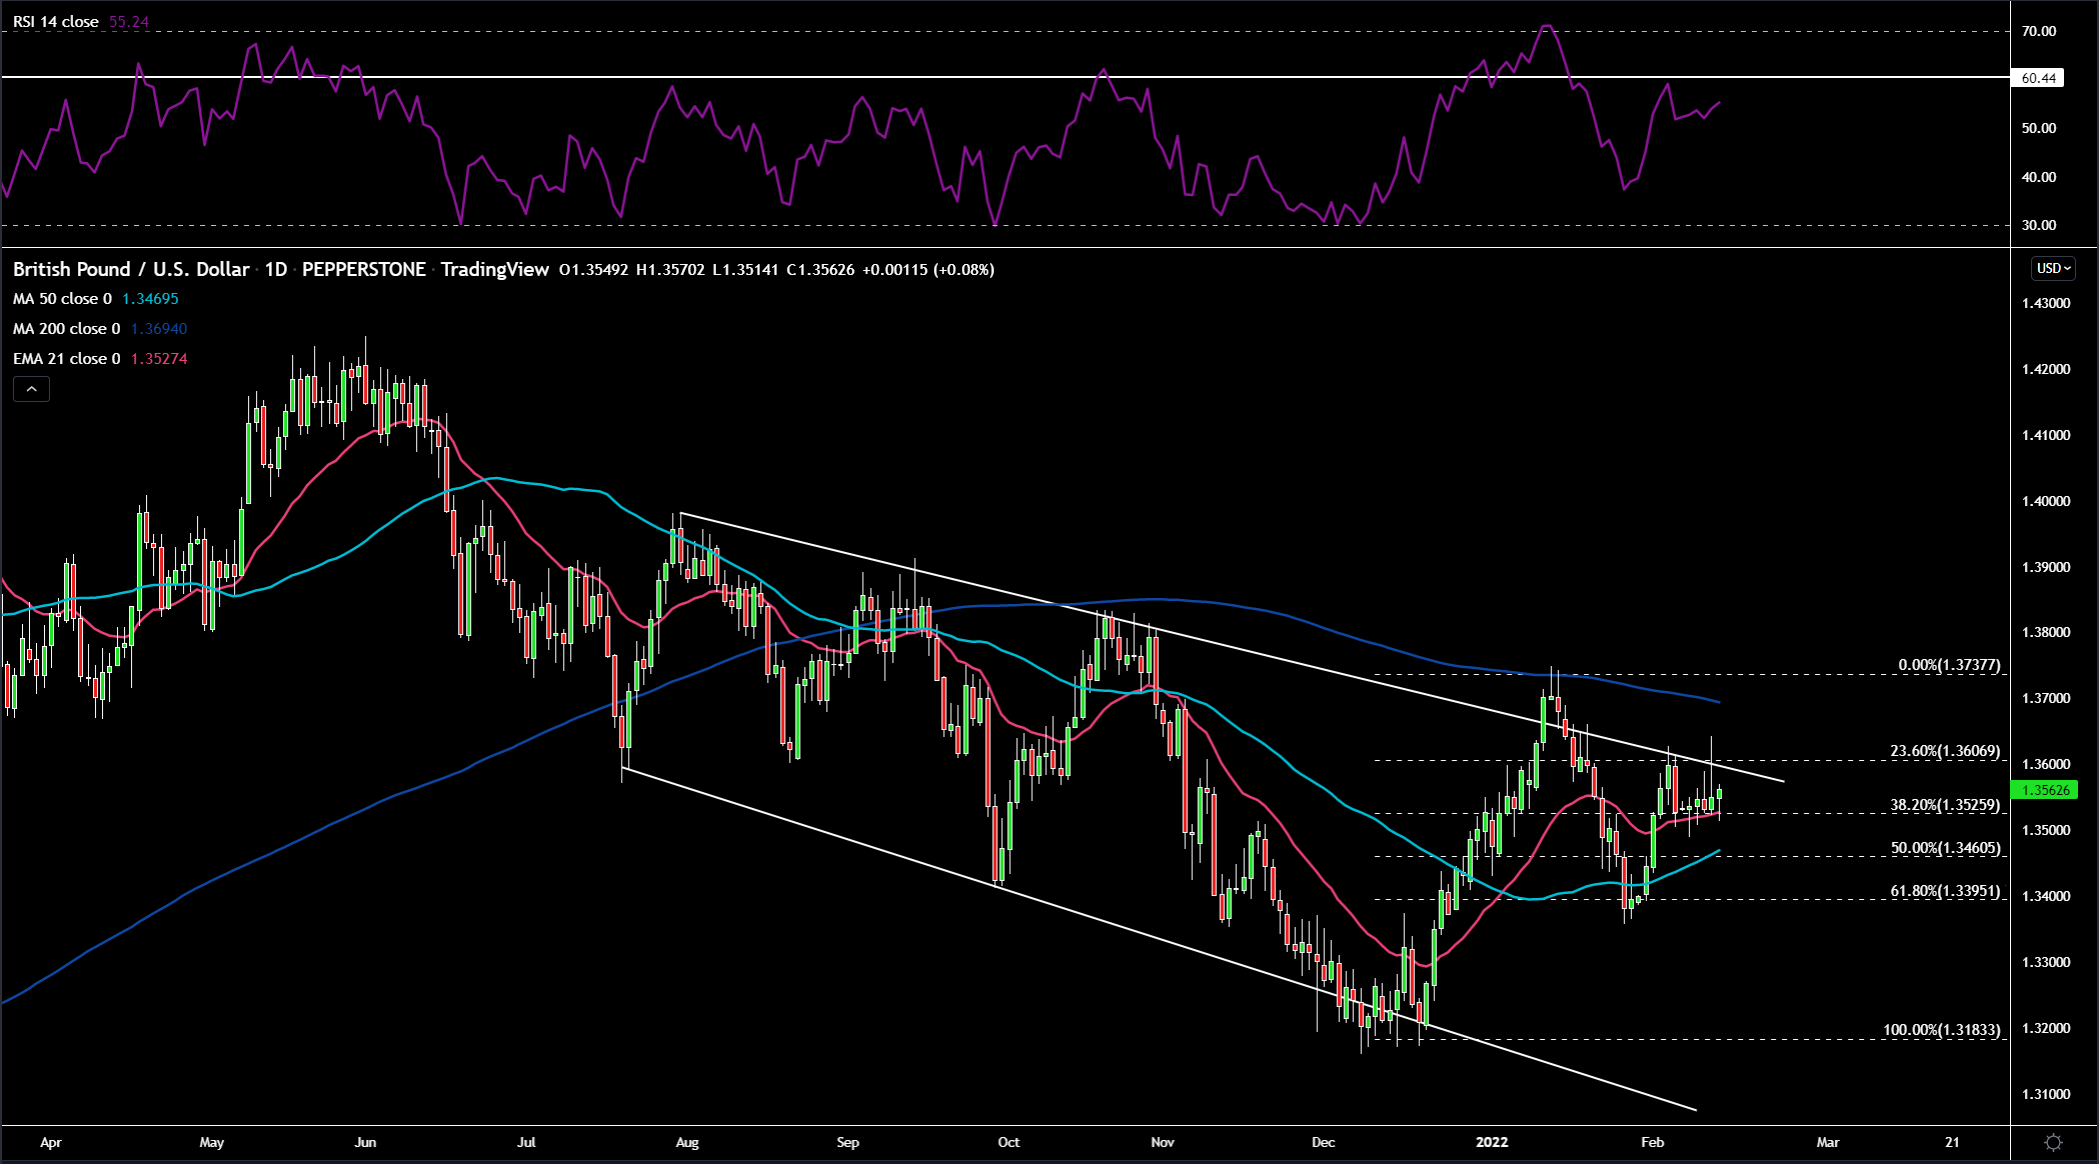
(Source: Tradingview - Past performance is not indicative of future performance.)
Cable has found support around the 38.2% Fibonacci level as well as the 21-day EMA. The RSI is getting close to another key area around 60. On the upside 1.36 would the first level to monitor, with further pushes higher opening up the 200-day SMA. On the downside, the 50% Fibonacci level and the 50-day SMA would be important.
USDJPY:
With better risk sentiment and higher US 10-year yields, the yen came under pressure – grinding higher. Kuroda BOJ’s Governor gave an interview this week where he illuminated that the BOJ are not engaging in any debate with regards to easy monetary policy and won’t during Kuroda’s tenure (ends April 2023). He believes given Japan’s price pressures it’s inappropriate. Weaker wage data out at the beginning of the week provides credence to this view. After the ECB’s hawkish pivot the yen now becomes the primary vehicle for carry trades.

(Source: Tradingview - Past performance is not indicative of future performance.)
It’s still early days and will require watching, but the flat-sided ascending triangle structure has broken to the upside with a projected target of 117.5. The RSI still has room to run too before overbought fears creep in. Could wait for a retest of breakout level with a stop just below the uptrend line (pink arrow). Or one could enter a position instead of waiting for the retest (as may not happen).
Gold:
Gold has been on an absolute tear this week. With real yields and the dollar contained there was nothing holding back the yellow metal. We could also have seen a modest bid prior to the US inflation print on a hotter than expected number. Despite real yields surging higher post the CPI number, gold has been doing well. Admittedly, the greenback is also quite weak which will certainly be helping gold. Looking at the policy mistake narrative as I alluded to under the dollar’s section, with rate cuts on the horizon according to swap curves, could this be providing a tailwind for the yellow metal?

(Source: Tradingview - Past performance is not indicative of future performance.)
Gold continues to hold near the $1830 level. The RSI got close to the 62.8 level, which has tended to stamp out further upside in price. I’ve drawn in a downtrend line from the highs seen last year. It would be around $1840 if price were to move to that area from its current position. On the downside, $1815 and $1800 (moving averages just above) would be important.
Crude Oil:
Better risk sentiment and a range bound dollar have helped keep crude on the front foot. Renewed talks between the US and Iran probably led to some of the weakness on Tuesday in crude as the US stated they see a deal in sight. The geopolitical risk premium is embedded in price too, emanating from drone strikes in the Middle East as well as unresolved Ukraine and Russia tensions. US inventory data showed a significant drawdown and was the first draw in 7 weeks. The supply and demand equation remains favourable for crude.

(Source: Tradingview - Past performance is not indicative of future performance.)
Crude continues to impress by its defensive nature. There is definitely some support around $90.5. The RSI dipped and has now turned around a touch back into overbought territory, but only very modestly. The 21-day EMA seems to be acting like a dynamic trend line for the price candles. Upside target would be previous high around $95.
Related articles

Ready to trade?
It's quick and easy to get started. Apply in minutes with our simple application process.
The material provided here has not been prepared in accordance with legal requirements designed to promote the independence of investment research and as such is considered to be a marketing communication. Whilst it is not subject to any prohibition on dealing ahead of the dissemination of investment research we will not seek to take any advantage before providing it to our clients.
Pepperstone doesn’t represent that the material provided here is accurate, current or complete, and therefore shouldn’t be relied upon as such. The information, whether from a third party or not, isn’t to be considered as a recommendation; or an offer to buy or sell; or the solicitation of an offer to buy or sell any security, financial product or instrument; or to participate in any particular trading strategy. It does not take into account readers’ financial situation or investment objectives. We advise any readers of this content to seek their own advice. Without the approval of Pepperstone, reproduction or redistribution of this information isn’t permitted.