CFDs are complex instruments and come with a high risk of losing money rapidly due to leverage. 72.2% of retail investor accounts lose money when trading CFDs with this provider. You should consider whether you understand how CFDs work and whether you can afford to take the high risk of losing your money.
- English
- Italiano
- Español
- Français
I always argue that financial markets, specifically equity and credit, are more a derivative of other factors, such as central bank liquidity, and flow from systematic players. Such as momentum and trend-following hedge funds (CTA’s for example). The introduction of retail traders, certainly in the support of US high growth equity names is also a key factor and while many dismiss these players, one just has to look at the average daily trades on platforms such as Robinhood, E-trade and TD Ameritrade; just incredible.
US Treasuries vs risk assets
One dynamic that is clear when we think of true disconnects is the message seen in risk and cyclical assets versus that of the US bond market.
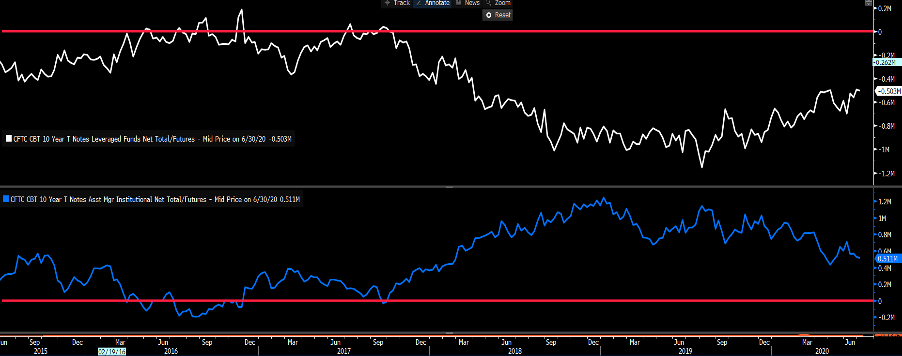
If we start by look at positioning in US Treasury (TY) futures, we see leveraged funds (top pane - white) running a net short by 503k contracts – these speculative players are betting on higher yields, although, as we see, this position has come well off the lows seen in August, where we saw 1.16m net short Treasury futures contracts. One suspects these traders are using weakness (high yields) to reduce their short position of late and this is keeping yields suppressed.
Asset managers (blue - pension and mutual funds for example) are long 511k TY futures and are therefore expecting lower yields, although funds have been reducing this extended long position. So leveraged funds are reducing a monster short, while buy-side funds are reducing a sizeable long Treasury futures exposure.
Source: Bloomberg
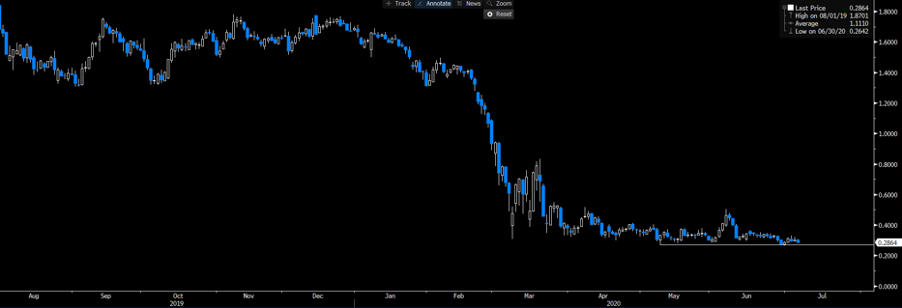
Certainly, the short TY trade would be hurting given the moves lower in yields of late, especially in 5yr Treasuries, where literally any sell-off (i.e. higher yields) has been pounced upon. It feels like the hedge fund short has further legs here and that should keep yields low.
Source: Bloomberg
Also, consider that US Treasuries are not just an income vehicle or a play on anticipated central bank action, but they have a strong function in corporate cash management. Where companies can pledge US bonds as collateral for repo - that being, getting access to short-term capital from banks to fund their business operations.
The Fed to do more?
We also know there is a liquidity argument that keeps yields from rising, and most funds understand that any protracted sell-off (higher yields) would just increase the probability that the Fed adopt yield curve control, similar to what the RBA is doing - fixing part of the curve at a specific level by buying unlimited amounts of bonds in the secondary markets.
So, there are some interesting dynamics brewing in both moves in price action, and positioning in bonds. However, deep down giving a worrying message on the outlook of the US and global economy and never really bought into the rebound seen in the economic data flow. Certainly, when we look at traditional correlations between bonds and other variables, we ask is one right and the other wrong, and if so, how does it reconcile itself. This is the real disconnect which should be discussed.
Let us compare the US 10-yr Treasury to a few variables which typically have a solid relationship:
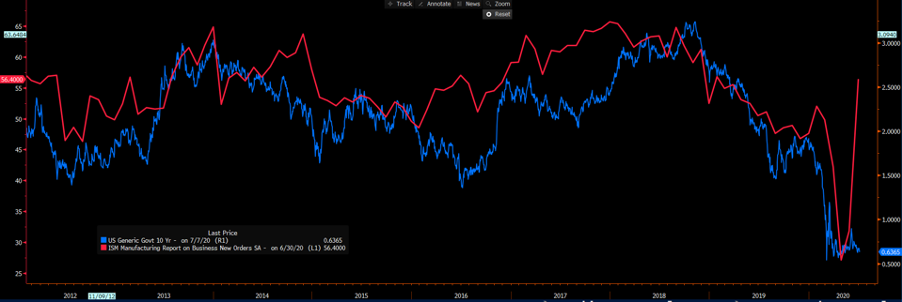
On the data side, we see the US 10’s (blue) vs the new orders sub-component of the US ISM manufacturing report.
Source: Bloomberg
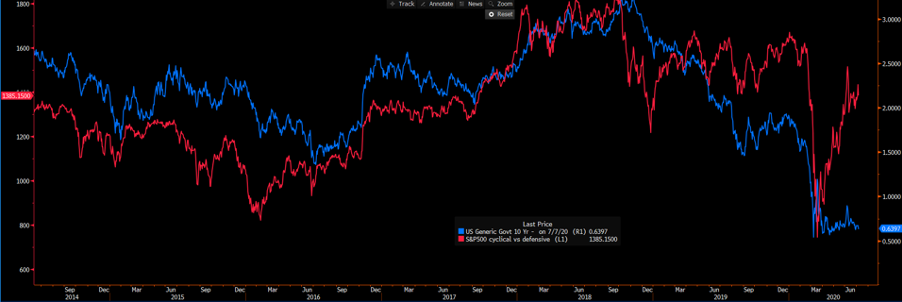
On the financial markets side - US 10s vs the S&P500 cyclical/defensive sector ratio. Cyclical stocks have pushed higher of late, but bonds are not buying whatever equities are seeing.
Source: Bloomberg
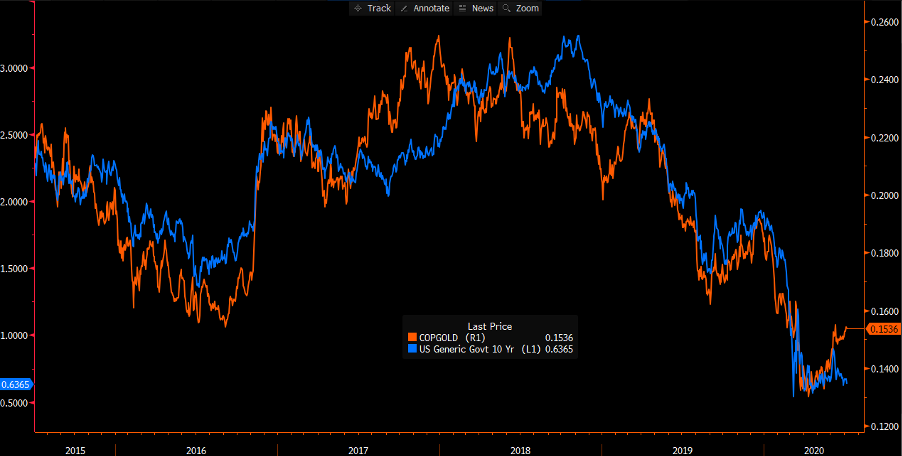
US 10s (blue) vs the copper/gold ratio – We have seen copper outperforming gold, which is generally a sign of economic improvement and higher inflation expectations. Is it time that we see gold outperform?
Source: Bloomberg
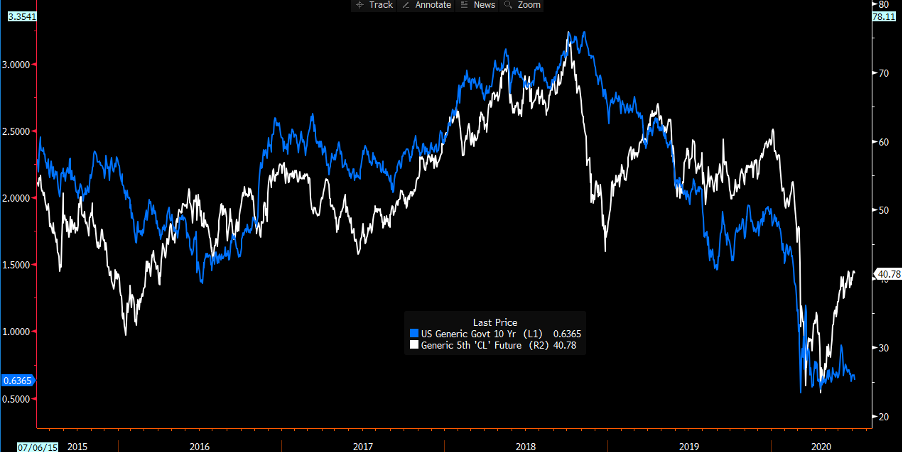
US 10s vs 5th-month WTI crude future – I look at the fifth month WTI futures contract as it looks more closely at the idea of demand at the turn of the year. Whilst supply cuts have been a factor, typically, we see the 5th month WTI future and USTs sharing a strong relationship. That has broken down.
Source: Bloomberg
So, when we consider divergence, we really need to consider the disagreement between the message portrayed between bonds and cyclical assets – how this rectifies itself will make fascinating viewing as clearly the bond market is seeing the future in a less positive light.
Related articles
Ready to trade?
It's quick and easy to get started. Apply in minutes with our simple application process.
The material provided here has not been prepared in accordance with legal requirements designed to promote the independence of investment research and as such is considered to be a marketing communication. Whilst it is not subject to any prohibition on dealing ahead of the dissemination of investment research we will not seek to take any advantage before providing it to our clients.
Pepperstone doesn’t represent that the material provided here is accurate, current or complete, and therefore shouldn’t be relied upon as such. The information, whether from a third party or not, isn’t to be considered as a recommendation; or an offer to buy or sell; or the solicitation of an offer to buy or sell any security, financial product or instrument; or to participate in any particular trading strategy. It does not take into account readers’ financial situation or investment objectives. We advise any readers of this content to seek their own advice. Without the approval of Pepperstone, reproduction or redistribution of this information isn’t permitted.


