- English
- Italiano
- Español
- Français
- English
- Italiano
- Español
- Français
.jpg?height=93&quality=100)
The yellow metal is making some big moves. Yesterday, saw a much higher than expected inflation print, however, this lead to more tightening of monetary policy expectations and helped the dollar push higher keeping gold subdued. Today, however, Jerome Powell’s prepared remarks were released ahead of his testimony before the House Financial Services Committee and the gold bulls/doves were licking their lips. In essence, he said that the U.S. economic recovery hasn’t progressed enough to begin reducing their asset purchases. This sent yields and the dollar lower, which provides rocket fuel for assets like gold and its high beta cousin silver.
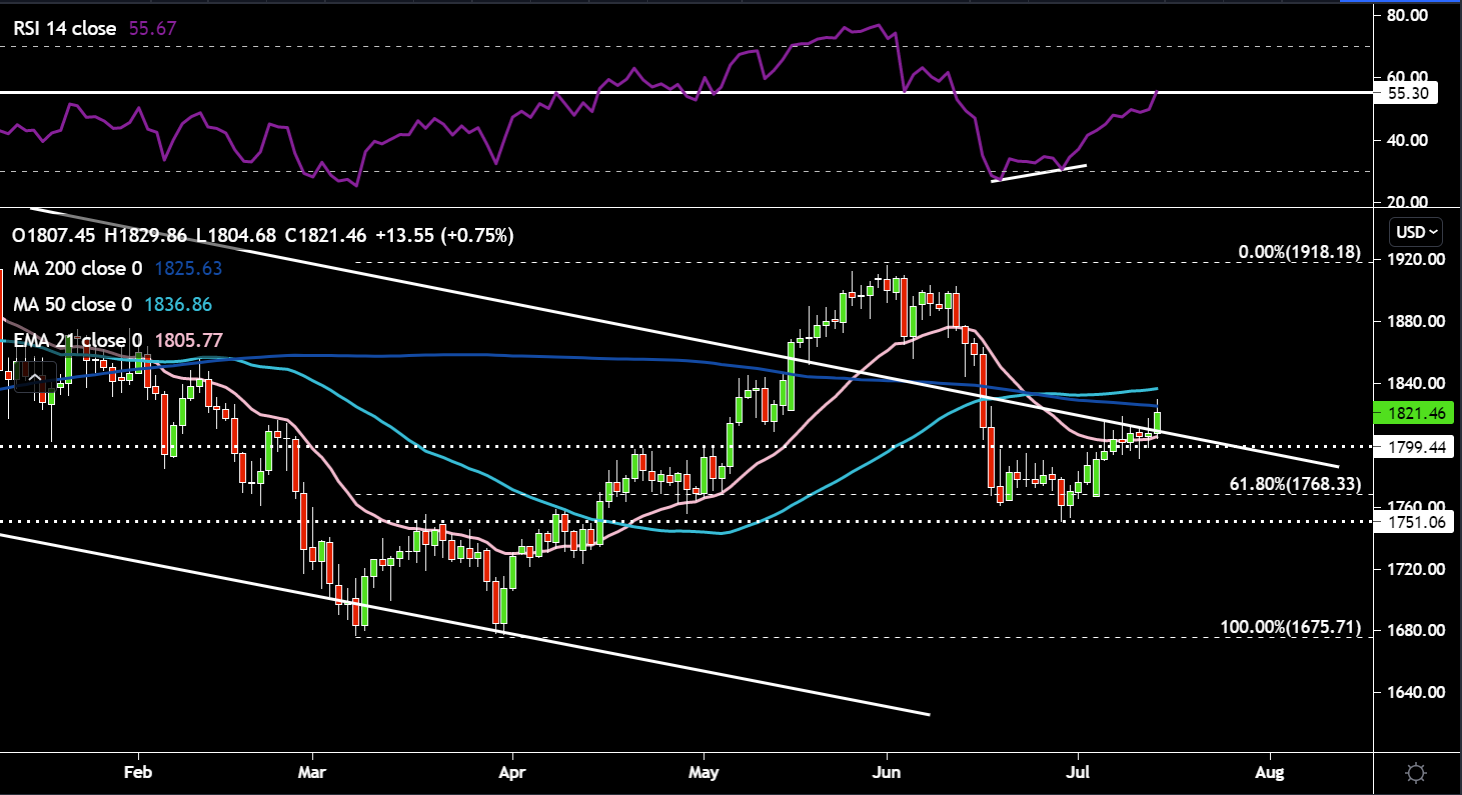
The technicals are looking solid. Gold has breached the upper trend line of the descending channel. Price is now hovering right on the 200-day SMA, which will be key for the yellow metal’s next price direction. The 50-day SMA is also just above that so there is lots of resistance gold will have to negotiate. The RSI is ever so slightly above the 55 level which marked previous price rallies. The negative divergence we saw in in June with price and the RSI helped slow the selling momentum for gold. A first initial upside price target would be around $1840 (50-day SMA) and then $1850 the round number. On the downside, I’d watch the $1800 level around the 21-day EMA and horizontal support.
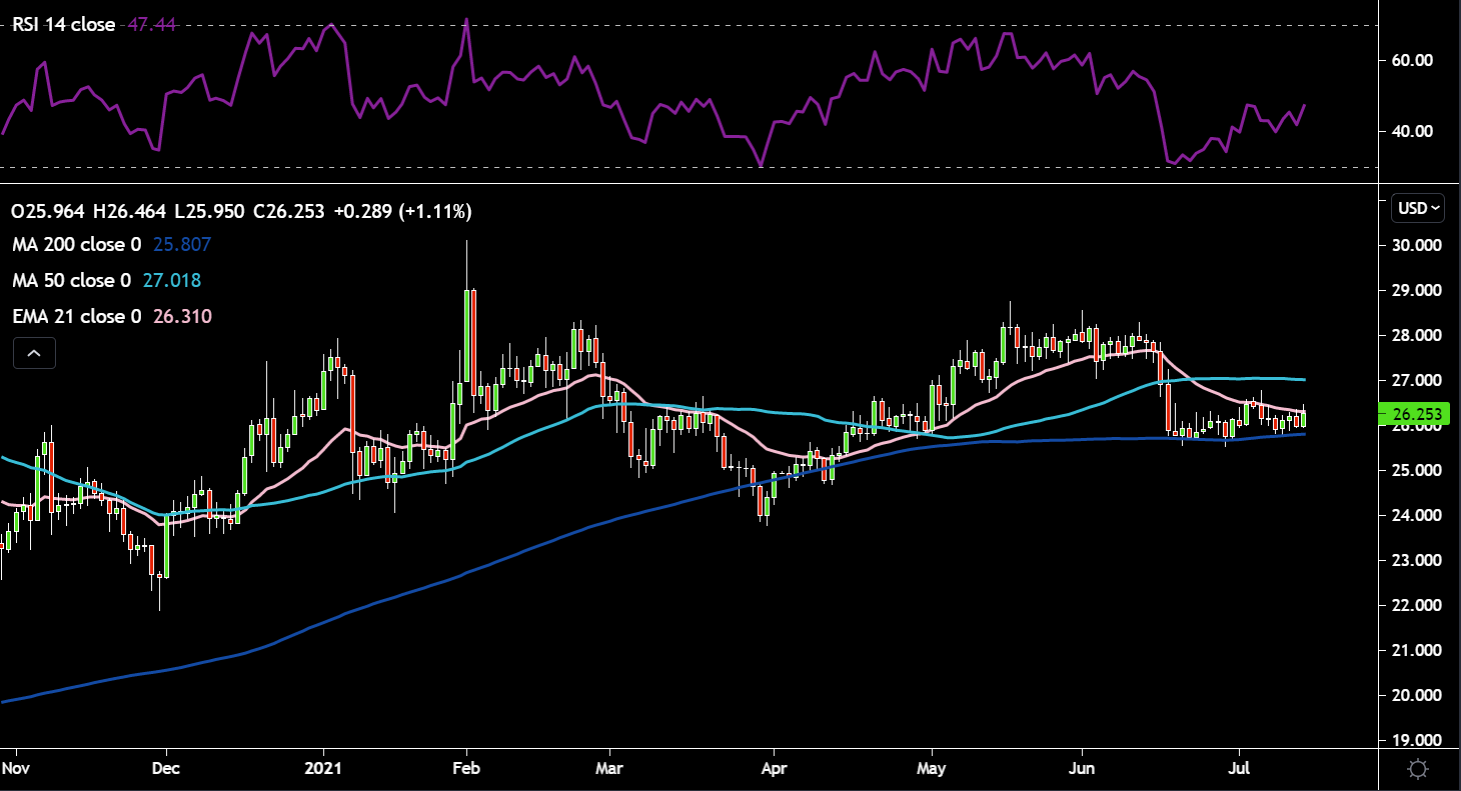
Silver is trying to break out of its range that it finds itself trapped in currently between the 21-day EMA and the 200-day SMA. For bulls it’s important that price still remains above the longer-term moving average. Above the 21-day EMA the next target would be the 50-day SMA around $27. The RSI is moving up in the right direction with plenty of room to go before it can be classified as overbought. If price pulls back and slices through the 200-day SMA then $25 becomes the downside price target.
Related articles


Ready to trade?
It's quick and easy to get started. Apply in minutes with our simple application process.
The material provided here has not been prepared in accordance with legal requirements designed to promote the independence of investment research and as such is considered to be a marketing communication. Whilst it is not subject to any prohibition on dealing ahead of the dissemination of investment research we will not seek to take any advantage before providing it to our clients.
Pepperstone doesn’t represent that the material provided here is accurate, current or complete, and therefore shouldn’t be relied upon as such. The information, whether from a third party or not, isn’t to be considered as a recommendation; or an offer to buy or sell; or the solicitation of an offer to buy or sell any security, financial product or instrument; or to participate in any particular trading strategy. It does not take into account readers’ financial situation or investment objectives. We advise any readers of this content to seek their own advice. Without the approval of Pepperstone, reproduction or redistribution of this information isn’t permitted.