- English
- Italiano
- Español
- Français
- English
- Italiano
- Español
- Français

This run of form perhaps overshadowed by the ASX200 which has closed higher for an 11th straight month.
We head into September with an air of cautious optimism – no one would be shocked to see the start of a 5% to 10% pullback and everyone is asking the question, but few are positioned for it. One questions if the market could even talk itself into it. Seasonality is one of those mystical forces people talk about from time to time. For me, it’s something to consider as part of a framework (but not in isolation), especially where in the past 15 years September is the worst month of any month for US stock market returns.
S&P 500 returns over 10 years
We can go back to the late 1920s and look at average returns per week and see that the second half of September has two of the three worst weeks (on average).
With global data rolling over and the much-anticipated August US payrolls and September FOMC meeting coming up (23 Sept) – anything is possible and if seasonality is our guide, then it will pay to stay nimble. As always, be open-minded to direction, follow the tape and look for the signs that increase probability or a quick-fire drawdown.
Watch the S&P 500 for its influence on broad markets
Like many, I look at the S&P500 closely. Not always to trade the index, and at Pepperstone we tend to see more activity in the NAS100 and US30 than the US500 – But aside from being the world’s institutional equity benchmark, the S&P500 guides the Fed, and it is one of the main tools they watch to see if the market agrees with their policy mix. It's clear that the Fed will taper its asset purchase program later this year (my guess in November) and should the S&P500 crater they’ll tell us they plan to increase it again. If the market plods higher and the VIX stay sub-20% and credit spreads don’t widen, then they’ll soldier on – tapering isn’t tightening but it does increase the vulnerabilities.
Moves in the S&P 500 also matters because if equity volatility picks up then it will spill over into higher vol in the FX markets too.
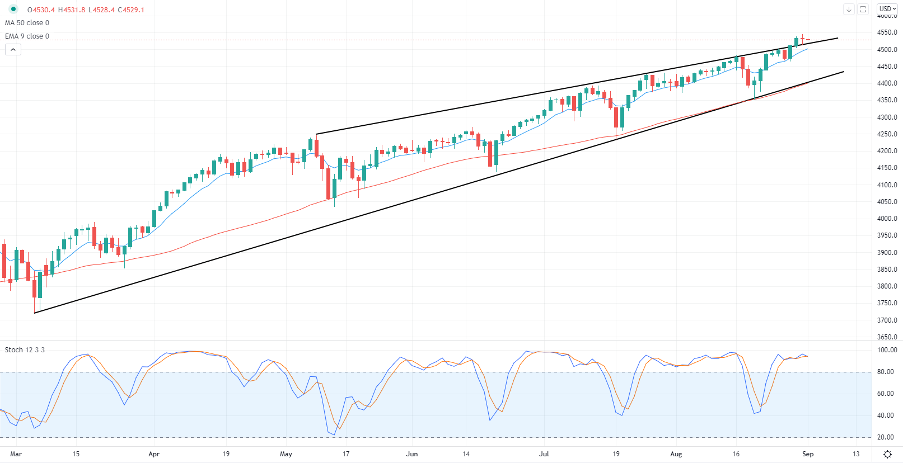
(Source: Tradingview)
The 50-day MA seems important – it has guided the market higher and been the ‘buy the dip’ level throughout 2021, and there is strong uptrend support here too – until this goes and vol spikes then the trend is one’s friend. In fact, the bullish development we saw on Friday was that price broke and close above the rising uptrend resistance. Granted, we’ve seen indecision on the day, in what was a messy tape, but the former trend has been confirmed as support.
Breadth has been mixed, as one would imagine when the index closed -0.1% and cash volumes have been 13% above the 30-day average, so some clear month-end flow going through.
Assessing the warning signs
There is very little at this stage flashing code red – the recent trend since mid-August has been for consumer names to outperform staples. Small caps are outperforming large, higher beta stocks are working vs low volatility names and cyclical's are not giving any glaring reason to be concerned despite the US and global data flow coming in consistently below estimates.
Ratio analysis – warning signs
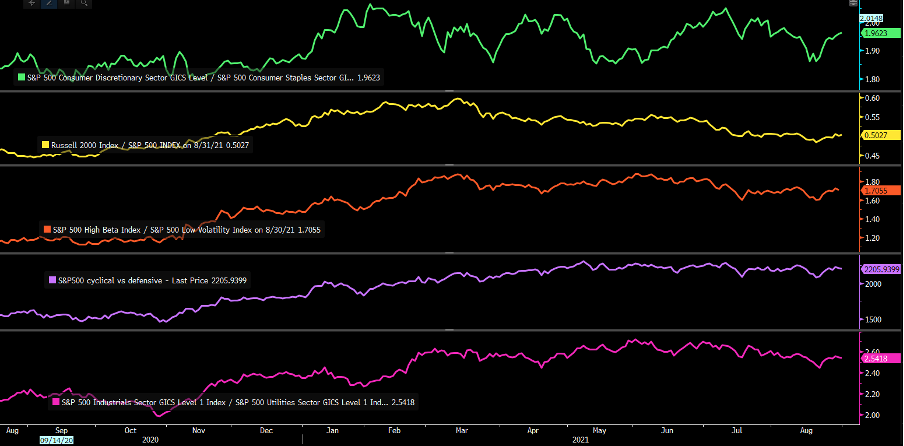
(Source: Bloomberg)
The NYSE put/call ratio sits at 0.66, which is in line with the 1-year average. 30-day implied volatility (VIX) in the S&P500 trades at 16.48%, near 52-week lows and 30-day realised volatility is eyeing new lows at 8.26% - why buy volatility when it's realising so low! Correlations are towards the 15th percentile of the 12-month range – great for active stock pickers.
We also see that after a positive trend through April to mid-August the CHF and JPY (trade-weighted) have rolled over a touch recently and there are reasons to own these unless there is a risk-off vibe.
All these factors tell me the same thing effectively. That being that the market is not positioned for a 5% correction to come anytime soon. Investors want to be in equity, but they head into quality (cash flow, solid balance sheets and high ROE).
Perhaps seasonality will kick in – but the S& P500 is one market to watch closely and a break of the 50-day MA could be key across asset class.
Related articles

Ready to trade?
It's quick and easy to get started. Apply in minutes with our simple application process.
The material provided here has not been prepared in accordance with legal requirements designed to promote the independence of investment research and as such is considered to be a marketing communication. Whilst it is not subject to any prohibition on dealing ahead of the dissemination of investment research we will not seek to take any advantage before providing it to our clients.
Pepperstone doesn’t represent that the material provided here is accurate, current or complete, and therefore shouldn’t be relied upon as such. The information, whether from a third party or not, isn’t to be considered as a recommendation; or an offer to buy or sell; or the solicitation of an offer to buy or sell any security, financial product or instrument; or to participate in any particular trading strategy. It does not take into account readers’ financial situation or investment objectives. We advise any readers of this content to seek their own advice. Without the approval of Pepperstone, reproduction or redistribution of this information isn’t permitted.