- English
- Italiano
- Español
- Français
- English
- Italiano
- Español
- Français
Irrational exuberance – addressing bubbles in financial markets

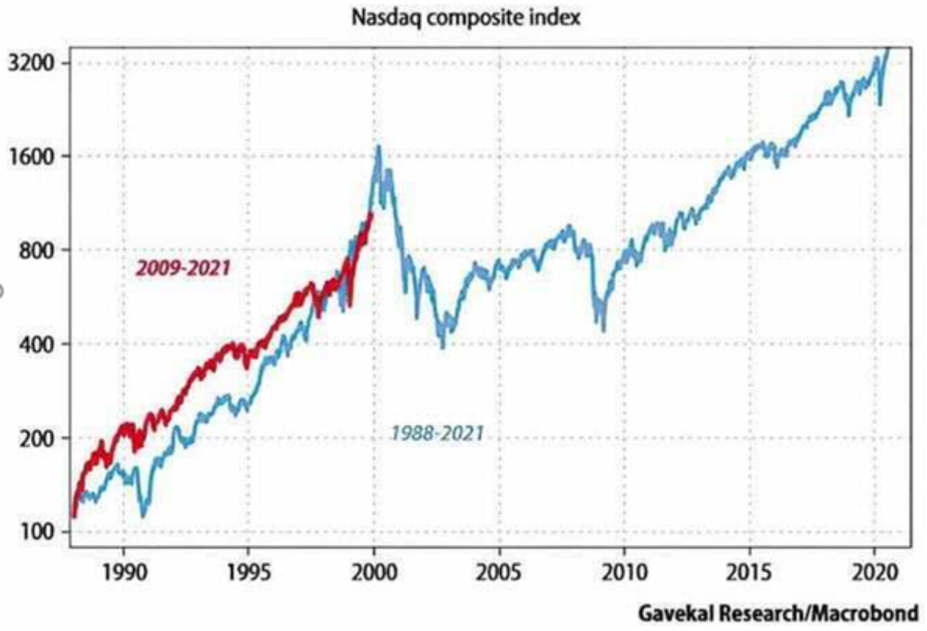
The elastic band on the market is clearly primed and the bull market that started in 2009 – the longest bull market ever – is showing clear evidence of irrational exuberance that suggests the probability that a solid drawdown in financial markets is rising. This would not be confined to the equity market, but an unwind would hit the FX and commodity markets too.
The signs are there, as I will portray but timing any impending correction is obviously the tricky part and the bull run may still have legs. It could be a complete coincidence but overlap the current chart of the NAS100 from 2009 to the present (red) to that of the chart from 1988 to the present (blue) and it could nothing, or history may rhythm. This very well may be how it plays out – in the Fed we trust.
As to the potential smoking gun that causes such an unwind we can only guess, but as traders we assess risk and for me, the idea of higher real US treasury yields (track them here) married with a stronger USD and higher VIX index is the holy trinity of future volatility. But certainly, a rise in real yields would not be taken well, especially if the rate of change spiked higher. A downturn in economics could cause this, but this seems unlikely given the consensus view that economics are set to improve.
The probability is it comes from a fear of overheating or a communication mistake from the Fed, but again that seems unlikely to play out until March at the earliest. That would marry well with the NASDAQ overlap with 1988 above.
Portraying extreme speculation in charts
There are plenty more charts one could highlight, but these are a few that really resonates with me.
Take a look at the Goldman Sachs Risk Appetite Indicator, which combines 27 market indicators, such as the VIX index, corporate credit spreads and the cyclical sectors vs defensive sectors ratio. This indicator is near two standard deviations from the average since 1990 and levels which have capped gains in risk assets and led to a level of exuberance and reversals.
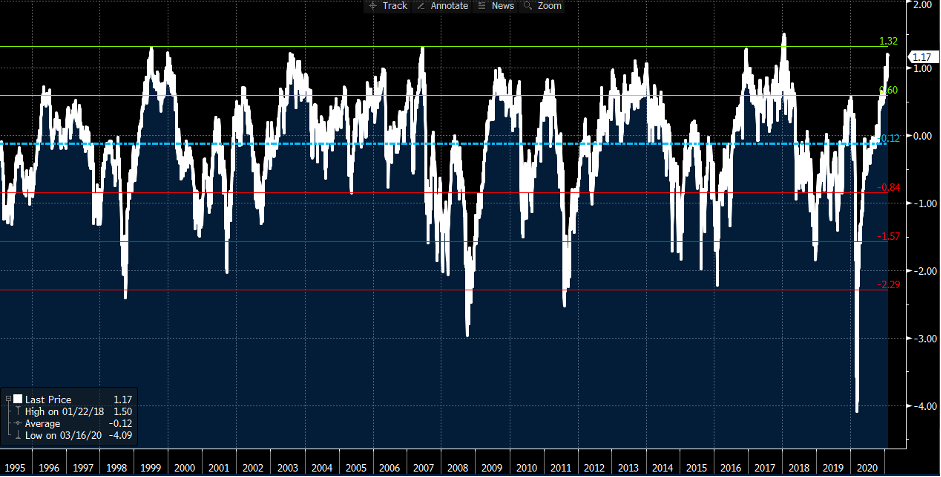
(Source: Bloomberg)
We can look at trading volumes. Not just through US exchanges, but Over-The-Counter (OTC) and the move is there for all to see.
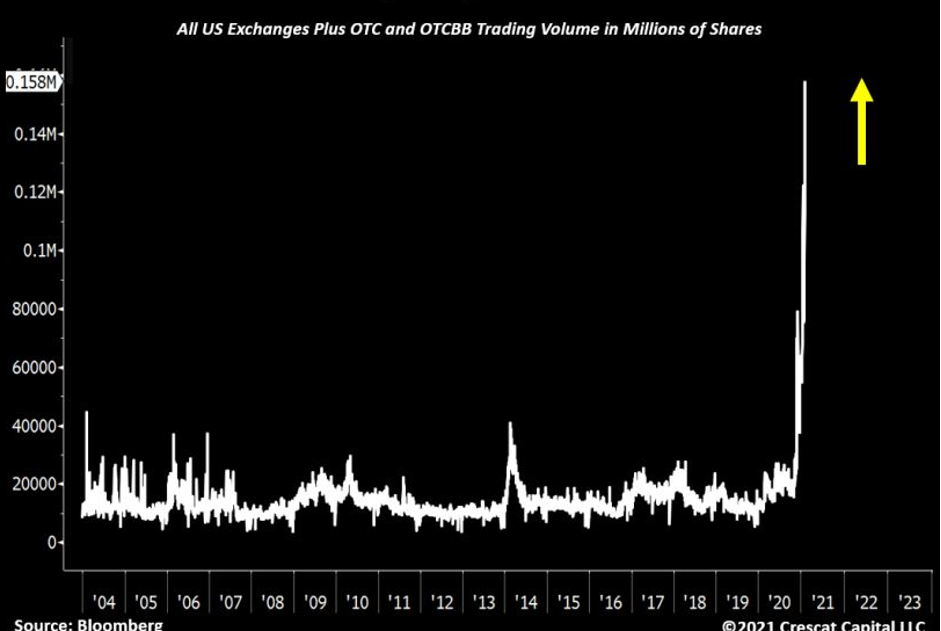
(Source: Bloomberg, Crescat Capital)
Head to the options world and we see total call options in a similar vein as total equity volume. This is part of the retail trader explosion, which has seen trader using options to express a view on stocks. By buying call options, traders know their max loss (the premium) and when enough calls have been written (by market makers) and the price moves through the strike the market is forced to hedge its delta, which means buying the underlying. Again, this just pushes the market higher.
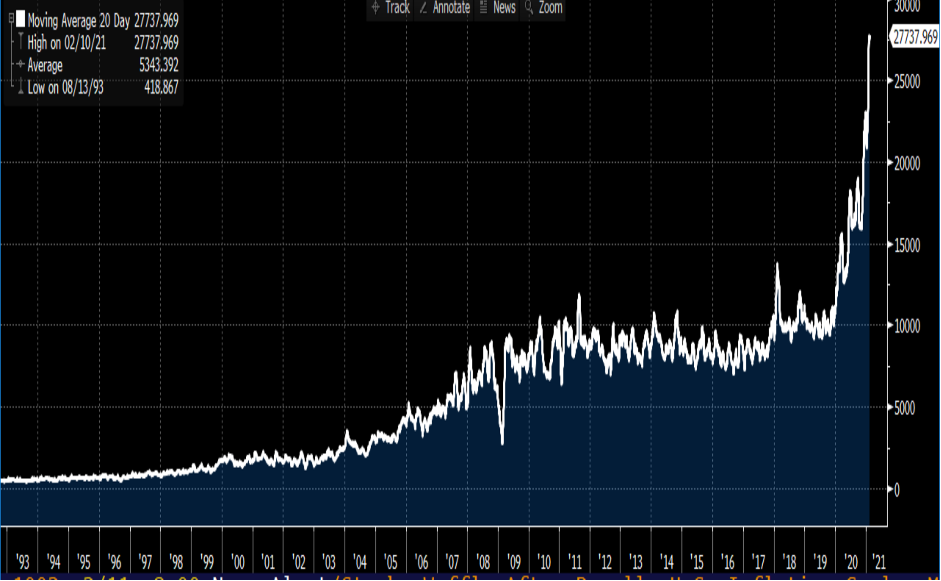
(Source: Bloomberg)
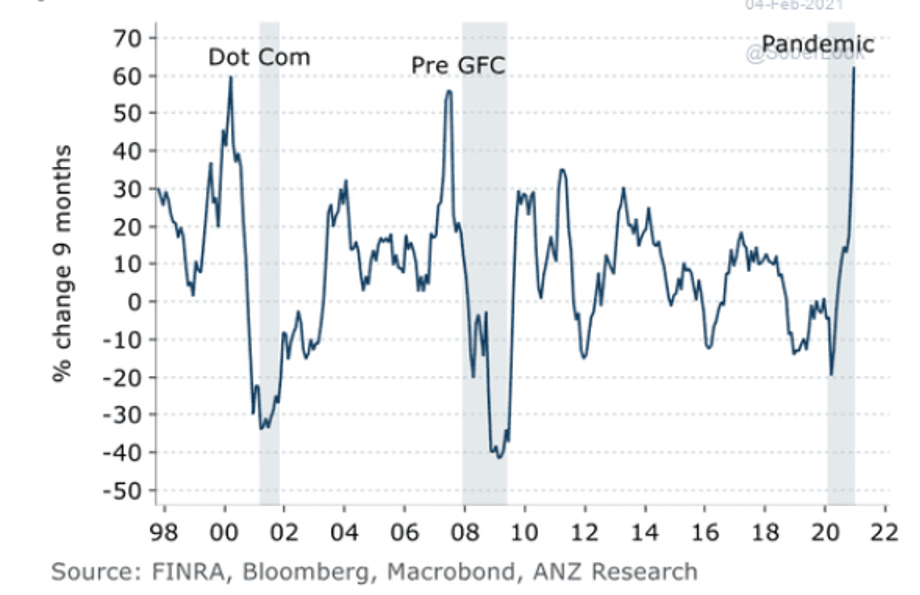
The use of borrowing funds to trade or ‘margin debt’ is another key indicator. As a percentage of GDP margin debt has pushed above 3.5% of US GDP, which is a record. We can also see in this chart that the nice-month percentage change is above 60%, and above the GFC and Dot.Com bubble highs.
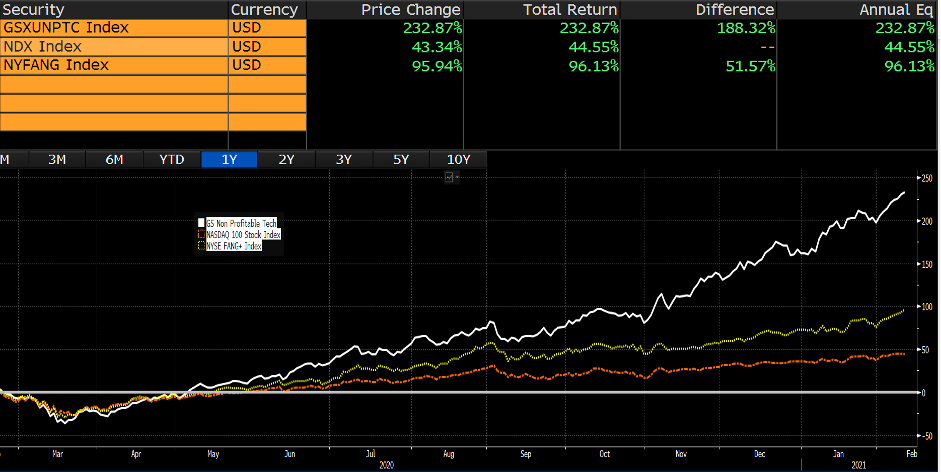
We see that an index of US tech companies that not yet profitable (white line) has dramatically outperformed both the FANGS index (yellow line) and the broader NAS100 (orange). Fundamentals really don’t matter at present, and the market is buying anything that could be next Amazon in 10-15 years.
(Source: Bloomberg)
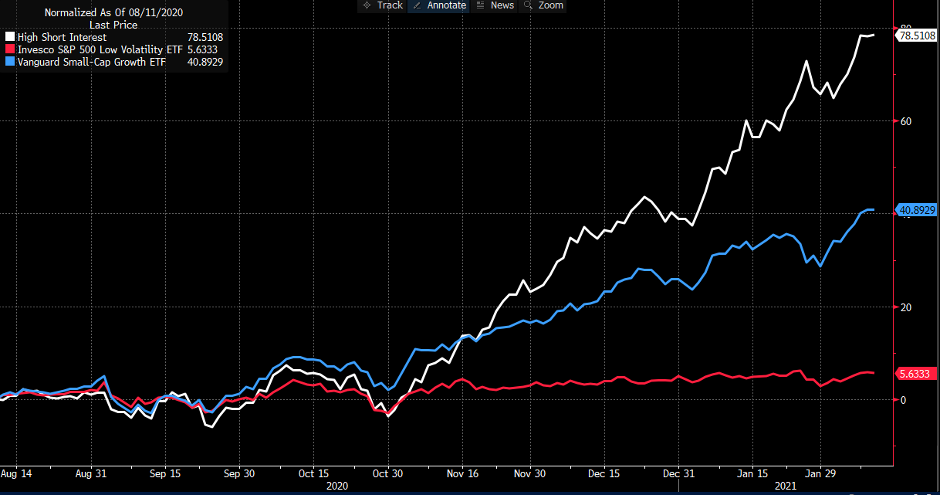
Here we see an index of stocks with high short interest (white) has had a rampant six months, easily outperforming small cap growth stocks (blue) and an index of low volatility stocks (i.e., that do well in times of risk aversion such as utilities). The fact that shorts have been covered in such aggressive fashion again screams of euphoria.
(Source: Bloomberg)
Investor and traders on high alert
Investors need to see the exuberance as a known risk and should the signs evolve, be prepared to hedge or increase exposures in the portfolio to cash. Traders want to be involved in movement and a bursting of a bubble means opportunity for those with the risk tolerance and strategy to handle the movements.
The weekly flow data into equity mutual funds and ETFs (source: EPFR), which always gets a firm focus from the investment banks, become just that bit more important. Fund flows have correlated well to the move lower in US real yields, so as real yield becomes ever more negative, capital has flocked to equities which then feeds into a weaker USD and higher commodities.
We can look at credit spreads, aggregated risk appetite indicators or simply price action, but given the current dynamics when it goes it will unlikely be a one-day affair. So, the signs are there that too many are on the same side of the boat and that boat may eventually tip. There's little margin for error at these levels and while I remain bullish of risk asset (given the prevailing trend) there's too many red flags that suggest that elastic band on the market could snap. Keep your friends close and your stops closer. Ready to trade the opportunity? Trade it with Pepperstone.
Related articles


Ready to trade?
It's quick and easy to get started. Apply in minutes with our simple application process.
The material provided here has not been prepared in accordance with legal requirements designed to promote the independence of investment research and as such is considered to be a marketing communication. Whilst it is not subject to any prohibition on dealing ahead of the dissemination of investment research we will not seek to take any advantage before providing it to our clients.
Pepperstone doesn’t represent that the material provided here is accurate, current or complete, and therefore shouldn’t be relied upon as such. The information, whether from a third party or not, isn’t to be considered as a recommendation; or an offer to buy or sell; or the solicitation of an offer to buy or sell any security, financial product or instrument; or to participate in any particular trading strategy. It does not take into account readers’ financial situation or investment objectives. We advise any readers of this content to seek their own advice. Without the approval of Pepperstone, reproduction or redistribution of this information isn’t permitted.