- English
- Italiano
- Español
- Français
- English
- Italiano
- Español
- Français

However, with surging covid-19 cases (42,839) and a yet-to-confirmed $1.8 trillion fiscal stimulus package, the sell-off continues with S&P 500 closing -2.93% to 2237.4 and Dow Jones -3.04% to 18591.93 on Monday.
Haven dollar
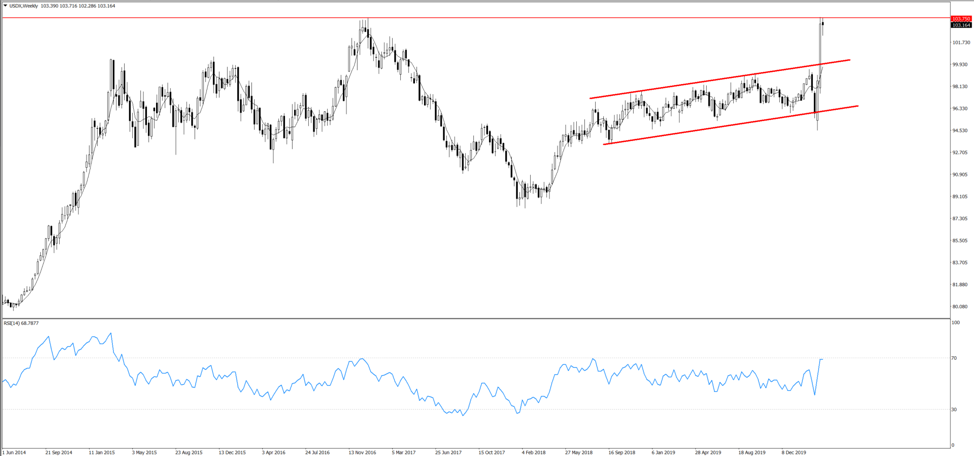
The US dollar index (USDX) soared by 9% to a multi-year high of 103.79 on March 20. Since then the dollar demand continues, although at a slower pace.
History tells us that the USD usually falls along with the equity crash, with JPY, CHF or gold rallying. But it was not the case this time, in which the USD and US equity shows an inverse relationship.
During the recent global sell-off that brought main equity markets into bearish territory, large pension funds in Japan and Europe rushed to buyback USD to rebalance their US equity exposures.
Meanwhile, given the US dollar‘s role of the primary reserve and transaction currency, investors and institutions around the world were selling everything to raise money (USD) for US dollar denominated debt, margin calls, forced sell-off and redemptions. Incredible funding demand has boosted the appeal of the USD with the cross-currency basis and LIBOR-OIS widening.
Cross currency swap basis
A currency swap is a contract in which two parties exchange their principal and interest rate in different currencies and swap back the principal at the end of the contract. It is often used as a tool for foreign-currency funding by banks and institutional investors.
The swap basis, a measure of the USD funding cost, is the premium paid to swap funding exposure from EUR or JPY into USD.
The descending yellow (EUR) and white (JPY) line in the chart means the swap basis is surging, suggesting high demand for US dollars and hence a high cost.
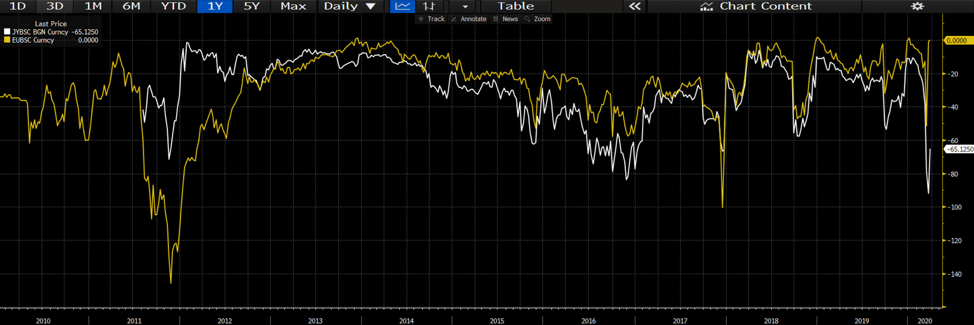
However, after the Fed lowered the pricing of the central bank dollar swap arrangement and expanded the swap line with 14 global peers in total, the cross currency swap basis has decreased and the dollar index pulled back from the recent high.
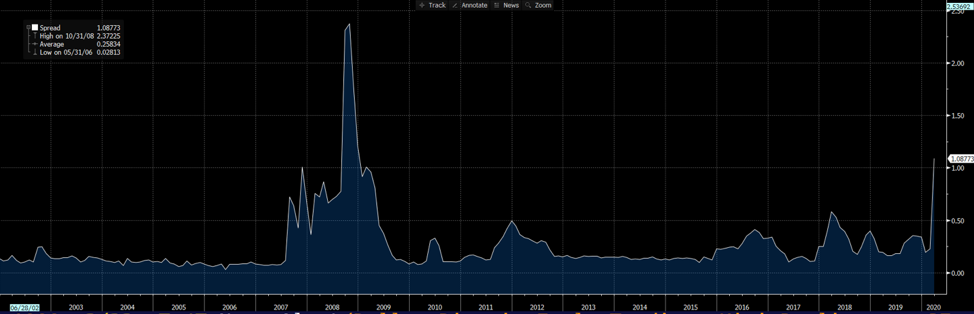
LIBOR-OIS
LIBOR is the average interbank interest rate at which banks are willing to lend to one another. The OIS, or Overnight Index Swap is calculated from contracts in which investors swap fixed-rate (OIS rate) and floating-rate (Fed Fund Effective Rate) cash flows.
The LIBOR–OIS spread - the difference between LIBOR and the OIS rate - is also regarded as a measure of how expensive or cheap it will be for banks to borrow.
The OIS is typically lower than the LIBOR because there is limited counterparty risk (no exchange of principals) in the swap contract.
The highest three-month Libor-OIS spread (see chart below) since the global financial crisis can be interpreted as an indication of a decreased willingness to lend by major banks and a severe credit crunch.
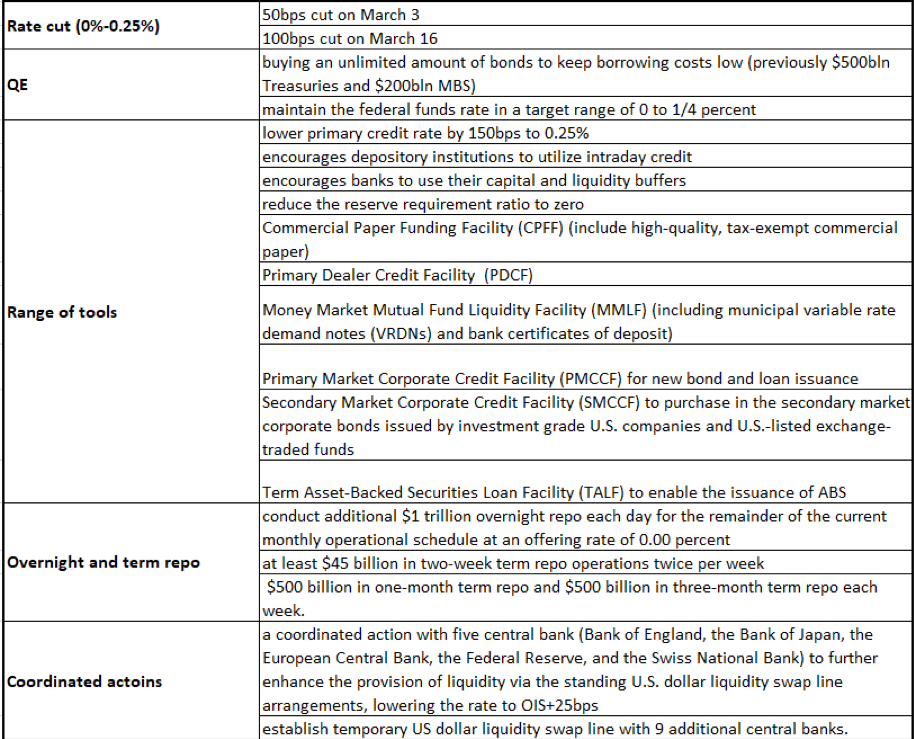
Fed’s effort
Traditional interest rate cuts are not working for the virus-impacted economy, as people are staying home and business activity is halting. After multi-week efforts with dizzying policies, the Fed’s balance sheet has expanded to a record high of $4.7 trillion last week. With the latest monetary measures, it could easily go beyond $5 trillion.
The table below shows what the Fed has conducted so far to ease the dollar squeeze and support the flow of credit to households and businesses.
What to watch
Covid-19 is absolutely the key to everything at the moment. Since it might take months for coronavirus in the US to reach its peak, initial jobless claims will provide some early clues as to how bad the situation is.
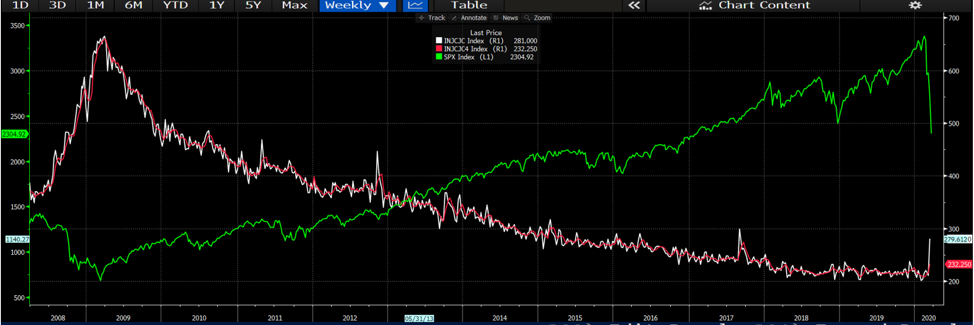
The data for the week through 14 March (before the strict measures were implemented in the US) printed at 281k, 70k higher than the prior reading. This week’s data is forecasted to reach 1.5 million. Federal Reserve Bank of St. Louis President James Bullard even predicted the U.S. unemployment rate may hit 30% in the second quarter.
Until we see a flattening of the covid-19 curve, that suppresses high volatility and the surging jobless claims, the stock sell-off and the USD strength might continue.
Resilient Yuan
Compared to other G10 or major currencies, Chinese offshore yuan (CNH) looks resilient amid USD strength.
The PBOC didn’t join its global peers in the past few weeks to slash rates, showing patience and confidence on the existing monetary policies (despite recent worse-than-expected data). Officials at the PBOC predict that China's economy will quickly return to its potential growth rate and there'll be significant improvement in the coming three months.
Considering China now has the virus under control and people are returning to normal life, while the US and Europe are struggling to combat the virus, CNH will find some buyers. However, the upside potential of CNH will be limited by extremely high volatility and incredible USD demand.
USDCNH has retreated from a five-month high to 7.1092, with the RSI index moving away from the overbought territory.
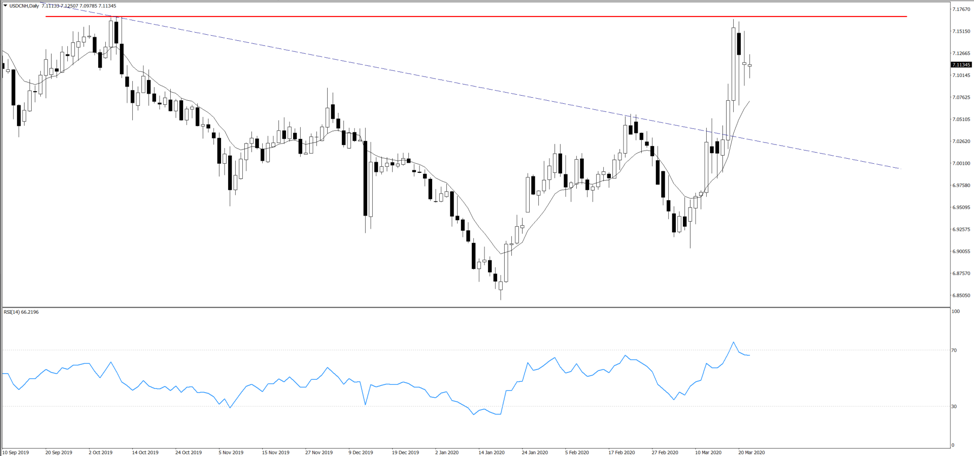
The pair needs to close above 7.1680 (resistance level in red line) to open the door towards 7.1957, the 2019 high. On the flip side, 10 EMA offers the immediate support, followed by 7.0278 near the descending trendline, which acted as a long-term resistance level since September 2019.
The material provided here has not been prepared in accordance with legal requirements designed to promote the independence of investment research and as such is considered to be a marketing communication. Whilst it is not subject to any prohibition on dealing ahead of the dissemination of investment research we will not seek to take any advantage before providing it to our clients.
Pepperstone doesn’t represent that the material provided here is accurate, current or complete, and therefore shouldn’t be relied upon as such. The information, whether from a third party or not, isn’t to be considered as a recommendation; or an offer to buy or sell; or the solicitation of an offer to buy or sell any security, financial product or instrument; or to participate in any particular trading strategy. It does not take into account readers’ financial situation or investment objectives. We advise any readers of this content to seek their own advice. Without the approval of Pepperstone, reproduction or redistribution of this information isn’t permitted.