- English
- Italiano
- Español
- Français
- English
- Italiano
- Español
- Français
Analysis

CHINAH – Buy strong, sell what’s weak
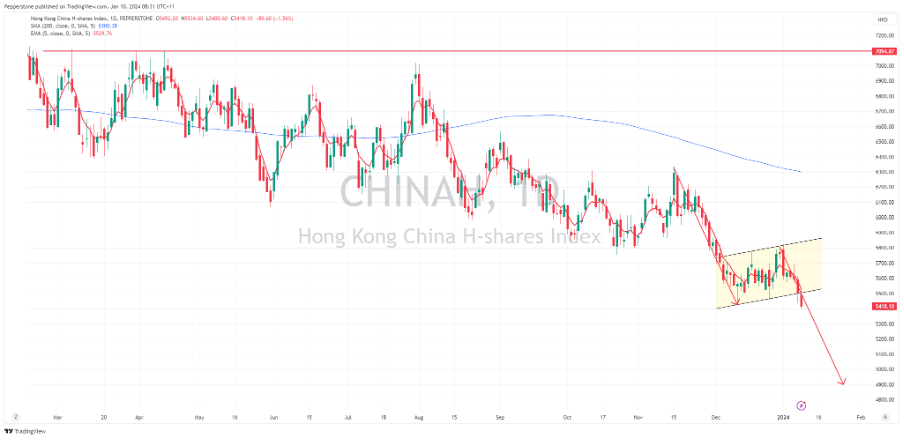
Despite cries that Chinese/HK equity is cheap, we see no signs that international managers are prepared to step in and buy these markets with any conviction. The region was one of the few equity markets to close lower in 2023, and already in 2024, we’re seeing a significant underperformance. It seems the drip-fed approach to policy easing and support just isn’t cutting it and the market wants a shock-and-awe approach. Momentum favours the brave and it’s the preferred strategy to play Chinese/HK equity. So, until I see signs of international managers going overweight China, we see inflows into mainland funds through the ‘connect’ channels, which will be seen in more positive price action, then the trend is very much my friend – the break of the bear flag and a subsequent break of 5400 suggests a target of 4900.
AUDUSD – copper leading the way
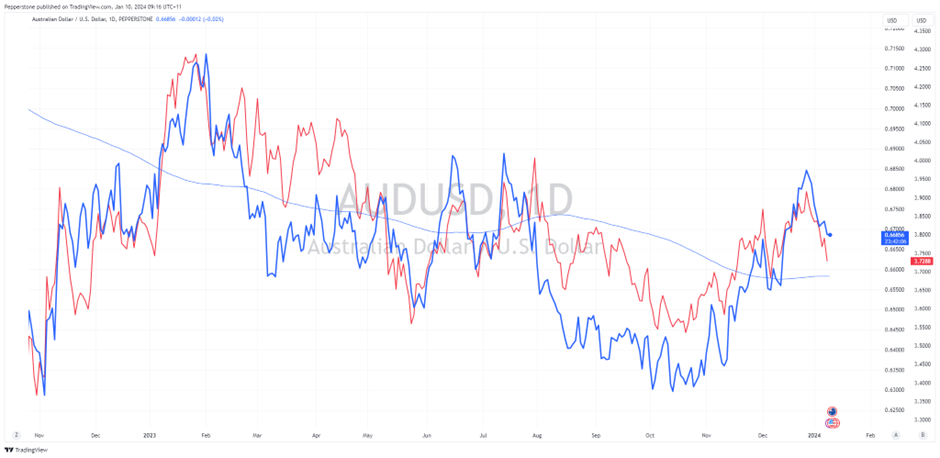
Many will look at relative interest rate differential as a driver for exchange. However, when I look at either AUS-US 2-year bond yield differentials or what is priced into AUS-US swaps pricing I see very little relationship between the AUDUSD and that of relative interest rate expectations. Where we do see a strong relationship is with industrial metals and notably copper. The daily chart of HG copper portrays the recent decline from $3.96 and given the current setup and price action it feels like we could see $3.60 come into play. While we could see some move from the AUD in today's Aussie monthly CPI print (11:30 AEDT), the move in the AUD driven by rates should fizzle out quickly enough and the pair will likely revert to taking its direction from metals again.
JPN225 – the hot market
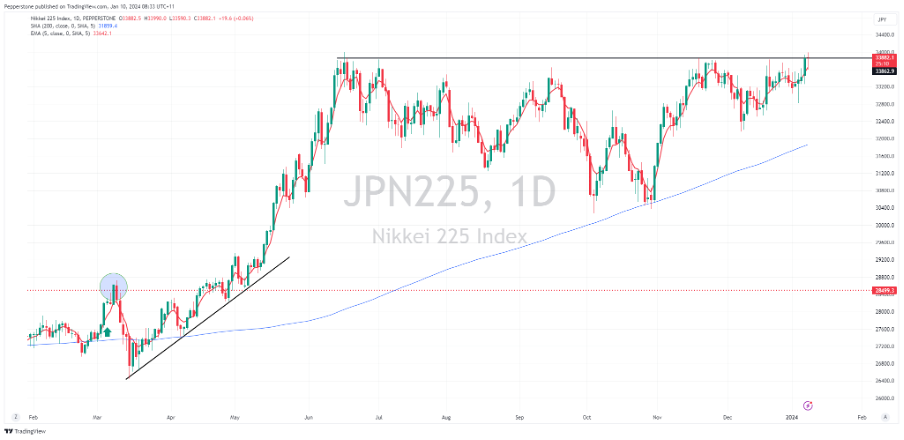
The JPN225 has started the year off as the hot index play and we see price testing the top of the 12-month range at 33,850. The weak JPY is having a positive effect (given the index is priced in JPY) but even when pricing the index in USD we see outperformance. While BoJ policy remains highly supportive of JP equity flows, traders need to react to what comes next. My preference is to wait for a break (should it come) as failed breaks at key levels can be very powerful short position signals. Conversely, a closing break suggests a heightened possibility the index kicks and becomes a bullish momentum trade.
Bitcoin – life after the ETF
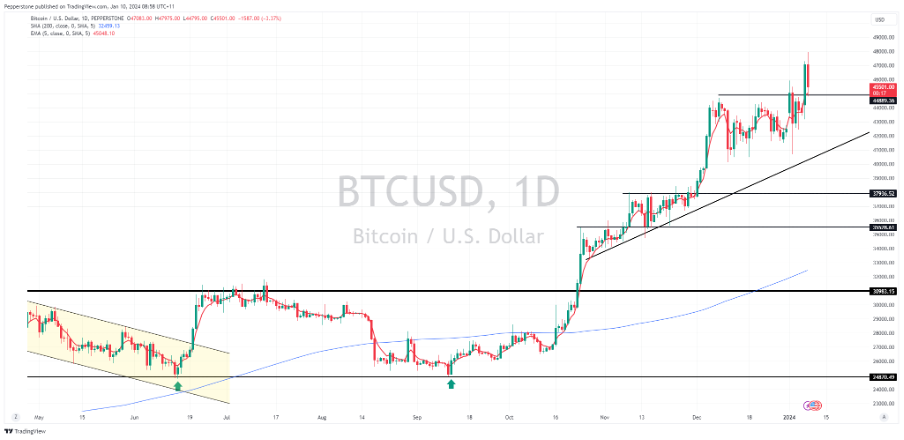
It’s been fairly chaotic scenes in crypto land as we close out the US session. Initially, we were told the SEC had confirmed its blessing for a Bitcoin cash ETF. But then in a sinister twist, SEC chair Gary Gensler took to Twitter detailing that his account had been hacked and that they hadn’t yet made a call. Naturally, we’ve seen some increased vol with BTC trading in a $2900 range through this period. We will get an announcement in the session ahead, as the formal deadline is today, and most likely we’ll see it confirmed from Gary Gensler’s X account.
The reality is most who have followed the saga have moved on and the green light from the SEC is fully priced, and the market is focused on when the various ETFs will start to trade and how many Bitcoins will be held in spot ETFs by end-2024 and the USD value of inflows over that time. While we can’t rule out yet another delay in their call, once we get confirmation and with so much news discounted, and the halving not until 23 April, weak hands may look to take some off the table here. However, price could just as easily kick higher as FOMO players chase – the point is we need to keep an open mind here, where reaction is key for traders, but higher vol seems assured in the near term.
US interest rate pricing – will the Fed cut in March?
As we await the US CPI print this week (Friday 00:30 AEDT) the outcome from the data could play an important role in expectations for a 25bp rate cut from the Fed in the March FOMC meeting. Interest rate futures and swaps are often the first derivative and the likes of the USD, gold and high beta equity follow in sympathy.
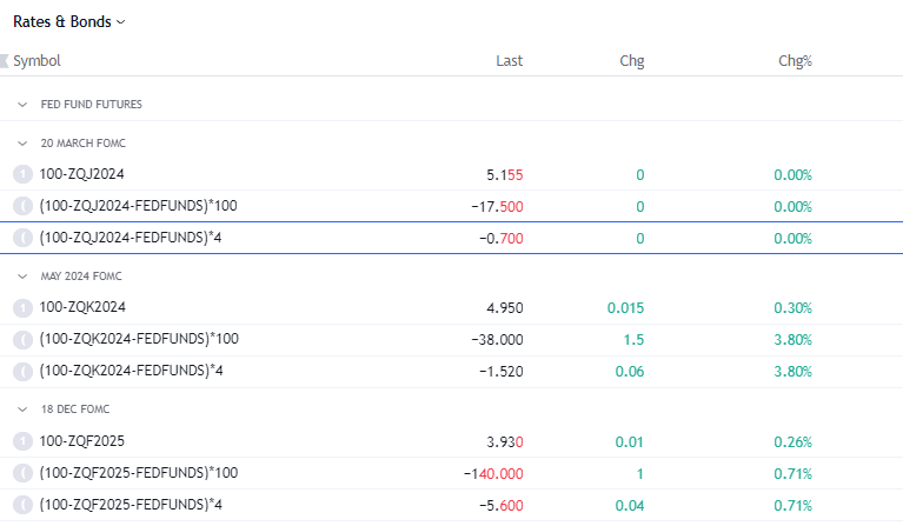
For those who use TradingView we can track expectations around the probability of policy easing using this equation:
- 100-CBOT:ZQJ2024 – currently 5.16% - this tells us the implied yield for the April fed funds future. This covers the March FOMC meeting.
- (100-CBOT:ZQJ2024-FRED:FEDFUNDS)*100 – using that implied yield and subtracting from the current fed funds effective rate we can see the degree of easing that is pricing for the March FOMC meeting. It is dynamic and as long as the Interest rates futures are open the degrees of pricing will move with supply and demand. We see this currently at 17.5 basis points.
- (100-CBOT:ZQJ2024-FRED:FEDFUNDS)*4 – we take the implied number of cuts in basis points (17.5bp) and divide by 25bp to get the number of 25bp cuts priced. In this case, the figure stands at -0.68. 0.7 of one 25bp cut (or a 68% chance of a 25bp cut) in March. Conversely, we see 139bp of cuts priced by December, equating to 5.6 25bp cuts.
As we see in my watchlist, we can do this for other FOMC dates too.
The material provided here has not been prepared in accordance with legal requirements designed to promote the independence of investment research and as such is considered to be a marketing communication. Whilst it is not subject to any prohibition on dealing ahead of the dissemination of investment research we will not seek to take any advantage before providing it to our clients.
Pepperstone doesn’t represent that the material provided here is accurate, current or complete, and therefore shouldn’t be relied upon as such. The information, whether from a third party or not, isn’t to be considered as a recommendation; or an offer to buy or sell; or the solicitation of an offer to buy or sell any security, financial product or instrument; or to participate in any particular trading strategy. It does not take into account readers’ financial situation or investment objectives. We advise any readers of this content to seek their own advice. Without the approval of Pepperstone, reproduction or redistribution of this information isn’t permitted.