- English
- Italiano
- Español
- Français
- English
- Italiano
- Español
- Français
Analysis

Natural gas futures in Europe and the UK are flying, while our natural gas (NG) CFD (the underlying is traded on the NYMEX) pushed over $5.60 and into 7-year highs – perhaps one for the brave at these levels, as so many indicators are flashing grossly overbought, but NG is in beast mode now and the trend-followers would be all over this move.
Hurricane Ida has clearly boosted the natural gas price, but it has also resulted in some 27 million barrels of lost US crude supply and talk from the International Energy Agency is that his production has offset the additional output recently announced from OPEC+. The weekly EIA inventory report (released in US trade) showed US crude inventories fell 6.42m barrels, far more than the estimates from oil strategists for a 2.7m drawer and supplies now sit at the lowest since September 2019. There was a strong increase in the EIA’s statistics on crude demand too.
The demand story is also underpinning the bullish resurgence and as evidence emerges of supply falling, the market can be inspired that OPEC’s estimates of demand for 2022 of 4.15m barrels a day.
What most important is the reaction and price is always the final arbiter – SpotCrude has firmly broken out of its recent range high and sits at the highest levels since 2 August. Clients are feeling the move, where 65% of all open positions are held long, although this is more nuanced in SpotBrent. The obvious big level (in SpotCude) to target and to see how price reacts is the 30 July swing of $74.21 and a break here sets crude up for a re-test of one of the most pronounced double tops in financial assets at $76.95.
SpotCrude daily – can we test the double top?
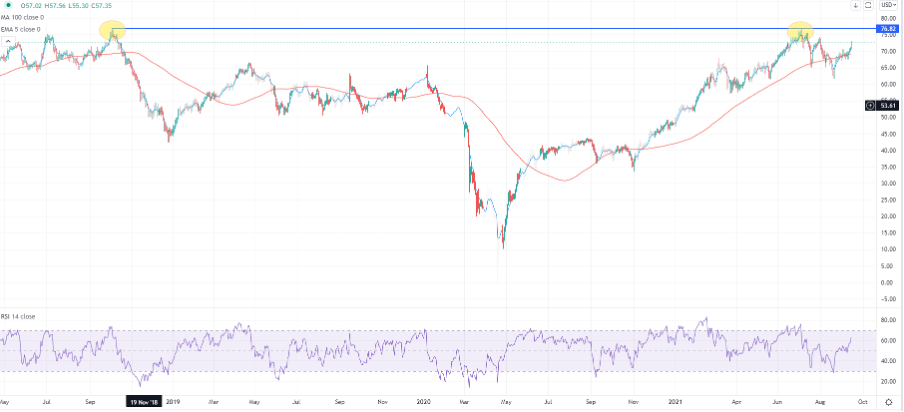
(Source: Tradingview - Past performance is not indicative of future performance)
Personally, if indeed we do make it this far, I’d be a willing seller, but if the news flow did take it through $77.00 on a closing basis, then the headlines of $100 crude will ramp up.
Tactically, I would use the 5-day EMA (exponential moving average) to guide, and in this trend pullbacks into this average should offer entry points for longs to focus on. A daily close below the 5-day EMA would increase the prospect that price may chop around, but in this trend, momentum can be very powerful.
Expressing crude through ETFs, stocks, and FX
Traders can also look at our universe of ETF (Exchange Traded Funds) CFDs, where the XOP ETF (oil and gas exploration ETF) and XLE ETF (S&P energy sector ETF), can be traded on the MT5 platform. While we’ve seen another solid move in the URA ETF (Global X Uranium ETF), both energy ETFs have traded with great strength and volume.
(Blue – WTI crude, Orange – XLE ETF, white – XPO ETF)
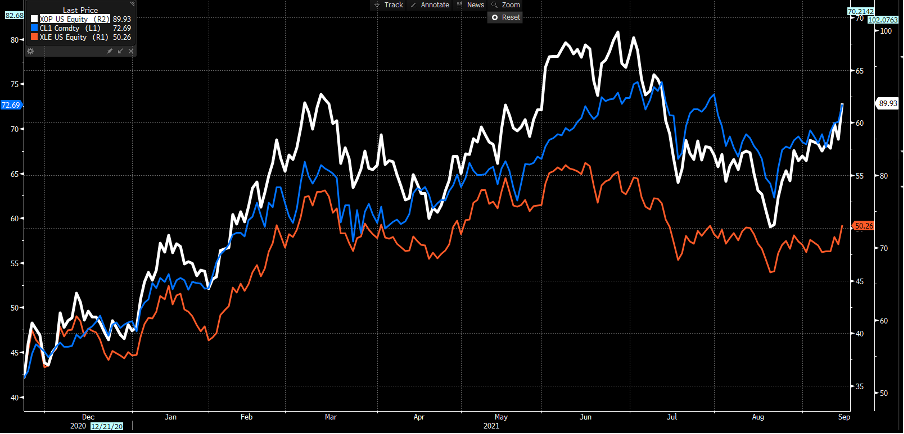
(Source: Bloomberg - Past performance is not indicative of future performance)
Overlapping the XLE and XOP ETFs to the WTI crude price and one could argue the XLE has the most to gain here and could play ‘catch-up’ after lagging the crude move through most of 2021. The XOP, just by the nature of the constituents of the ETF would have the higher beta move, so it’s no surprise to see that at times when the crude price rallies the XOP tends to work well.
Best performing shares in our universe of US stocks – trade on MT5
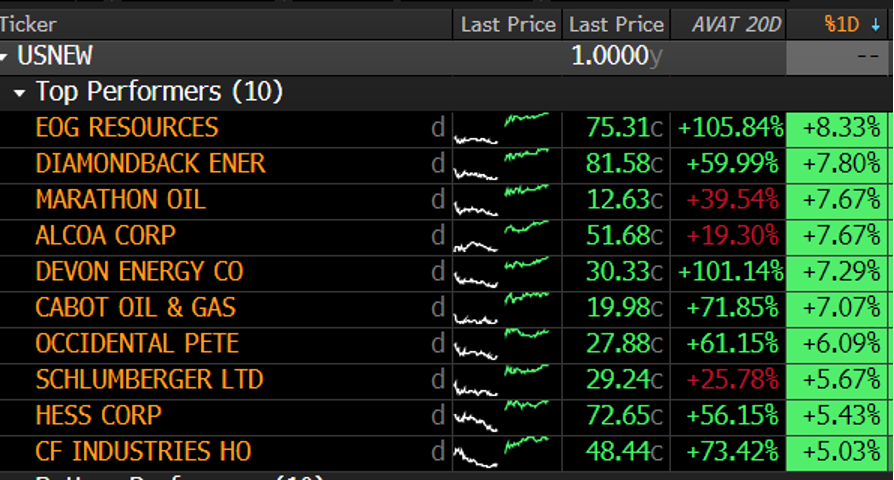
(Source: Bloomberg - Past performance is not indicative of future performance)
We can also see some big percentage moves in our US shares universe and naturally the NOK and CAD have outperformed in G10 FX. EURNOK is one of the preferred exposures to play a rising crude price, and we’re seeing a solid bearish trend here – if Brent and WTI crude are headed for their respective double tops then EURNOK is going one way in my view.
Daily chart of EURNOK
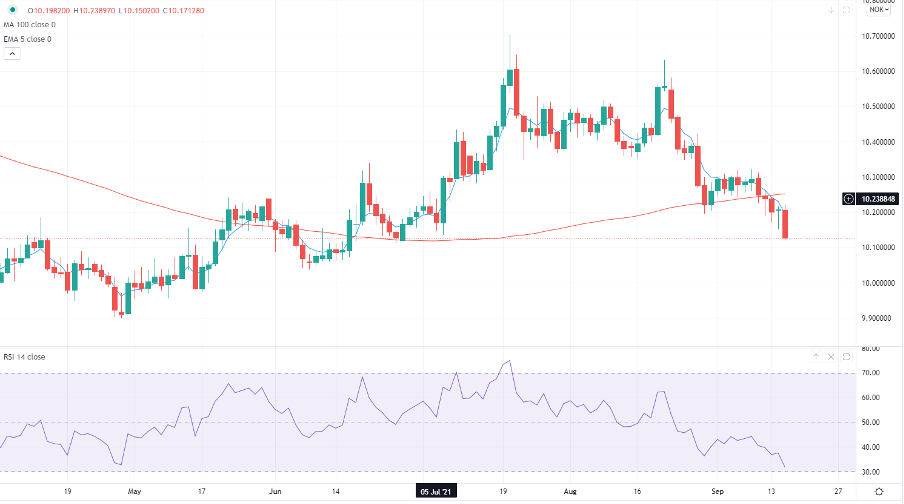
(Source: Tradingview - Past performance is not indicative of future performance)
Related articles


Ready to trade?
It's quick and easy to get started. Apply in minutes with our simple application process.
The material provided here has not been prepared in accordance with legal requirements designed to promote the independence of investment research and as such is considered to be a marketing communication. Whilst it is not subject to any prohibition on dealing ahead of the dissemination of investment research we will not seek to take any advantage before providing it to our clients.
Pepperstone doesn’t represent that the material provided here is accurate, current or complete, and therefore shouldn’t be relied upon as such. The information, whether from a third party or not, isn’t to be considered as a recommendation; or an offer to buy or sell; or the solicitation of an offer to buy or sell any security, financial product or instrument; or to participate in any particular trading strategy. It does not take into account readers’ financial situation or investment objectives. We advise any readers of this content to seek their own advice. Without the approval of Pepperstone, reproduction or redistribution of this information isn’t permitted.