- English
- Italiano
- Español
- Français
- English
- Italiano
- Español
- Français
Analysis

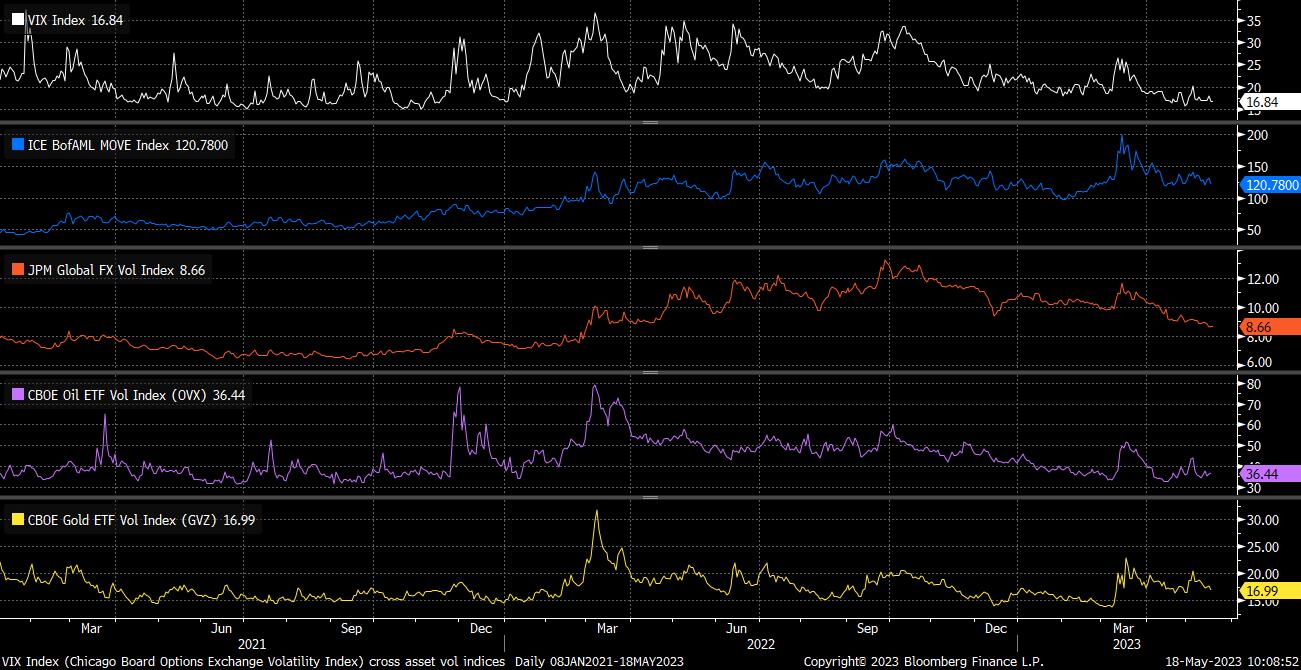
The VIX (S&P 500 implied volatility) is close to its lowest level in over a year; BofAML’s MOVE index (Treasury implied volatility) has steadied within the range seen during most of 2022, having pared a pop higher during the height of the regional banking breakdown; JPMorgan’s global FX implied vol index (USD vs. 20 currencies) is at one-year lows, with similar milestones being seen in commodity volatility measures as well.
While implied volatility relates to the market’s expectation of volatility over a forthcoming period (the above generally relate to the 30-day tenor), we can also use realised volatility as another gauge of market movement.
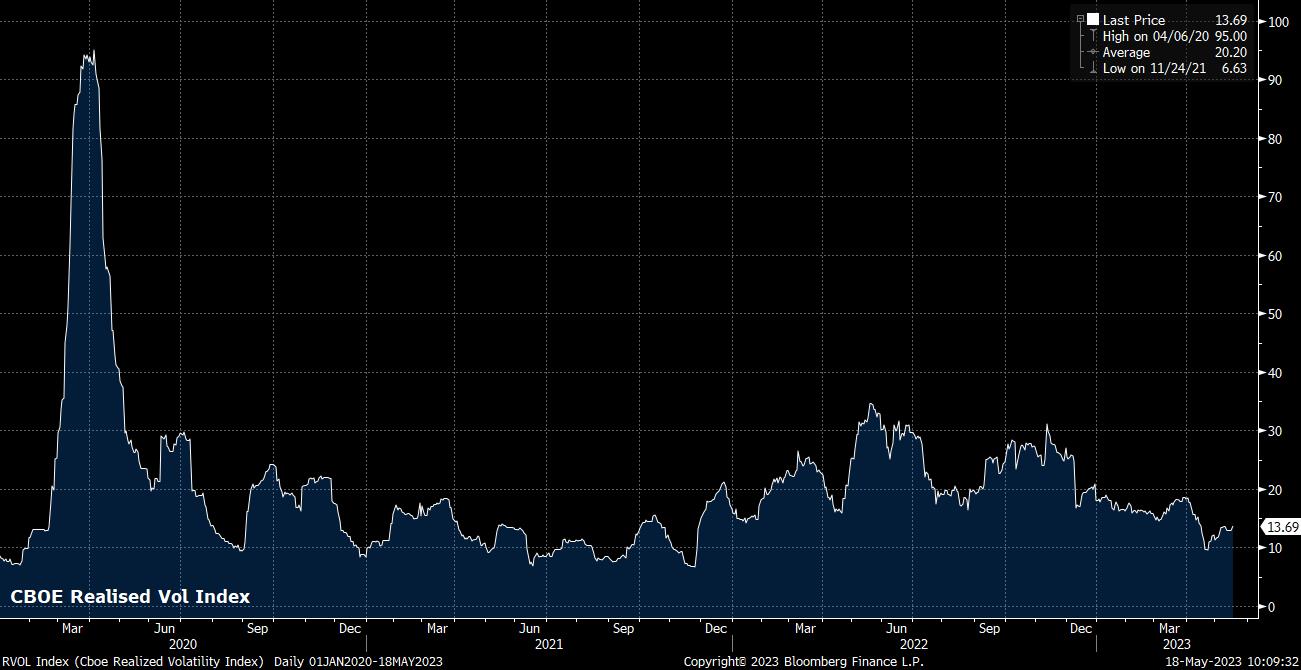
Realised vol shows the magnitude of daily price movement by measuring the annualised standard deviation in daily price return, over a certain period. CBOE’s 1-month RVOL index, relating to the S&P 500, also trades at subdued levels, as near as makes no difference the lowest since Dec 2021.
A slightly cruder way of measuring vol is to simply look at the range traded over a daily period, and how this compares to recent price action. This is also a common method used by short-term traders.
The ‘Average True Range’ is one such indicator, shown below for the Dollar Index (DXY), which is a moving average of the ‘True Range’, defined as the greatest of the current high less the current low; the absolute value of the current high less the previous close; and the absolute value of the current low less the previous close. Once more, the drop, and more importantly the downward trend in volatility, is evident.
_2023-05-18_10-11-03.jpg)
Unsurprisingly, low implied, and more importantly low realised, volatility are both associated with quiet trading conditions; a low vol market is often one which trades in a tight range, shows little inclination to break out either way, and also one which typically experiences relatively low trading volumes owing to the lack of opportunity that such a subdued market presents.
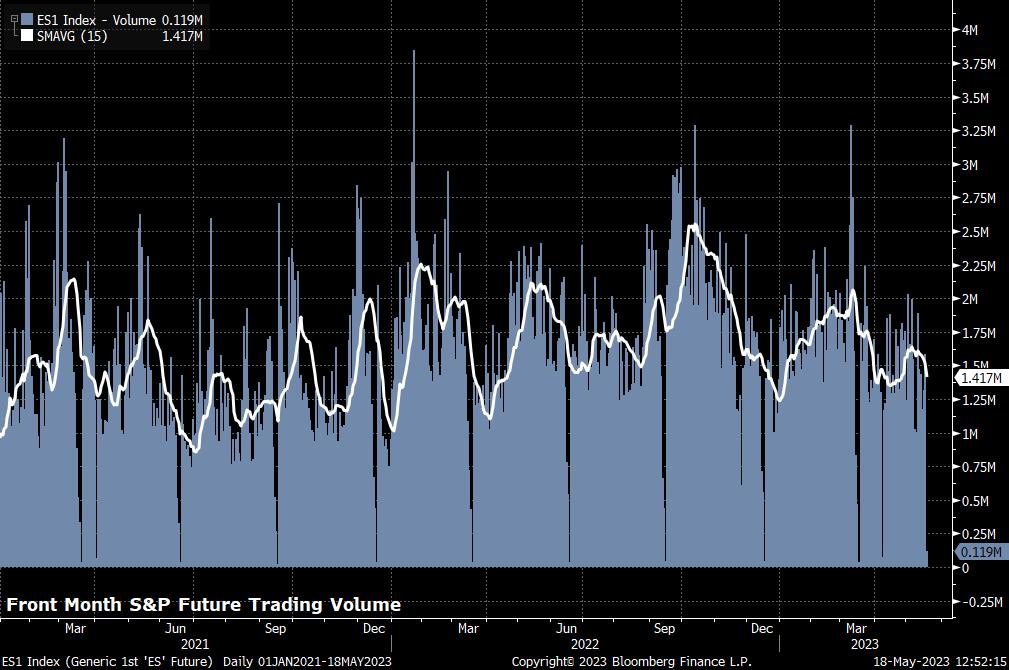
This is clear at an institutional level, if one looks at trading volumes in the front month S&P future, we see a significant trend lower for much of the last couple of months, with an increasingly frequent number of trading days seeing volumes substantially below the 15-day moving average.
Logically, one may ask at this stage what could awaken the market from its current slumber. Given the adeptness with which we have seen markets navigate a host of recent events – earnings season, FOMC/ECB/BoE decisions, US labour market report, US inflation, soft China data etc. – there is a reasonable argument to be made that traders are very well-hedged, thus resulting in little speculative activity at the headline index level, or even in specific stocks. Monthly CME option expiry is this Friday (19th May), which may cause some movement as hedges roll off, and new positions are placed.
Beyond that, the debt ceiling has not yet proved of much interest to market participants, given that we have all seen this pantomime many times before, and know how it ends. There are open questions around the degree of fiscal tightening required to get a deal over the line, but these considerations are too long-term for markets to focus on right now.
The big ‘elephant in the room’ remains money markets continuing to fight the Fed when it comes to H2 rate pricing – the Fed have indicated they will be on hold, while markets price over 70bps of cuts from July onwards.
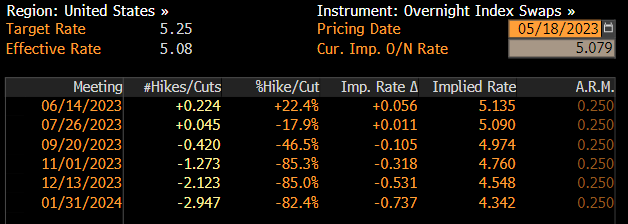
One could argue that this represents a probability distribution of the possible economic paths over the next 6/7 months, rather than explicit bets on the Fed loosening to such a degree. However, if the FOMC continue to stand their ground, a significant degree of policy loosening will have to be priced out of the curve, posing an upside risk to the USD, and downside risks to equities. This, though, doesn’t seem likely to play out until after the summer months have passed.
Related articles


The material provided here has not been prepared in accordance with legal requirements designed to promote the independence of investment research and as such is considered to be a marketing communication. Whilst it is not subject to any prohibition on dealing ahead of the dissemination of investment research we will not seek to take any advantage before providing it to our clients.
Pepperstone doesn’t represent that the material provided here is accurate, current or complete, and therefore shouldn’t be relied upon as such. The information, whether from a third party or not, isn’t to be considered as a recommendation; or an offer to buy or sell; or the solicitation of an offer to buy or sell any security, financial product or instrument; or to participate in any particular trading strategy. It does not take into account readers’ financial situation or investment objectives. We advise any readers of this content to seek their own advice. Without the approval of Pepperstone, reproduction or redistribution of this information isn’t permitted.