- English
- Italiano
- Español
- Français
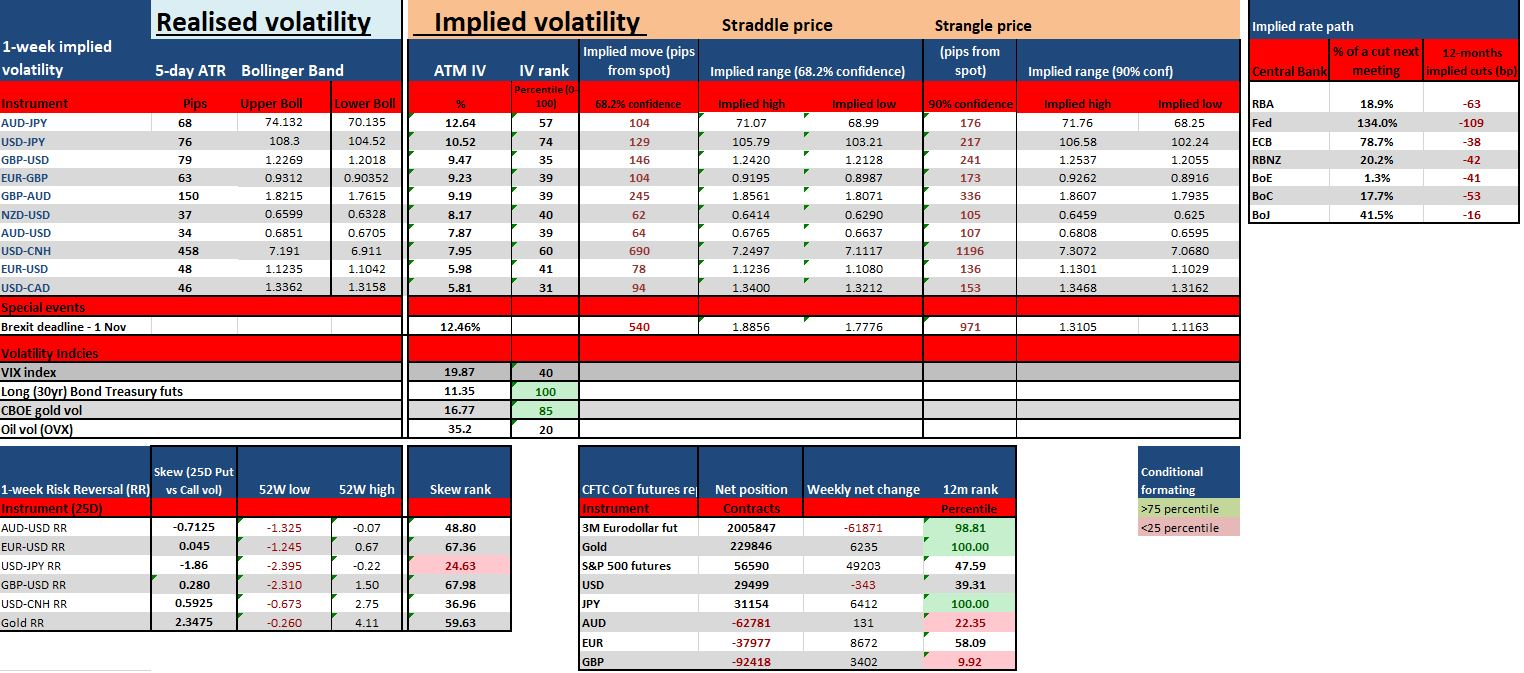
If you didn’t see my video on using the spreadsheet, you can watch it here.

When the markets move from trade tensions to full-scale economic war
One way or another, US President Donald Trump will get his 100bp cut from the Federal Reserve, although we’re yet to see a strong deterioration in US inflation expectations to get the Fed on board. That said, broad financial market volatility has ramped up, and financial conditions are tightening. That’s smack bang on the Fed’s radar. The markets are playing a key role in pushing central banks to get ahead of pricing, and Trump feels he’s in control of this dynamic.
Asia reacting to Friday’s news flow
It was a session of high drama on Friday — the timeline of events I’ve laid out here, where I’ve plotted the catalysts behind price moves against the number of cuts priced in (from the Fed) through the year. The wash-up after today’s reopen is a market now pricing a 33% chance of a 50bp cut in September FOMC meeting. It’s a debate St Louis Fed President James Bullard sees as a real possibility.

There’s an ever-growing belief that Trump has no fear of risk assets declining, and the market feels vulnerable. The fact that many are seeing the division between Xi Jinping and Trump — as something more sinister than just a trade war — has seen calls for a global recession increase. With calls that what’s unravelling is more of an economic war, and while the further 5ppt increase in tariffs won’t help the perception of growth and US consumption, the concern traders have here is whether this even opens the top level of tariffs to over, say, 50%.
Trump changes the business landscape
The new news that’s clearly resonated is the increased restriction on the corporate landscape and how corporations do business going forward. By that I mean Trump’s calls for US businesses to pull out of China, as well as how that could impact their sales and net interest margins. We’re even hearing, at a worst-case scenario, that the US could restrict China’s access to the financial markets. That’s a genuinely scary proposition.
I’ve argued that Fed policy is about 50bp above the market’s perceived long-term neutral rate. The market knows that this is a Fed well behind market pricing — again, this just adds to the vulnerabilities. The nine rate hikes and USD $730bn in balance sheet normalisation have come to roost, and traders are talking about liquidity issues this week, with a USD shortage adding to the concern.
A poor liquidity environment is adding to the worries, and could be a headwind through markets this week.
Asia reacts
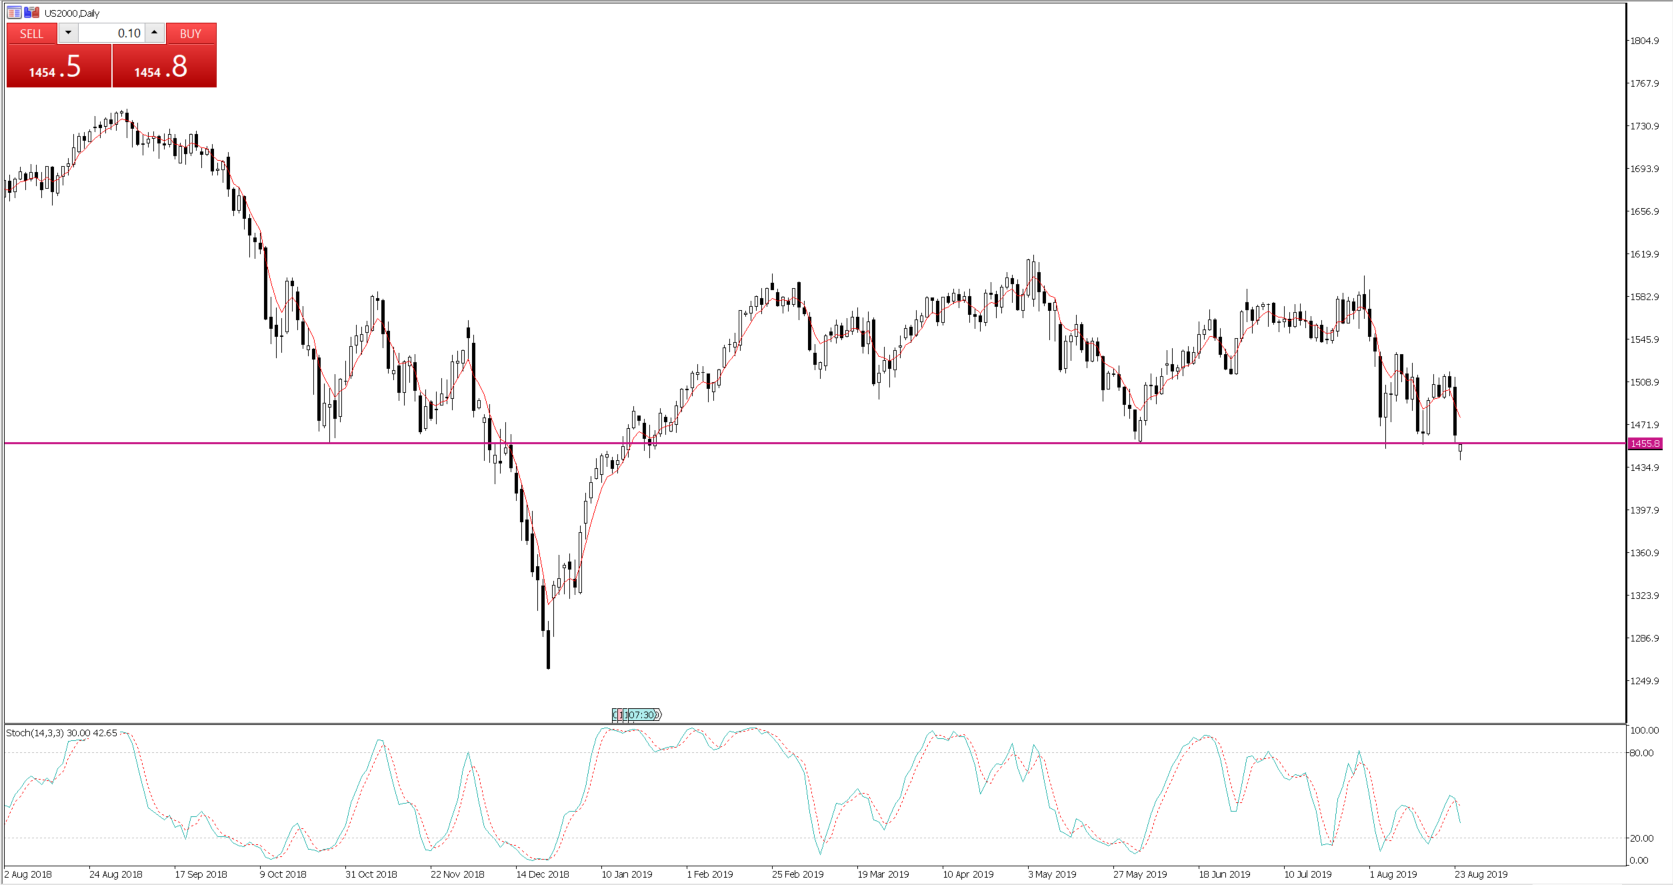
Asia-based traders have had their chance to react this morning, and it isn’t overly pretty. S&P 500 and NASDAQ futures are lower by 0.7% and 0.9%, respectively, although both have come off the early low. One chart I’ve got on the radar is the Russell 2000 (small cap index), where futures suggest the cash market opens just below strong horizontal support.

Asian equities have been hit hard, led by the Hang Seng, which has declined by 3.1%. That said, the Nikkei 225 isn’t far behind, with a decline of 2.3%, while the ASX 200 and CSI 300 are 1.5% and 1.3% lower, respectively.
FX vols have pushed higher, with traders piling into the JPY as the default hedge against all the protectionism. USDJPY is getting a real working over. Here, we saw the pair momentarily taking out the January flash-crash lows and into the weakest levels since November 2016, although buyers have seen the pair regain the 105 handle. The defence of these lows is interesting, but for how long?
Gold flying high
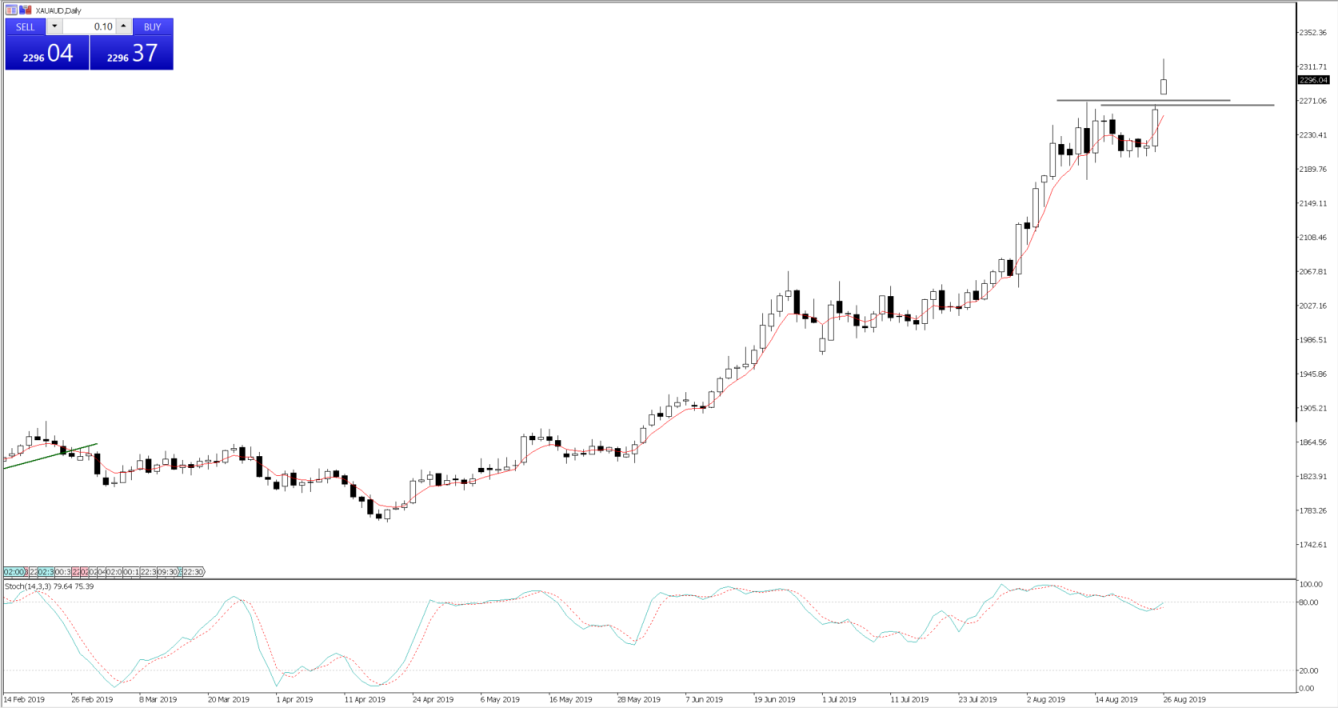
Gold has also worked well, finding buyers in all G10 currencies, with a new record high in AUD terms (XAUAUD). The fact we’re seeing bond markets finding even further love is key here — with the US 10-year Treasury -5bp on the reopen, to 1.48% and the lowest since 2016. If we inflation-adjust the benchmark Treasury, we see the real yield now at negative 5bp. And, again, gold will always work well in that environment. The trend is your friend here, but let’s see if the breakout can hold.

USDCNH has seen limited client flow, but there’s a lot of focus on the pair given the break to new highs. Importantly, the People’s Bank of China fixed the USDCNY midpoint at 7.0570 — two pips lower than Friday’s fix. But this was lower than the street's estimate of 7.0628, and we’re seeing sellers of USDCNH as a result. Once again, the PBoC could weaken its currency to a far greater degree, but its restraint has limited intra-day volatility.
One’d imagine that if USDCNH got a wriggle on, then calls for USD intervention would just ramp up. That means further gold and JPY upside — and currency wars!
It’s ironic that as USDJPY traded through the earlier flash-crash lows, the JPY crosses had a mini tantrum around 08:20 AEST, with our old-friend liquidity at the root of the issue. If I overlap USDJPY (yellow), USDCNH (red – inverted), TRYJPY (green), USDTRY (yellow – inverted), and AUDUSD (purple), we can see how the moves unfolded. While USDTRY and TRYJPY had some incredible percentage changes, it was probably USDJPY that cracked first, with algo’s following suit.
I’d imagine Japanese retail traders were busy unwinding carry structures, where there’s been a huge position build-up in long TRYJPY positions due to the extreme “carry” and swap rate differential.
So, capital preservation remains the name of the game, with Trump and Xi took the trade tensions to a new paradigm. No longer should we react to calls that talks are going well. It seems that in the near term, the only thing that’s going to turn this boat around is the Fed and, to a lesser degree, the European Central Bank getting ahead of the market. A positive Trump tweet would help of, course, but it doesn’t feel like the markets haven’t fully played their role yet.
The material provided here has not been prepared in accordance with legal requirements designed to promote the independence of investment research and as such is considered to be a marketing communication. Whilst it is not subject to any prohibition on dealing ahead of the dissemination of investment research we will not seek to take any advantage before providing it to our clients.
Pepperstone doesn’t represent that the material provided here is accurate, current or complete, and therefore shouldn’t be relied upon as such. The information, whether from a third party or not, isn’t to be considered as a recommendation; or an offer to buy or sell; or the solicitation of an offer to buy or sell any security, financial product or instrument; or to participate in any particular trading strategy. It does not take into account readers’ financial situation or investment objectives. We advise any readers of this content to seek their own advice. Without the approval of Pepperstone, reproduction or redistribution of this information isn’t permitted.
