CFDs are complex instruments and come with a high risk of losing money rapidly due to leverage. 72.2% of retail investor accounts lose money when trading CFDs with this provider. You should consider whether you understand how CFDs work and whether you can afford to take the high risk of losing your money.
- English
- Italiano
- Español
- Français

A lack of any demand for the GBP can’t be said for UK bonds, with the 10-year gilt trading into 65bp and eyeing a test of the all-time low of 50bp (set in August 2016). We’ve seen strong demand for the FTSE 100, which closed +1.8% — at the highest levels since August 2018 — on volume some 34% above the 30-day average. Given the moves in the GBP (in Asia), our FTSE 100 opening call of 7,707 suggests staying bullish on the index for now. The buying is taking place for no other reason than because the index works perfectly inversely to the GBP.
A political statement to EU from Johnson
The market has already seen Boris Johnson’s statement to the EU by his recruitment of a pro-Brexit line-up in his cabinet. But to detail that, unless the Irish backstop is completely removed from the equation, he won’t even head to Brussels for talks is meaningful. That just suggests unless we see the biggest political pivot in recent memory, we’ll head into the 31 Oct deadline on a stalemate, and the prospect of a no-confidence vote growing.
The market continues to upweight its election probability and, subsequently, raised odds of a no-deal Brexit — a fate UK cabinet minister Michael Gove stated “is now a very real prospect.” So, while it’s still not the base case in market pricing, the probability of a no-deal Brexit sits closer to 40%, and is rising. The GBP is getting chopped up, too. This is life as a political currency. Swimming in these waters can get pretty choppy even if the GBP is trending beautifully.
Brexit hedges becoming expensive
We can see in the GBPUSD three-month risk reversals that the demand for put option volatility is ramping up relative to call volatility, showing that traders are increasing their conviction of GBP downside into the Brexit deadline of 31 Oct. We can look at the skew of volatility as an insightful guide to sentiment, although it isn’t hard to see the poor sentiment in price action alone. But the trend for downside structures makes sense, and options traders’ biggest dilemma is whether they’re happy to pay up for what are increasingly expensive Brexit hedges.
Can ASX 200 close above 6,851?
When I look around the traps, we tend to gravitate to markets having the bigger percentage moves, especially those with a higher rate of change (ROC). However, I can’t go past moves in the ASX 200. While we can look down and see the ROC in the index hasn’t really exceeded one standard deviation since mid June, this is a perfect backdrop for investors, especially those who are in the market for income and generally prefer a grind, as opposed to an impulsive move.
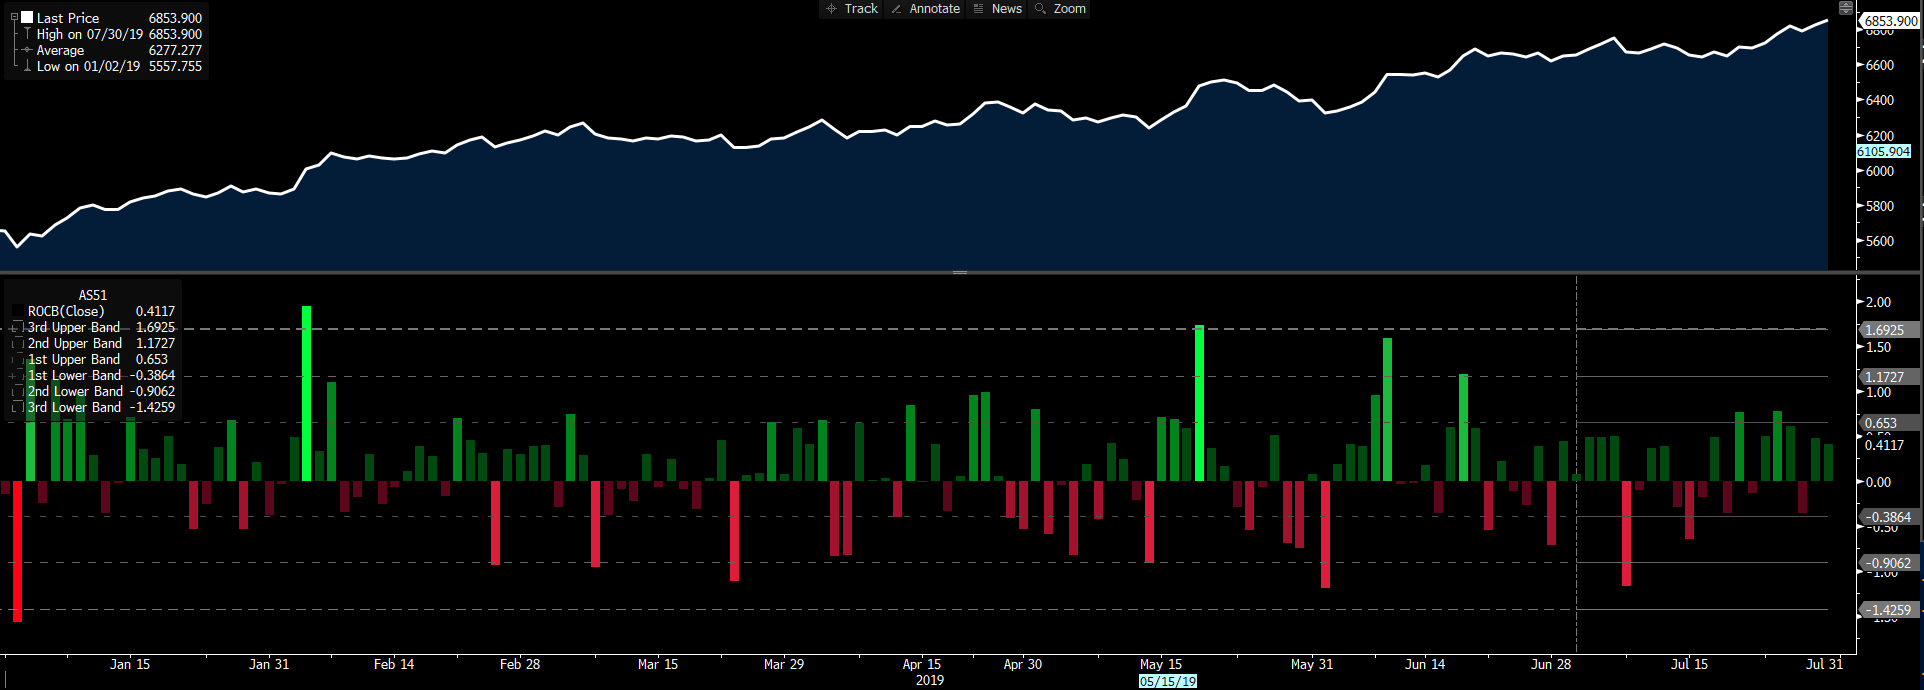
But a market at all-time highs should be seen for what it’s: bullish. In fact, the only aspect somewhat negative here is despite having traded to 6,875 (at 10:20 AEST), we’ve pulled back to test the November 2007 high of 6,851. While there’s still some time to the official close, the bulls will want to see a daily close above 6,851, as a close below will highlight a lack of conviction in the move higher, and could offer insights into the psychology of the market.
Like every other asset class, the index continues to look towards the FOMC meeting. But it’s almost as though the ASX 200 would benefit from a modest 25bp cut given the positive impact a falling AUDUSD is having on sectors such as healthcare. Consider the USD is also being driven on news that the US Treasury Department announced it’d issue US$433bil in debt issuance in Q3 — US$274bil higher than what we heard in April (see press release titled “Treasury announces marketable borrowing estimates” from the US Department of the Treasury). This brings its cash balance towards US$350bil, and is a short-term USD positive.
The golden backdrop for the ASX 200
So, the golden backdrop for ASX 200 appreciation is a lower AUDUSD, subdued implied volatility both in the equity market but also, importantly, in the Aussie bond market and, ultimately, lower bond yields. Aussie earnings season gets underway with Rio reporting on Thursday, although the meat of market cap reporting doesn’t start to affect us until 12 Aug. The valuation will always get some focus, then, for signs the outlooks (from CEOs) can help the index re-rate.
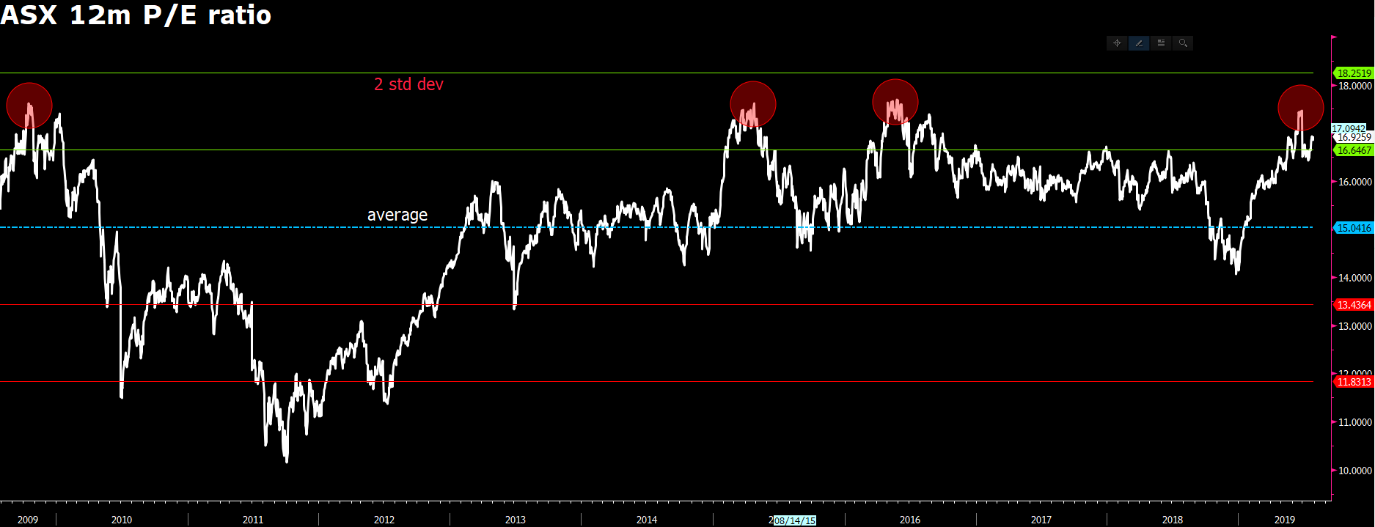
As we can see, the ASX 200 trades on 16.9x forward earnings, which is one standard deviation from the 10-year average. It isn’t cheap, but, as we can see, the key area to fade the index with conviction is into 17.5x to 17.75x.
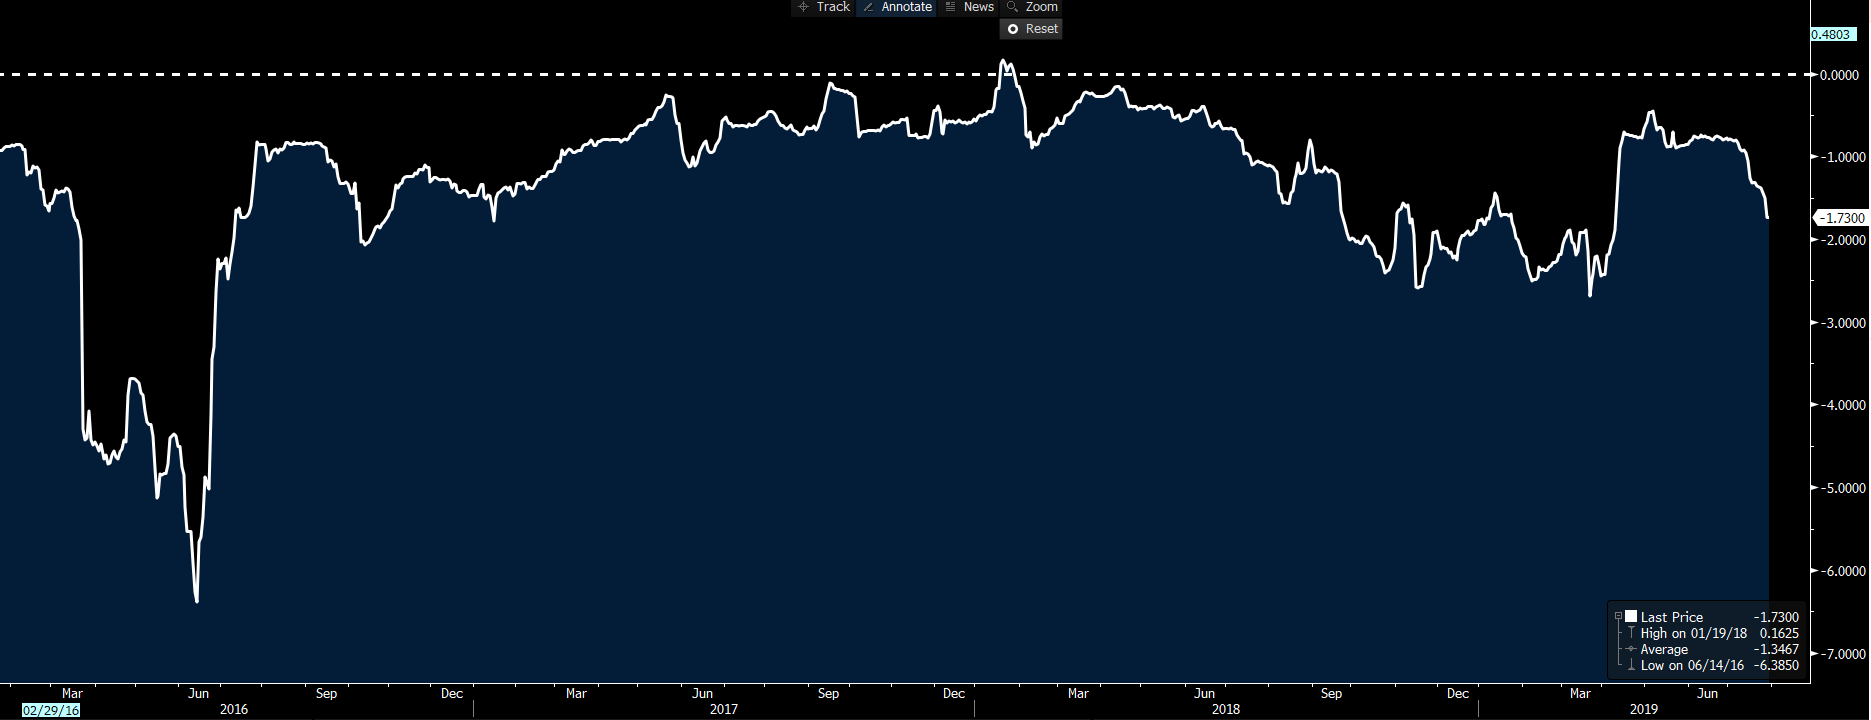
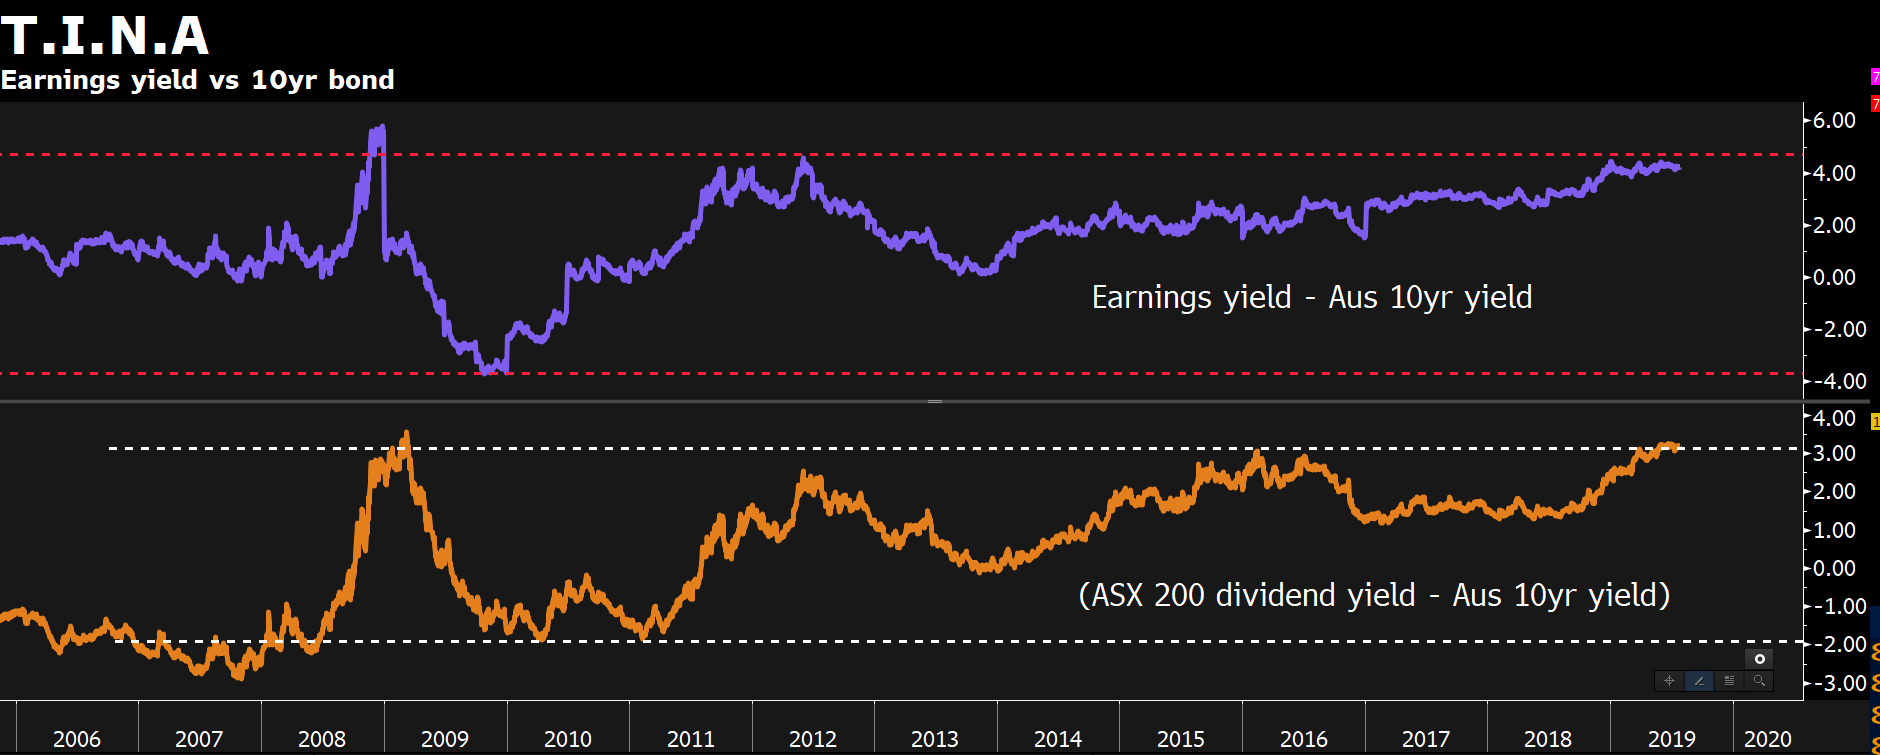
We see the Aussie 10-year treasury at 1.20% but adjusted for 10-year inflation expectations (i.e., break-evens). We also see real yields at -16bp — an all-time low. If we look at the Aussie equity market, we can subtract the Aussie 10-year treasury from the ASX 200 earnings yield. This differential sits at some 400bp (top pane) in favour of equities. The Aussie equity market is the mecca of yield in developed markets, and we see the differential between the index dividend yield and the Australian 10-year at this highest level since 2009.
In a world of relative returns, it isn’t hard to see the appeal of income in the equity market.
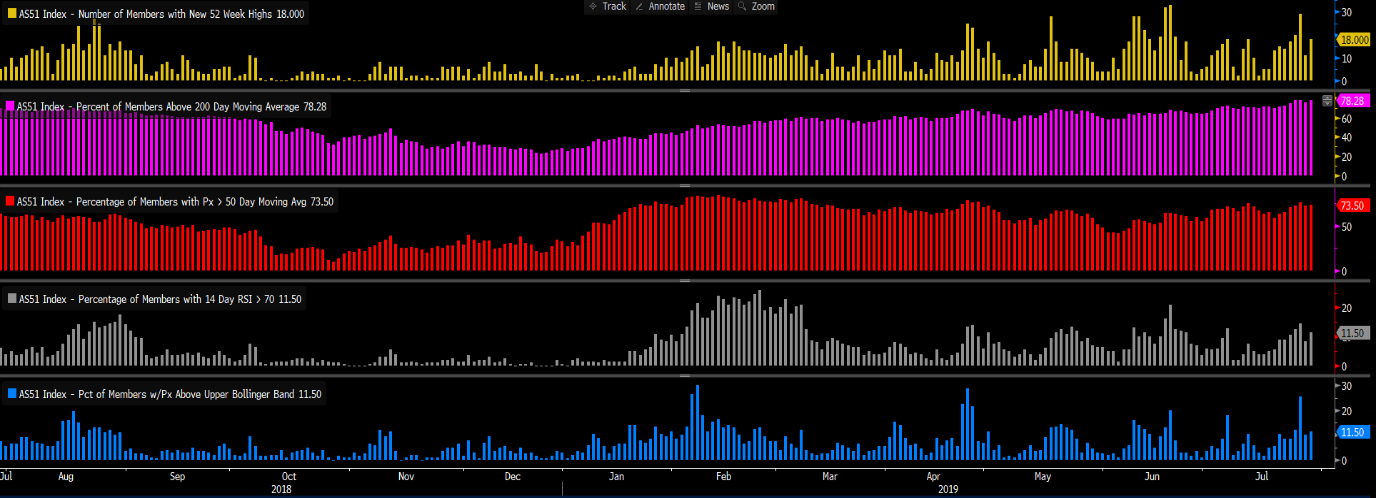
In fact, if I look at the market internals and go by the individual panes, I don’t see any clear signs of euphoria in the internals. I guess this is a function of the grinding nature of the tape over an explosive move, but there are no glaring sell signals here.
- Percentage of ASX 200 members at 52-week highs: 18%
- Percentage of member > 200-day moving average (MA): 78%
- Percentage of member > 50-day moving average (MA): 73%
- Percentage of members with an RSI >70: 11.5%
- Percentage of members with price > top Bollinger band: 11.5%
So what’s the risk?
The biggest risk to this bullish trend remains a sell-off in Aussie bonds, lifting yields and causing an unwind of the TINA (there is no alternative) hunt for yield. Marry this with a rise in implied volatility, and we have a risk aversion move, although the safety trade won’t be in bonds but gold, the JPY and CHF. However, a sustained sell-off in bonds seems unlikely, if at all — that’s the biggest risk to a sustained move lower in the ASX 200.
The material provided here has not been prepared in accordance with legal requirements designed to promote the independence of investment research and as such is considered to be a marketing communication. Whilst it is not subject to any prohibition on dealing ahead of the dissemination of investment research we will not seek to take any advantage before providing it to our clients.
Pepperstone doesn’t represent that the material provided here is accurate, current or complete, and therefore shouldn’t be relied upon as such. The information, whether from a third party or not, isn’t to be considered as a recommendation; or an offer to buy or sell; or the solicitation of an offer to buy or sell any security, financial product or instrument; or to participate in any particular trading strategy. It does not take into account readers’ financial situation or investment objectives. We advise any readers of this content to seek their own advice. Without the approval of Pepperstone, reproduction or redistribution of this information isn’t permitted.
