- English
- Italiano
- Español
- Français
- English
- Italiano
- Español
- Français
Analysis

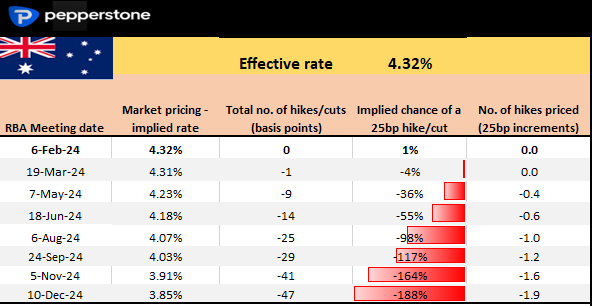
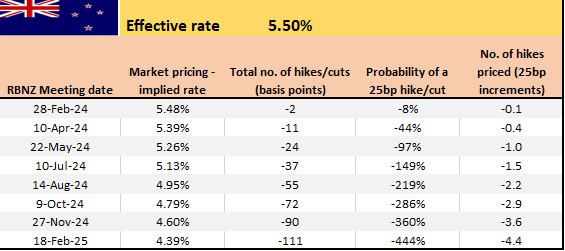
Looking ahead to 2024 from a rates perspective, I observe 90 basis points of cuts priced into NZD rates and 47 basis points into AUD rates, with this trend showing a modest shift in favour of AUD appreciation. Drilling in I see the first cut priced into AUS swaps set for August, with the RBNZ expected to start easing in May.
AUS & NZ swaps pricing per meeting
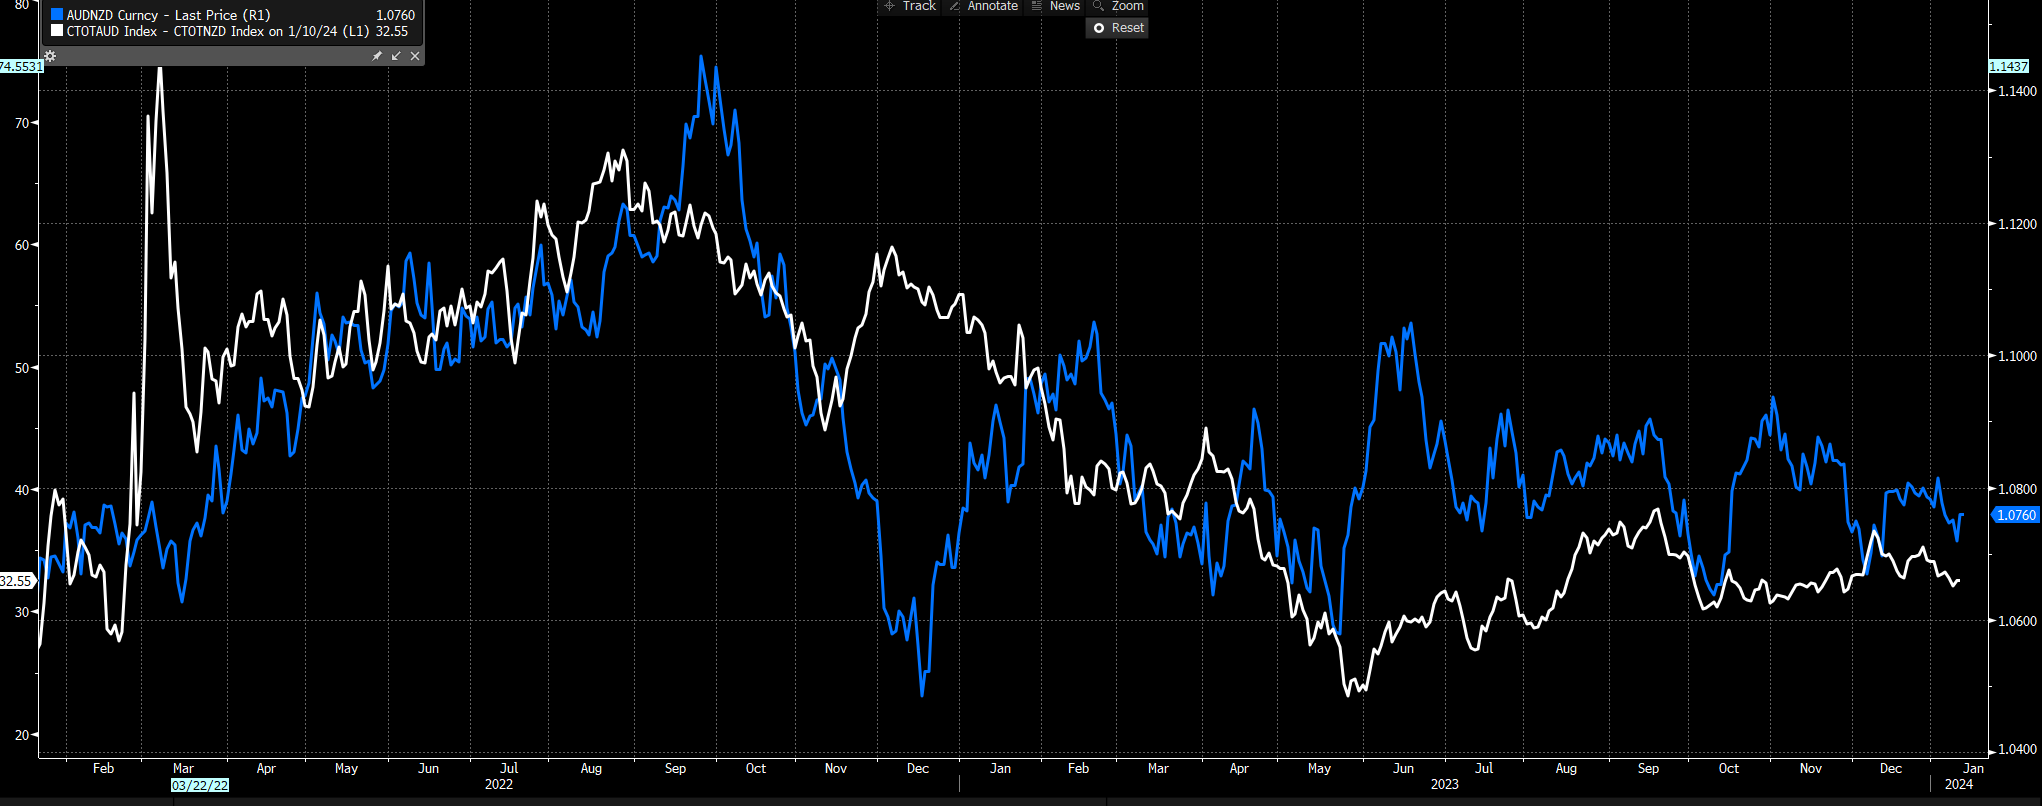
Tactically, both currencies are sensitive to China's news and data, and will often follow copper, China A50 index or CNH (yuan). Both currencies feed off the risk on/risk off theme, so when the NAS100 or US500 rally, we see the AUD &NZD follow suit. So, the move in AUDNZD really comes on relative economic trends and growth differentials – this appeals to certain strategies, especially those running mean reversion strategies.
In recent times Australian data has had a better form of beating consensus expectations than New Zealand data.
I can also look at relative terms of trade (the chart shows AUS-NZD terms of trade indices) with NZ terms of trade having outperformed of late, which favours modest AUDNZD downside – however, I would caution against reading too much into this given there is little correlation.
Technicals
Growth aside, we get trends in AUDNZD when we see diverging paths in central bank policy – we saw that in Sept 2022 to Dec 2022, resulting in a move from 1.1464 to 1.0500. As it stands, we see both central banks holding a similar mantra which partly explains the chop in the price action.
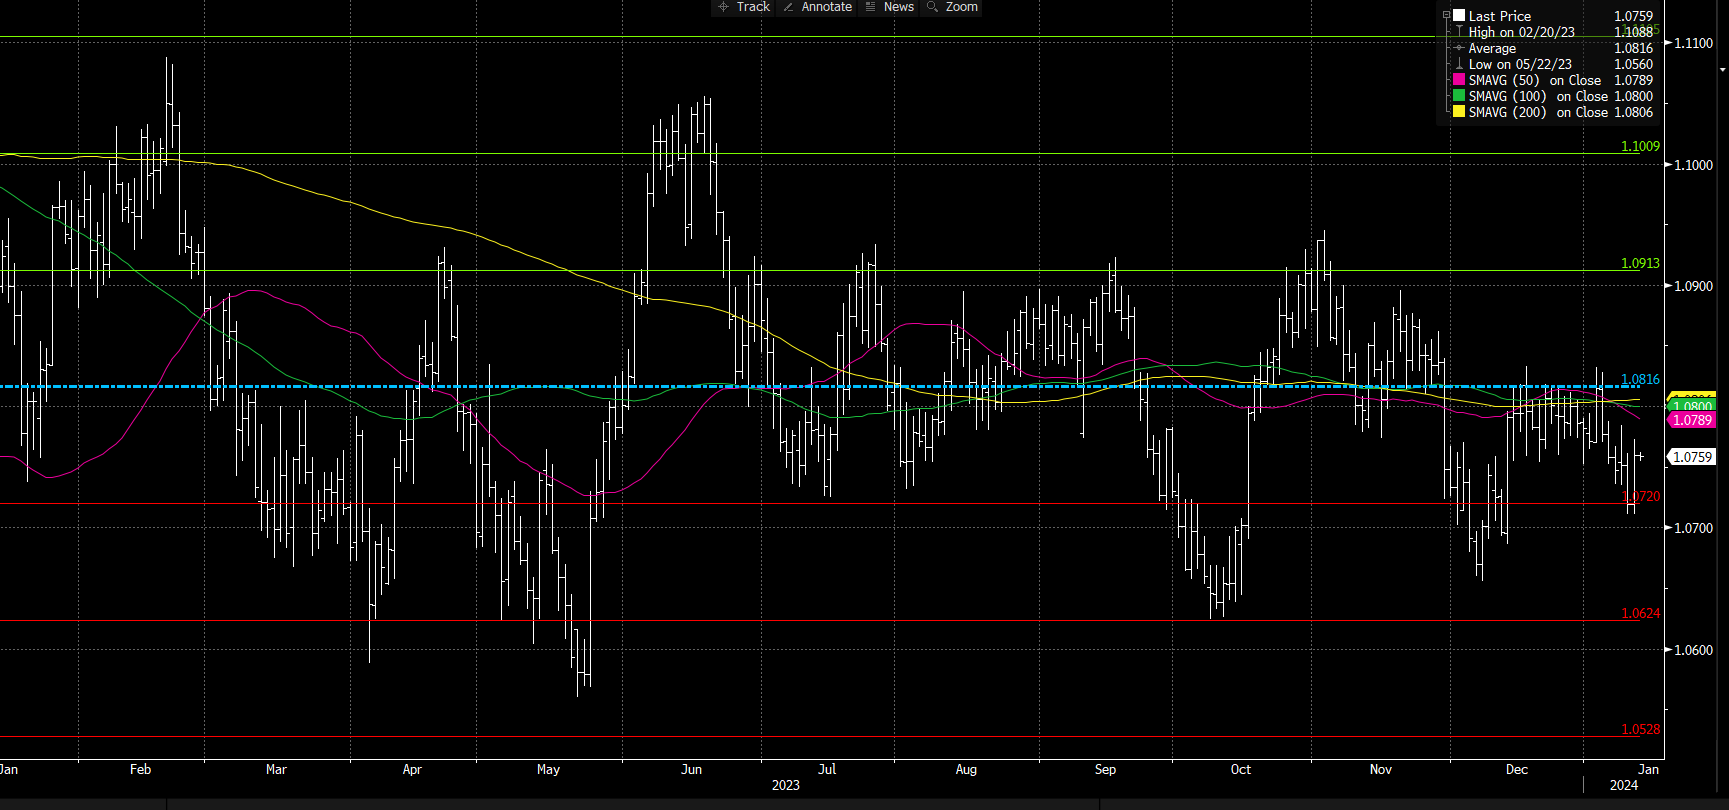
Looking big picture, we see price reverting to the 12-month average. I’ve added 1 and 2 standard deviations to this to show the extent of the moves from the average. While I wouldn’t trade off this concept in isolation, it gives a sense of when potential turning points could be – right now it feels like we could see price pull to the average at 1.0816. We can also look at this through Bollinger Bands and adapting to a 252-day count – the set up shows just how good this can be for mean reversion traders – albeit one should wait for price to reach extremes.
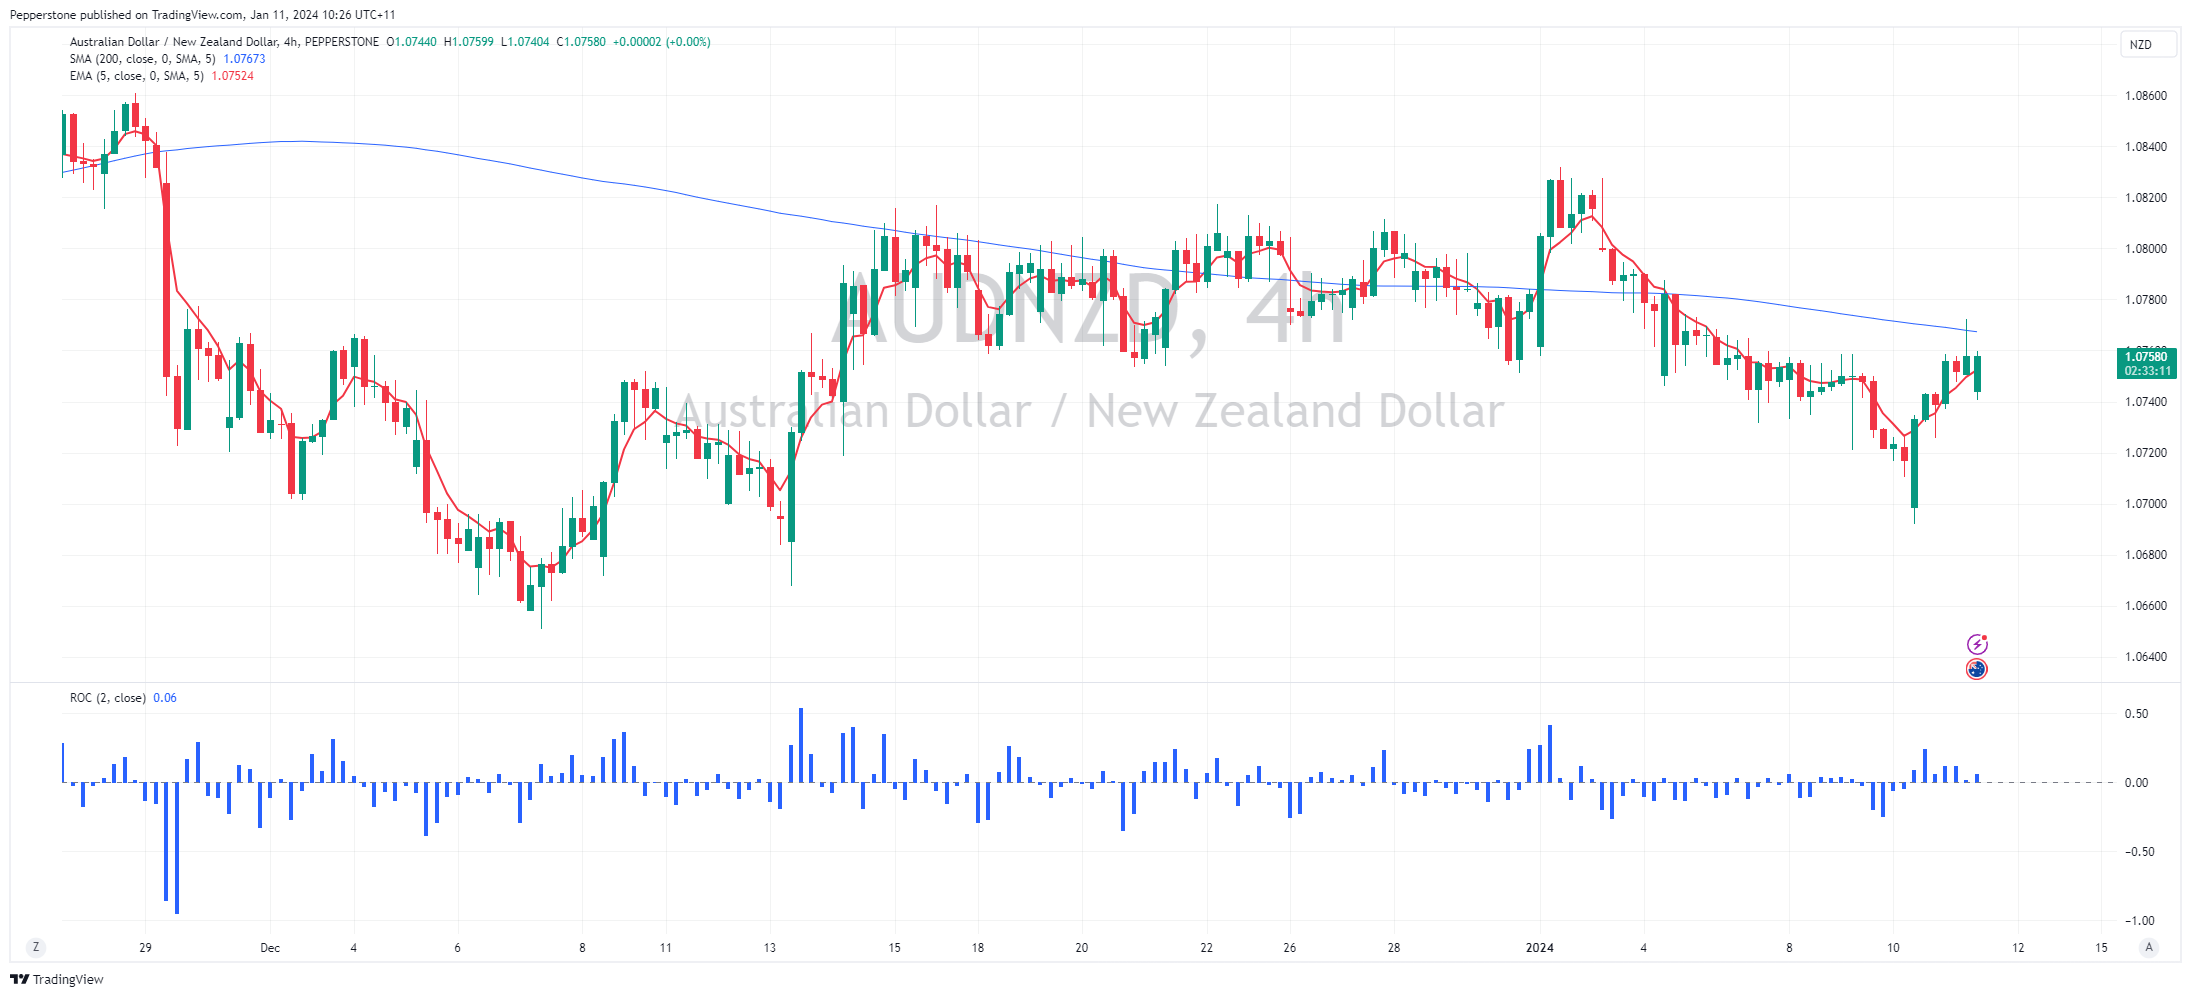
Shorter-term, yesterday’s bar just stopped shy of a bullish outside day, so I’d argue the bulls have a small advantage here. On the 4-hour chart, there’s been a fair bid from below 1.0700, so this would be where I’d define my risk on longs. If long I’d want to see another run through 1.0960 and jump on with the view that momentum could take this higher, but the upside seems capped at 1.0800 or so.
I like trends myself – and while we can drill into very low timeframes to get these – on the higher timeframes this is one where mean reversion is arguably the way to go.
Catalysts?
AUS – Not a lot of tier 1 data on the horizon, so I’d be looking more closely at Chinese data. We get the Aussie jobs report on 18 Jan and Q4 CPI on 31 Jan. The RBA meeting falls on 6 Feb, with the market pricing a 0% probability of a hike.
NZ – The next RBNZ meeting is on 28 Feb, but the market says hikes are not even a chance; it's about the timing of the first cut. Q4 CPI comes on 24 Jan, and that is the next tier 1 event risk.
Related articles


The material provided here has not been prepared in accordance with legal requirements designed to promote the independence of investment research and as such is considered to be a marketing communication. Whilst it is not subject to any prohibition on dealing ahead of the dissemination of investment research we will not seek to take any advantage before providing it to our clients.
Pepperstone doesn’t represent that the material provided here is accurate, current or complete, and therefore shouldn’t be relied upon as such. The information, whether from a third party or not, isn’t to be considered as a recommendation; or an offer to buy or sell; or the solicitation of an offer to buy or sell any security, financial product or instrument; or to participate in any particular trading strategy. It does not take into account readers’ financial situation or investment objectives. We advise any readers of this content to seek their own advice. Without the approval of Pepperstone, reproduction or redistribution of this information isn’t permitted.