- English
- Italiano
- Español
- Français
- English
- Italiano
- Español
- Français
A traders’ week ahead playbook – CPI to offer key insights for policy makers

Implied volatility matrix – sourced from options pricing, we see the 1-week implied volatility and assess the implied move (higher or lower) with a 68% level of confidence. This can tell us a lot about expectations of movement and help us with position sizing.
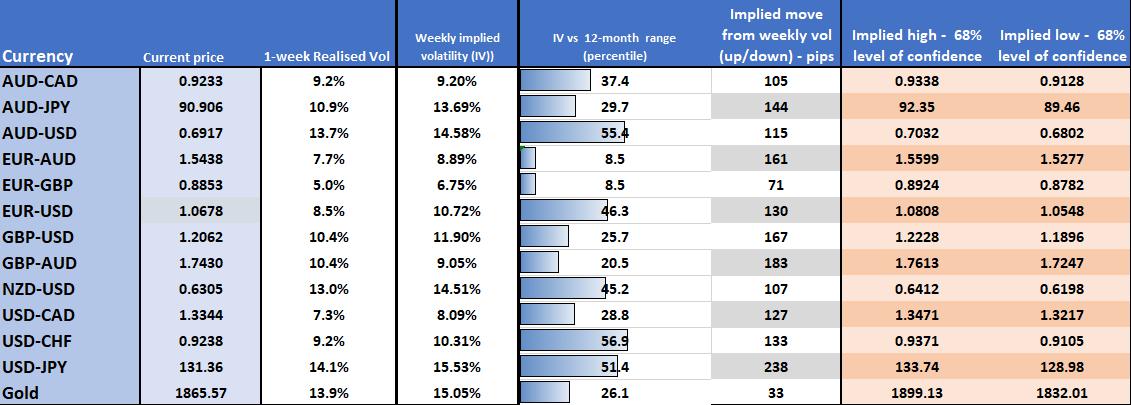
We also see the VIX index is only gently above 20%, the CBoE S&P500 put/call ratio holds a lowly 0.69, and rates volatility has risen a touch since 2 February, but is still well down since the October highs. In essence, the market seems ready to kick into gear if there is a shock, but they are somewhat confident they don’t get one.
We’re seeing a bit more chop come into broad-market trading conditions – this has meant more effective intraday mean reversion trading and less momentum/trend opportunity. Fundamentally, as we go through this period of change and re-assessment - with the market keen to know if this is really peak rates and what type of economic landing we get (hard, soft) - we’re all trying to price an outcome and risk, and when clarity is lacking, we get chop, as the collective wisdom in the market finds it hard to forge a consensus.
US CPI the marquee risk
That consensus may make up its mind on a US CPI print above 5.7% on core US CPI – it would certainly put the market on notice that either a 50bp hike is a possibility in the March FOMC, or potentially add another 25bp hike in June. With much of the talk recently of a big player betting on a 6% fed funds rate (through interest rate futures), a hot CPI print would get that trade working.
I’d say, however, the market is comfortable with its view we see 0.4% MoM / 5.5% YoY – it gets messy the higher we see inflation above 5.7% YoY print though and that’s where the market adds risk hedges and looks to get short risk in greater size.
Consider the raft of Fed speakers who get a say on how the US CPI print affects thinking – the market would have made its own mind up, but these speakers could offer key insights and inject further vol into markets.
The front end of the US Treasury curve is where the action is and that is starting to trend higher– so we’re watching US 2yr and 5yr Treasury’s – US 5’s interest most, with yields breaking the 100-day MA and eyeing a move into 4% - an outcome that would likely drive USD flows and take the DXY out of its recent consolidation and into a new trading range. EURUSD looks like we could see 1.0550/00 through the week if the CPI print comes in hot, and the market is running this short into the release. EURCAD is another play on the mind, which post Canada payrolls on Friday (150k vs 15k eyed) is getting good attention from shorts, as the market now looks ahead to Canadian CPI on 22 March and asks whether the BoC is premature to call an end to its hiking cycle.
UK data in focus
While UK jobs get focus, its UK CPI that could inject some volatility into the GBP, and which pose a risk for GBP traders – we see UK headline CPI expected to pull down a tad to 10.3% - a number that is just above BoE expectations and one that could cement a 25bp hike in March. Technical indicators on the GBP pairs seem quite neutral at this juncture and even EURGBP, which has pulled back from 0.8978, is finding the sellers harder to come by.
On the equity front, we see some de-risking of late, where China/HK is getting better activity to express a short bias – unless we see some renewed interest here, the HK50 could kick down to 20,100 and lower levels are my bias given the tape – a stronger USD wouldn’t sit well with Asia equity markets either. In the US the NAS100 is creeping back to the former breakout point of 12,100, so any further decline here will be keenly watched to see if the bulls step in to defend – one for the scalpers.
ASX200 earnings in focus
The AUS200 could be one index where we see correlations break from other DM equity markets and work on their own merits, with Aussie corporate earnings ramping up – there are a number of big names to watch, but CBA (report 15 Feb) is one I am watching closely here, with the market expecting cash to be handed back to shareholders with a $2.09 div. The balance sheet and asset quality, and general outlook on the credit environment have the potential to move broad markets.
Commodity views
On the commodity side, feeling neutral on XAU at this point, SpotCrude could have another look at $82.30, where longs are interesting above here for $90. Nat Gas is getting some attention from traders on the long side, but this is not my jam – it’s the wild west and position sizing is key when fading this sell-off. Palladium is getting smoked at this point, and for now, I am following the flow and see risks this trades further lower – when in doubt sell what’s weak and palladium is weak.
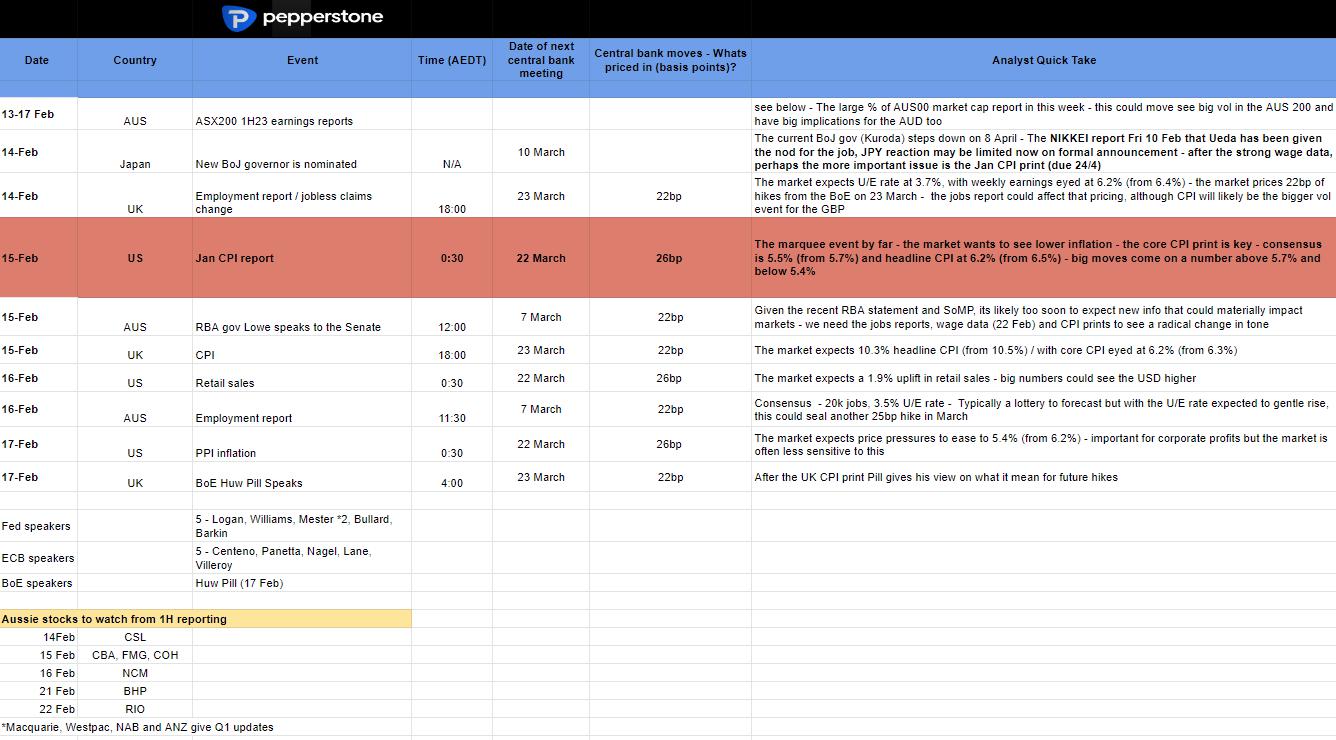
What’s on the radar this week?
Related articles

.jpg?height=420)
The material provided here has not been prepared in accordance with legal requirements designed to promote the independence of investment research and as such is considered to be a marketing communication. Whilst it is not subject to any prohibition on dealing ahead of the dissemination of investment research we will not seek to take any advantage before providing it to our clients.
Pepperstone doesn’t represent that the material provided here is accurate, current or complete, and therefore shouldn’t be relied upon as such. The information, whether from a third party or not, isn’t to be considered as a recommendation; or an offer to buy or sell; or the solicitation of an offer to buy or sell any security, financial product or instrument; or to participate in any particular trading strategy. It does not take into account readers’ financial situation or investment objectives. We advise any readers of this content to seek their own advice. Without the approval of Pepperstone, reproduction or redistribution of this information isn’t permitted.