- English
- Italiano
- Español
- Français
- English
- Italiano
- Español
- Français
Analysis

Names like Santos, BP, Schlumberger, and Woodside Petroleum are finding buyers and this sector is hot. I remain an energy bull and outside of meme stocks, I see this as the place to focus on especially for those who have a preference to trade from the long side, rather than two-way (long and short).
Petro-currencies are naturally outperforming, notably the CAD has been getting attention vs the USD, JPY and AUD. USDCAD is looking like it wants to revisit the 1.2000 level – the risk for USDCAD shorts being Friday’s US payrolls. CADJPY is one for the radar and a closing break above 91.04 should get the momo players out.
CADJPY 4hr chart
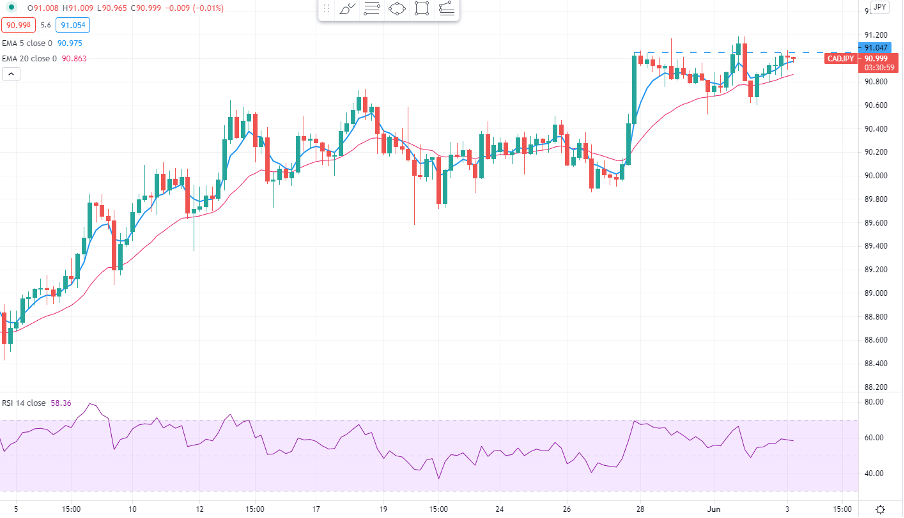
(Source: Tradingview)
As a CFD trader, I want to buy strong and sell weak. I'm cautious of the risks of buying into an overly loved, and extended move, but the edge in short-termism comes from moving in alignment with the flow of capital. Momentum trading is therefore ideal for CFD trading, although I also feel strongly about mean reversion strategies. However, in this situation I want to try and tilt the odds in my favour where I can and reading sentiment and flow are key – right now, sentiment towards crude is positive but not over-loved and energy equities are not over owned either.
SpotCrude is now the highest since October 2018 and on the daily chart is holding the positively trending 5-day and 20-day EMA and finding buyers on any pullbacks. I can take the timeframe down into 15 or 30 minute charts and trade momentum scalping strategies, but my first rule in any momentum strategy is that I want the daily candle to be green and price above the 5 and 20-day EMA and this defines a bullish bias even into the lower timeframes.
The risk v reward trade off matrix
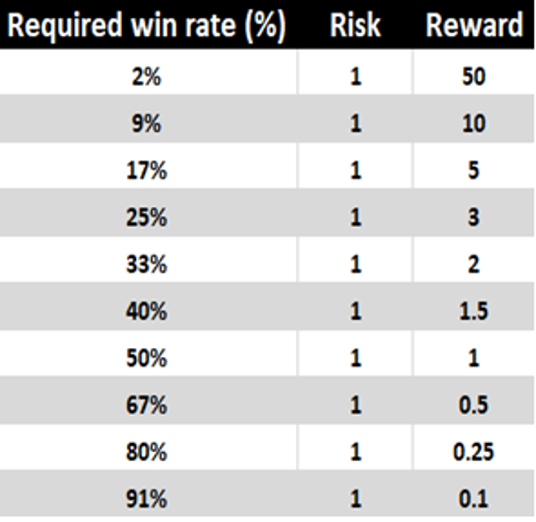
Can we get $70 US crude? I guess this is the target now, although for me targets are loose and preferably driven by the reward area (in the risk to reward trade-off). For me, it’s about trying to get at least a 2R, which means I can be right 33% of the time and still make money – holding winners should always be far harder than cutting losers.
So, the idea is to understand where in an ideal world I need to target, given my risk. This is defined by my stop loss, which then also dictates my position size – where the risk is defined by the volatility in the market.
SpotCrude 4hr chart
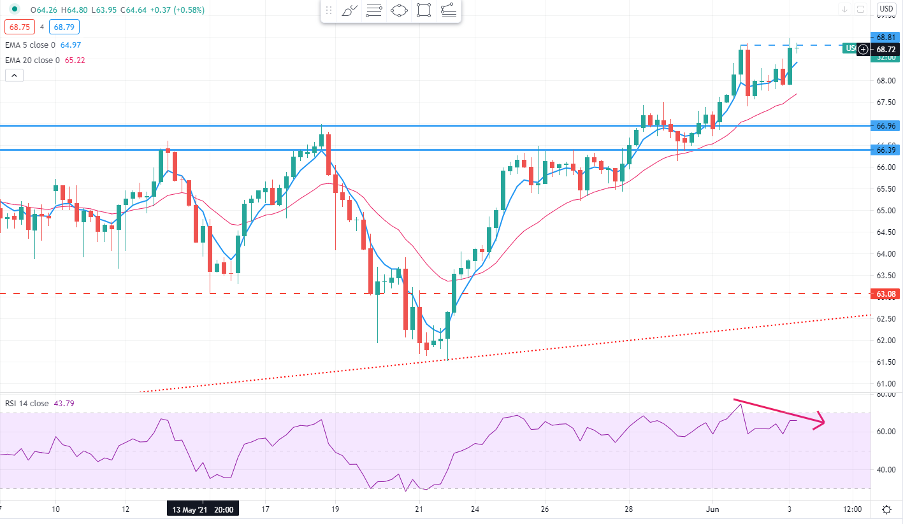
(Source: Tradingview)
Anyhow, price is moving higher on the higher timeframes and as we see from the series of RSI’s, the current standing is not at extremes. One aspect of concern I do have and one which I will monitor is the 4-hour chart (see above) where we see price finding supply into $68.80 and we see divergence (price vs RSI), which indicates risk of a modest reversal – one I would use to work longs into.
On the fundamental side, the futures curve is in solid backwardation – this means future contracts trade at a discount to spot. This indicates a tightness in the underlying market and incentives long positions as futures traders can roll into forward contracts at a discount upon expiry.
We also know there has been somewhat of a slowdown in the Iranian nuclear talks, so the market has pared back it's pricing of a near-term agreement to revive the 2015 nuclear deal. Amid a backdrop of positive demand improvement, with the Saudi’s talking about “clear signs of improvement”. We've also seen the International Energy Agency (IEA) detailing that US consumption may hit pre-pandemic levels.
So, Crude is hot at the moment, as are energy equities and the likes of the CAD. While holding a long bias on energy stocks, I would consider long US financials into Friday’s payrolls as a hedge or a barbell strategy effectively to capture the risk of a hot payrolls report. Ready to trade the opportunity?
Related articles


Ready to trade?
It's quick and easy to get started. Apply in minutes with our simple application process.
The material provided here has not been prepared in accordance with legal requirements designed to promote the independence of investment research and as such is considered to be a marketing communication. Whilst it is not subject to any prohibition on dealing ahead of the dissemination of investment research we will not seek to take any advantage before providing it to our clients.
Pepperstone doesn’t represent that the material provided here is accurate, current or complete, and therefore shouldn’t be relied upon as such. The information, whether from a third party or not, isn’t to be considered as a recommendation; or an offer to buy or sell; or the solicitation of an offer to buy or sell any security, financial product or instrument; or to participate in any particular trading strategy. It does not take into account readers’ financial situation or investment objectives. We advise any readers of this content to seek their own advice. Without the approval of Pepperstone, reproduction or redistribution of this information isn’t permitted.