7 Macro Charts that traders need to have on their radar
.jpg?height=93&quality=100)
Dollar:
The big news story for markets this week was Joe Biden’s potential doubling of Capital Gains Tax for investors earning over $1 mln a year. Systematic and algorithmic traders puked their positions on the headline, causing the S&P to be hit. Tax hikes were always on the cards, but I think this caught some off guard given the US economy, although, sequentially improving is still not fully out of the pandemic. The proposal certainly will get pushback in Congress in its current form. Will this push equity flows to other regions and hence at the same time lower dollar demand? The broad dollar index also came under pressure from a hawkish Central Bank of Canada who brought forward their rate hike expectations, causing a surge in the Loonie. The US 10-year has been in a tight range and currently sits on its 50-day SMA (a break of this could so a move lower), so this tailwind for the dollar has subsided for now, but if yields moved lower it may turn into a headwind for the greenback. However, the dollar still has some factors working its favour 1) Risk-off buying from an escalation in geopolitical risks and equity market corrections 2) Really strong economic data we should start seeing as Q2 unfolds 3) A more hawkish central bank relative to the ECB (important given the weight of euro in DXY). Jobs data out yesterday was mixed with Initial Claims coming in below expectations at 547K, but Continuing Claims came in slightly higher than expectations at 3674K. Today we will receive flash PMI numbers for the US, will be interesting to see if a strong number can help the dollar close strong into the weekend. Next week we have the Fed’s meeting and Q1 GDP for the US.
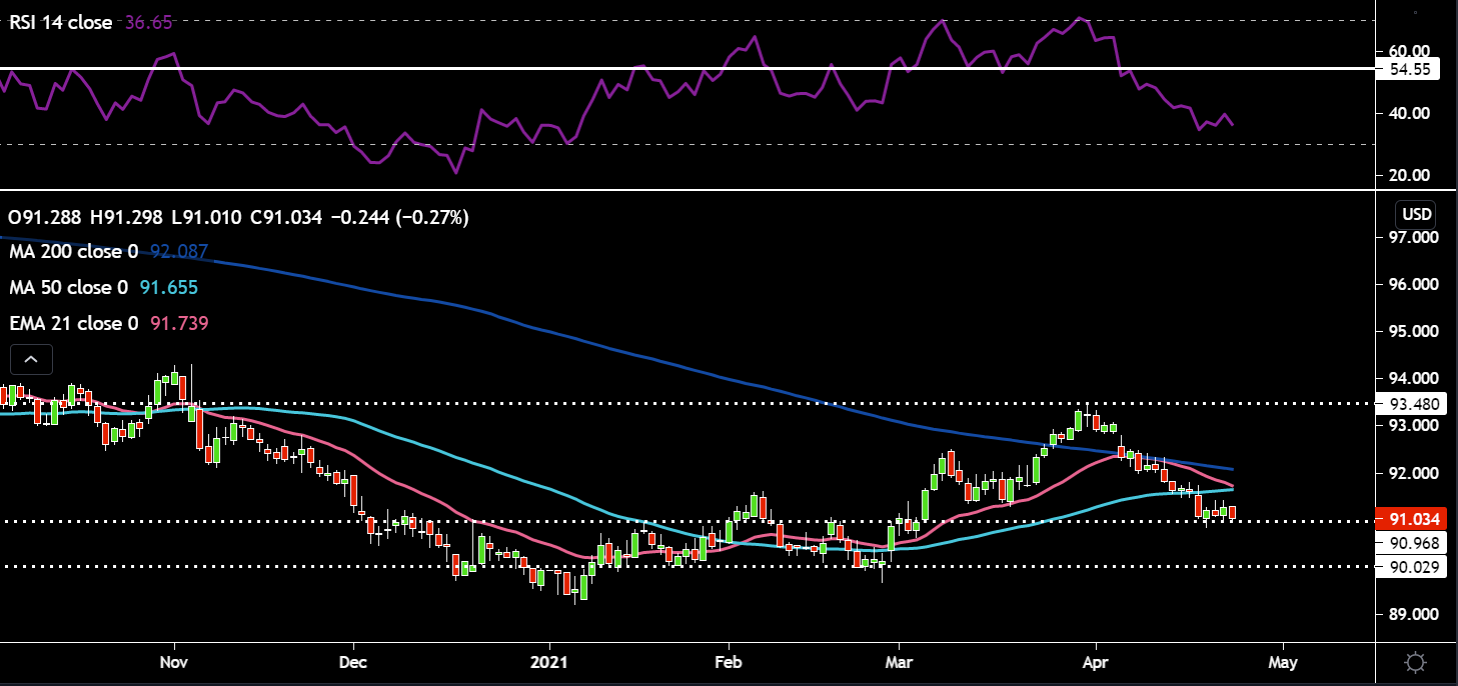
The technicals don't inspire much confidence for the dollar bulls as price has now sliced through the 50-day SMA and the March 18 low of 91.3. Bears and Bulls will be watching where price closes into the weekend – below or above the 91 horizontal support. The 21-day EMA has rolled over lower and looks like it cross below the 50-day SMA. The RSI is now substantially below the 54 support which held on prior price dips and is headed towards oversold territory. I've drawn in dotted lines around 93.5 and 90, which could be the barriers for a new range trading dynamic. If price can stabilize and move higher and we get a golden cross (50-day SMA above the 200-day SMA), DXY's prospects could turn around.
EURUSD:
The euro has been in decent form this week. Yesterday’s ECB meeting threw no curve balls at the market and traders turned their attention towards today’s Flash PMI numbers which came in strong beating expectations and help keep the optimistic euro narrative alive. Further to this, EU consumer confidence was better than expected as the vaccine campaign makes improvements and the reopening seems in sight. The German Constitutional Court also declared its support for the ratification of the recovery fund, which removes the risk of a delay in fiscal support. Mario Draghi also revealed a large recovery package to restructure Italy’s economy with substantial investment in various infrastructure projects. Next week we’ll receive Q1 GDP from Europe which will most likely be quite weak given the restrictions in place over Q1 in mainland Europe.
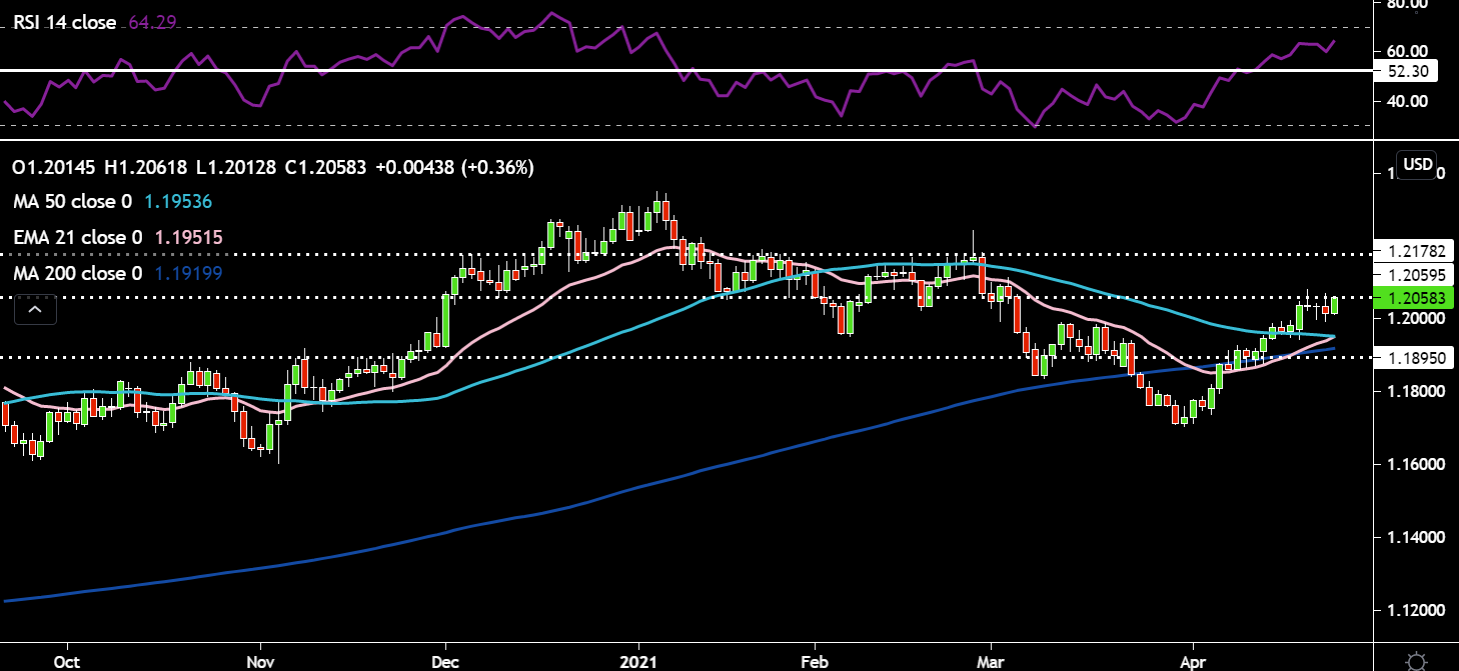
So far EURUSD seems to be holding its head above the 50-day SMA and having a go at the key 1.205 horizontal resistance level. The RSI has pushed through the 52 resistance which capped prior rallies in the downtrend and is marching higher towards overbought levels. If price pushes above the 1.205 level then 1.21/1.215 comes into play. The 21-day EMA is inches away from crossing above the 50-day SMA. The 50-day SMA is also above the 200-day SMA, albeit not by a significant amount. Downside support would be around 1.195 - both the 50-day SMA and 21-day EMA.
GBPUSD:
The UK retail sales numbers were much better than expected and PMI numbers particularly for the services sector were solid. Cable has seen a modest uplift from this, but a lot of this economic optimism is already in the price. There is nothing of significance for the pound in terms of data next week. However, there is a vote in the European Parliament next Tuesday to ratify the EU-UK trade agreement, which is expected to be an almost certainty. The excitement for sterling crosses resides in May with Scottish Elections and the Bank of England Meeting taking place on the same day – May 6. That Central Bank Meeting will carry more weight given we will receive updated economic projections.
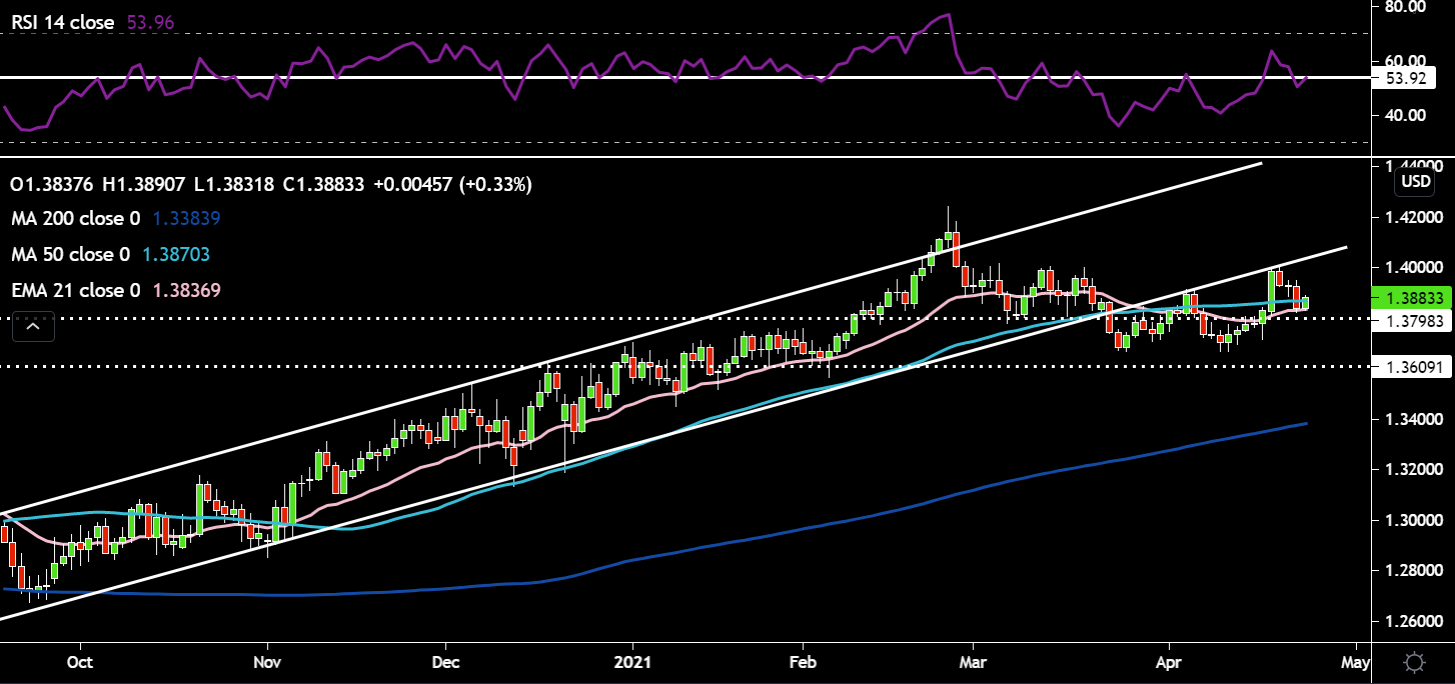
Price has broken above the range resistance at 1.38 and the double bottom pattern (bullish) looks like it could play out for Cable. The RSI had made some negative divergence, indicating selling momentum was weaker on this push lower. However, I’d like to see the RSI back above 53, price above the 21-day EMA & 50-day SMA and back in the ascending channel to feel more confident on longs. We can see price has been rejected twice as it moved up to the lower line of the ascending channel. The next move higher would face this and 1.40 resistance to overcome in order to be back in the channel.
USDJPY:
USDJPY has been moving quite a bit lower over this week as US yields continue to ebb and flow in a tight range, working in the Yen’s favour. The fact that Japan put a number of regions back into a state of emergency and the Yen still strengthened just shows how this cross’s movement is so dependent on yields in the US. Inflation rate data improved on the previous reading and came out in line with expectations on the core measurement.
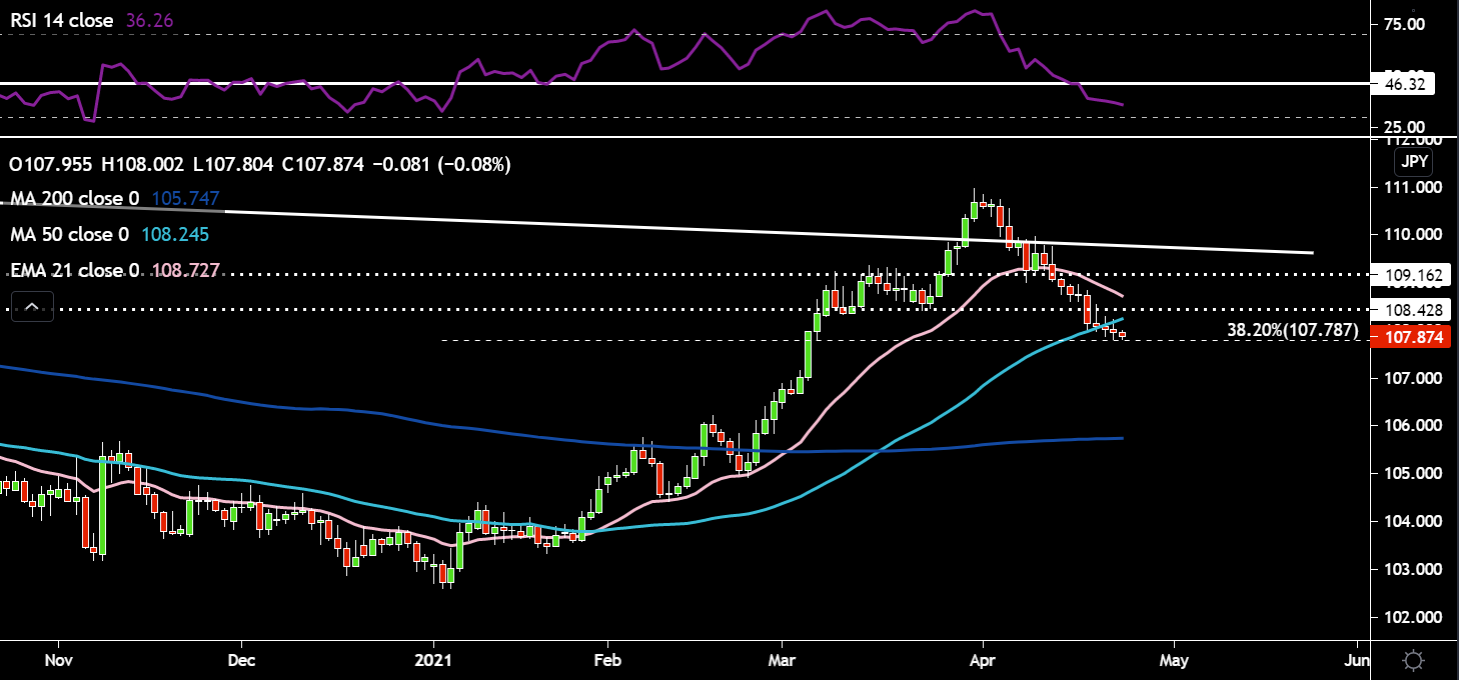
USDJPY has been offered all week. Price has sliced through range support around 108.4 and now sits precariously on the 38.2% Fibonacci retracement level. Price is also below its 50-day SMA. The RSI is below the key 46 support level and is edging closer to overbought territory. If you believe US yields will turn higher as strong US Q2 data hits the wires then USDJPY should resume its uptrend higher. 107.5 would be the next support level on the downside if price slides further, if we see a move higher again then former range support at 108.4 would become resistance.
Gold:
Gold struggled a bit as it got up to $1800. The shiny yellow metal has been on a good run of late as factors like a weaker dollar and lower real yields work in gold’s favour. Potentially some risk-off buying too as geopolitical tensions bubble under the surface. Recent data showed India’s gold imports have surged, however, could a very bad virus situation temper some of that demand going forward as fears over further lockdowns and job losses tighten consumers purse strings.
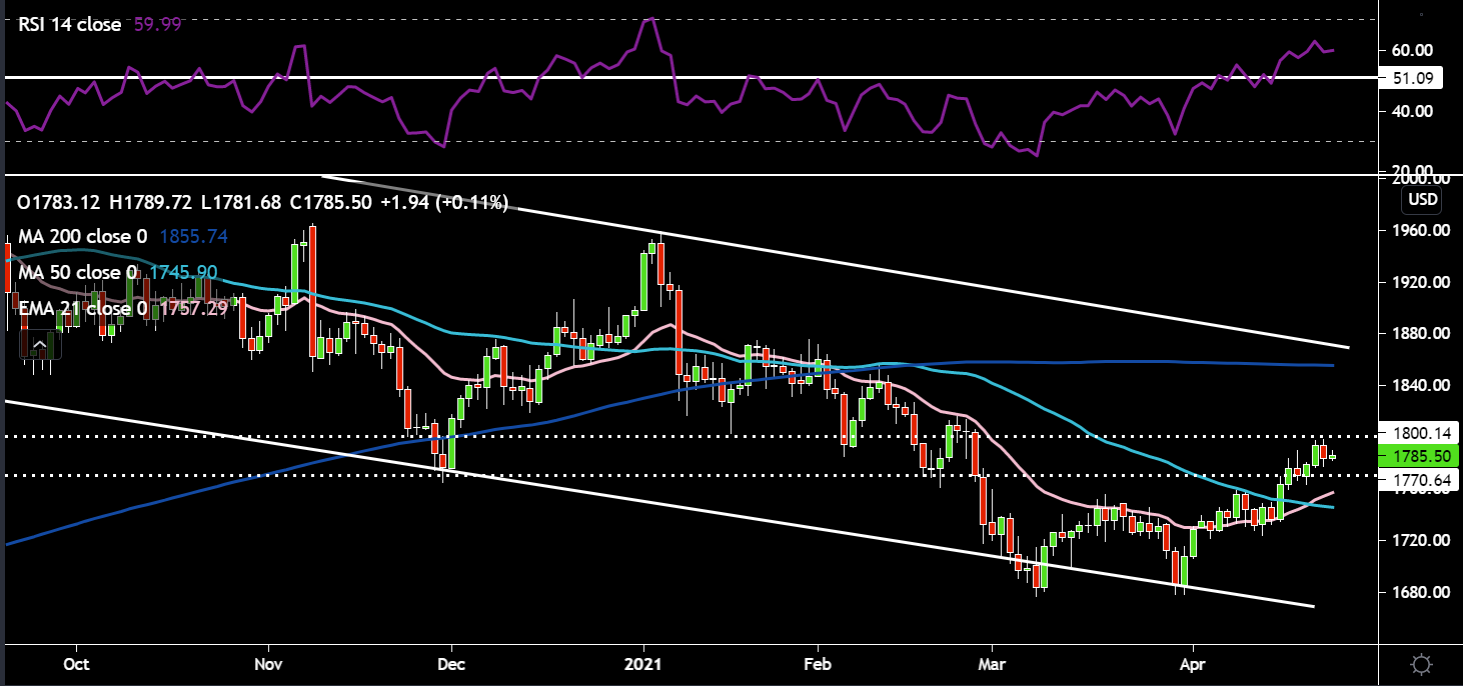
Gold is comfortably above the 21-day EMA and 50-day SMA with the 21-day EMA now crossing above the 50-day SMA. It does look like the mini double bottom pattern which formed over the last couple of weeks is playing out. If it plays out fully then price could move as high as $1825, coinciding with strong resistance at $1820. The RSI dipped briefly around the 51 resistance level and has now continued to march higher. $1800 is proving a bit stick for gold, with a decisive move through here potentially triggering some stops and causing short covering. On the downside, I'd look to $1770 and $1750 (50-day SMA and 21-day EMA) as support levels.
Oil:
Oil has struggled to continue its bullish price action this week as a variety of reasons act as headwinds. On the geopolitical front it looks likely that the US and Iran will reach an agreement as Iranian President Hassan Rouhani revealed the negotiating sides have already resolved 60-70% of key barriers that were problematic in previous discussions. Essentially, if sanctions are lifted it mean more oil supply will hit the market from Iran. India, the 3rd largest importer of oil are really struggling with their virus situation as daily record cases continue to be reported combined with a critical shortage of beds and oxygen. This will affect the demand side of the equation for oil. It has not been confirmed if an OPEC+ meeting will happen next week. Inventory data didn’t help the oil complex either as hopes for a 4th weekly crude draw were dashed as data showed builds instead.
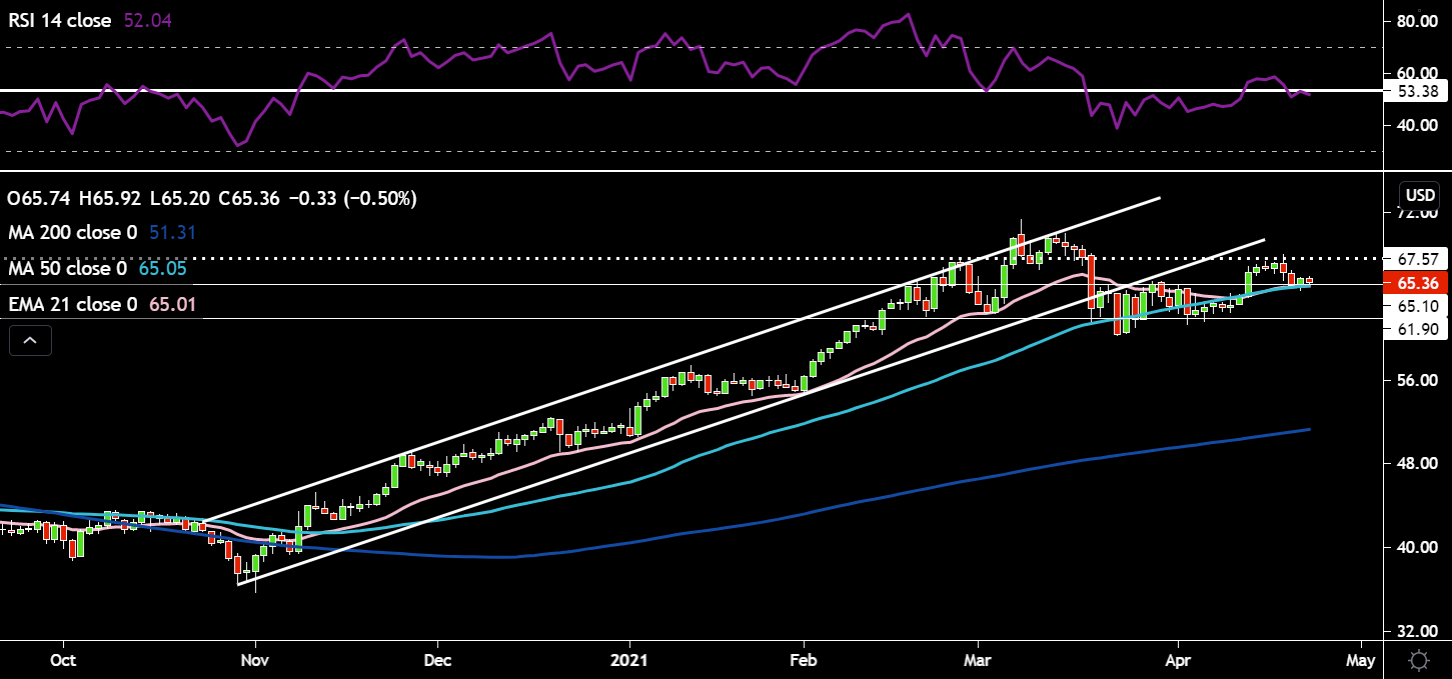
Price has returned to range resistance of $65 which it broke out of last week. Both shorter-term moving averages – 21-day EMA and 50-day SMA look to be turning up from their sideways movement. The 21-day EMA is inches away from crossing above the 50-day SMA. The RSI has perched its head above the key 53 resistance level, but is now just below it. It will need to remain above this “line in the sand” to continue its ascent higher. The first big price target higher comes in at $67.5, with further moves needing to break $69 to move back into the ascending channel. Once those levels are cleared the March 8 highs of $71.37 come back into play. To the downside I’d monitor the former range resistance which could now act as support around $65 (also the 21-day EMA and 50-day SMA). Below that the $62 range support would come into play. If price broke below the March 23 low of $60.3 then we could see some large selling given the lack of technical support until $56.
Bitcoin:
The digital currency’s sentiment has soured as price slices through the important psychological 50k level. I think this boils down to chatter of tighter regulation, Biden’s Cap Gains Tax Bitcoin, Turkey’s shock ban and weakness in Coinbase’s listing. There was also a report out from the Guardian, that NatWest will refuse service to business customers that accept cryptocurrency payments. I also think there has been some rotation out of Bitcoin into other alt coins (Ethereum shows this best as it dramatically outperforms Bitcoin). Combine all of this with key technical breaks and you have a potent cocktail for a move lower.
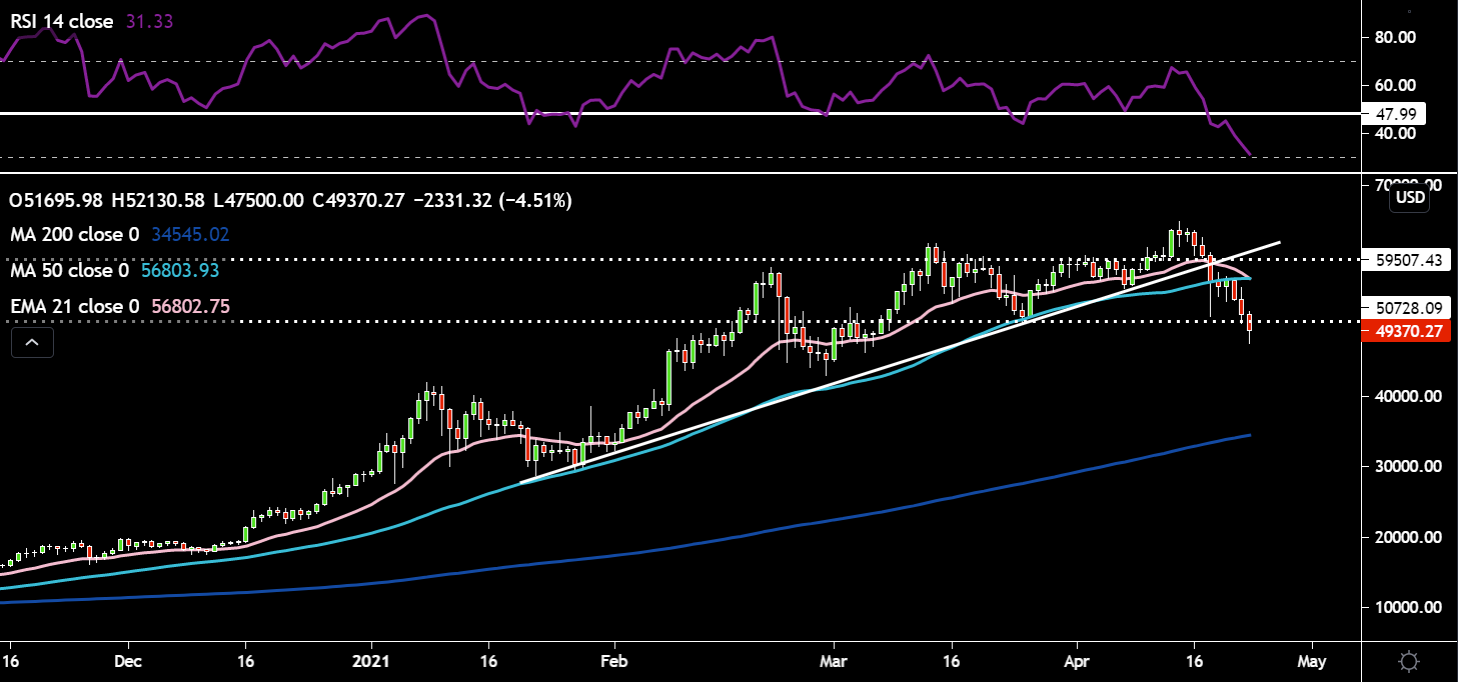
Bitcoin had broken through the range between $55500 and $59500. Price broke out to the topside as excitement around the Coinbase listing grew. New all-time highs were achieved just shy of 65k. But all these hard earned gains have been given back as price hovers around 50k. The RSI is far below the 48 support level and now is very near to oversold territory. It seems like the bearish signal from the negative divergence which formed on the RSI between the late February, March and April price highs has played out. This 50k level needs to hold or we could see further selling.
Related articles


The material provided here has not been prepared in accordance with legal requirements designed to promote the independence of investment research and as such is considered to be a marketing communication. Whilst it is not subject to any prohibition on dealing ahead of the dissemination of investment research we will not seek to take any advantage before providing it to our clients.
Pepperstone doesn’t represent that the material provided here is accurate, current or complete, and therefore shouldn’t be relied upon as such. The information, whether from a third party or not, isn’t to be considered as a recommendation; or an offer to buy or sell; or the solicitation of an offer to buy or sell any security, financial product or instrument; or to participate in any particular trading strategy. It does not take into account readers’ financial situation or investment objectives. We advise any readers of this content to seek their own advice. Without the approval of Pepperstone, reproduction or redistribution of this information isn’t permitted.