- English
- Italiano
- Español
- Français
- English
- Italiano
- Español
- Français
Analysis

SpotCrude – higher levels starting to impact risk
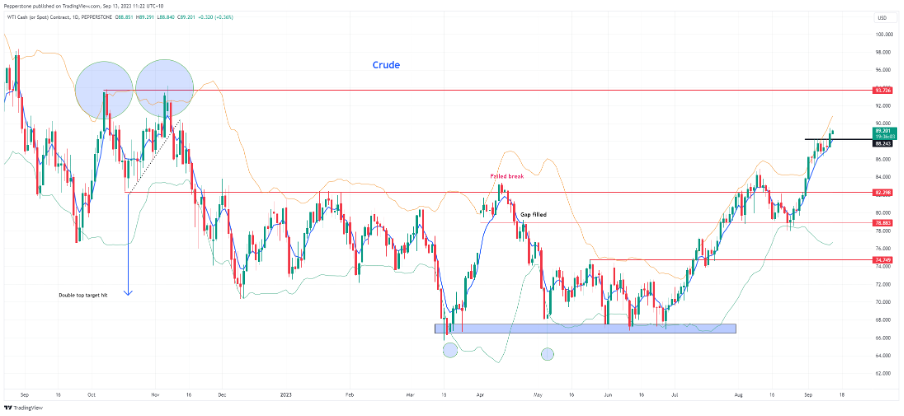
Further highs in crude have been seen in this momentum move. This time courtesy of some punchy OPEC forecasts for a 3.3m barrel p/d deficit in Q4. The IEA (International Energy Agency) are due to provide their update in the session ahead, and one can also expect a change in the forecast, given they previously pencilled in a 230k bpd deficit. $90 is the obvious round-number target for longs, ahead of the Oct 2022 highs of $93.52. Clients are biased to fade the move here though (61% of open positions are now held short), but while crude is certainly overbought one considers the trigger for a pronounced mean reverting move. Higher levels from here are likely going to increase market anxiety, where we see inflation expectations rising once again.
Long S&P energy / short (S&P retailers) (ETF’s - XLE / XRT)
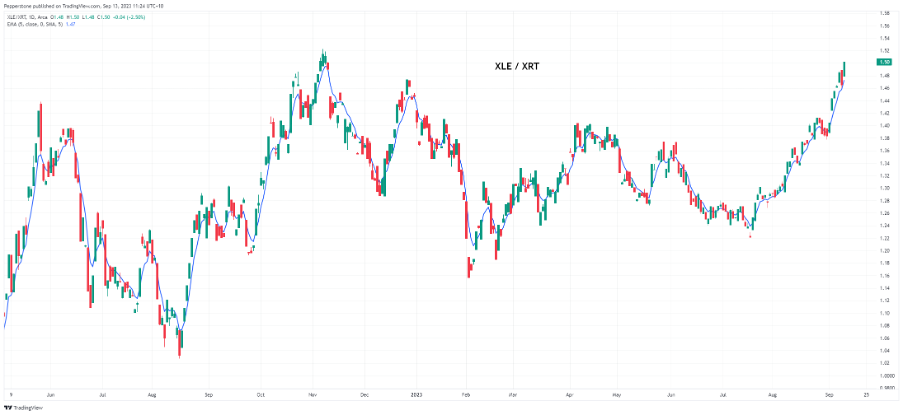
For the tactical traders who are looking at alternative expressions of crude, one can look at our range of ETFs (on the MT5 platform) to capture this. Adopting a long/short (or ‘pairs’) approach is one way to capture a thematic - going long the instrument you think will outperform and shorting the perceived underperformer.
By looking at ratio analysis (dividing one instrument by another) we can easily visualise the outperformance; TradingView facilitates this well. Here I’ve used the US retailer ETF (XRT) for the short leg, where higher crude will result in a higher cost of living for the consumer, but it will also increase the prospect of the Fed holding rates higher for longer. As we can see, the XLE ETF (S&P500 energy sector) has had a big outperformance already vs. the XRT – is there more juice in the tank?
XAUUSD – sellers getting an upper hand ahead of US CPI
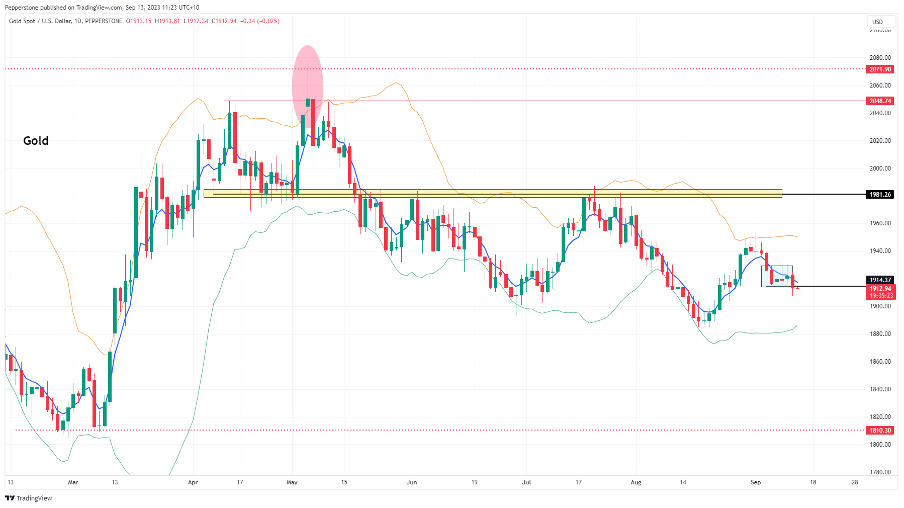
On the higher timeframe (daily) price action suggests the sellers have the upper hand – price is below the 5-day EMA and after a 3-bar consolidation, we see price looking to break these lows. Higher crude is, in theory, a negative for gold as it will weigh on bonds and push up yield. Subsequently, given the closing break of $1914, we can drill into the lower timeframes and if the sellers kick up again, momentum should put $1900 and $1884 into play.
US CPI – the form guide for gold
We look ahead at the US CPI print (today at 22:30 AEST) with consensus expectations eyeing 0.6% MoM headline CPI and 0.2% MoM on core CPI. Will the market be more sensitive and place more weight on the headline CPI print or core CPI?
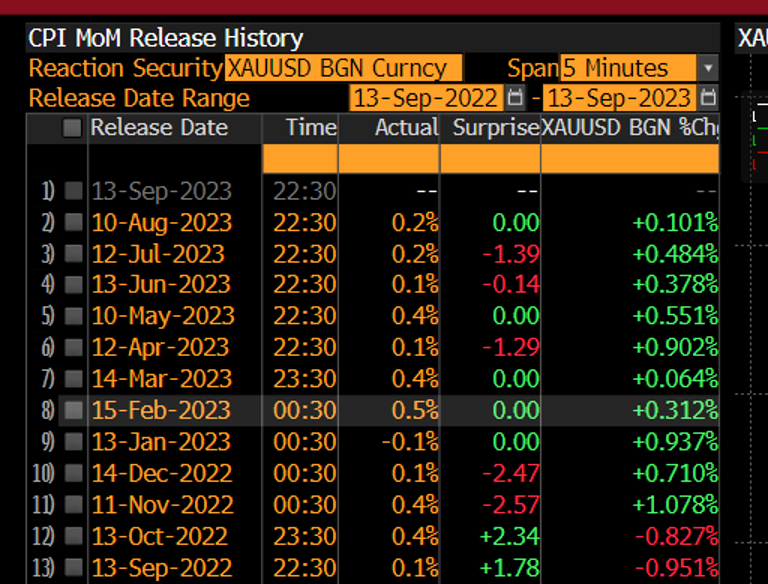
As always, there will be a strong focus on the core services ex-shelter component (expected to increase 0.39% MoM), which the Fed look at closely, as well as core goods (-0.22% MoM). Interestingly, we see the USD has lost ground in 9 of the past 10 US CPI reports in the 5 minutes after the announcement. We also see that XAUUSD has rallied in each of the past 10 CPI announcements, over both 5- and 30-minute periods. Is this time different?
CADJPY – holding for 109.50
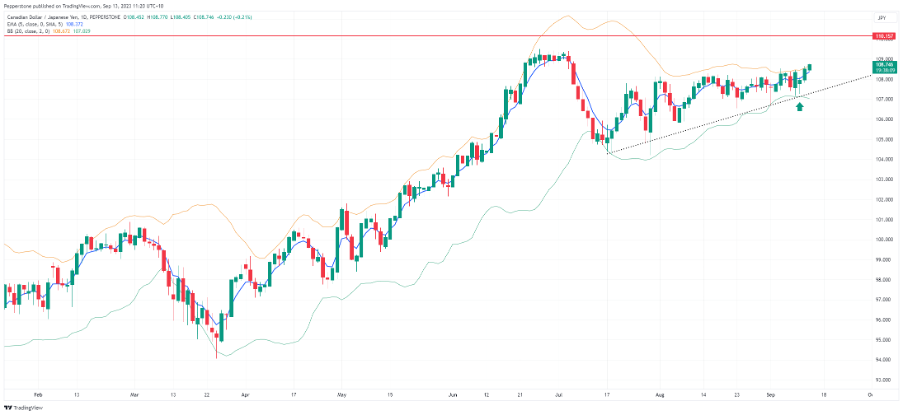
While NOK (Norwegian krone) has the strongest statistical relationship with Brent and WTI crude, we can see a strengthening correlation between crude and the CAD. We see the 1-month correlation between crude and CADJPY at 0.68, so it's meaningful. We also see (on the daily) price breaking out of the top of its recent range of 108.50. While many will be concerned with being short JPY, given BoJ intervention risk, for now, traders remain happy to fade JPY strength as carry is still attractive (given the low volatility). Also, with crude on the rise the market sees this benefiting Canada’s terms of trade, while it negatively impacts Japan’s economics given, they are a big importer of energy. Happy to hold for 109.50, stops on a daily close below the 5-Day EMA.
Related articles


_(1).jpg?height=420)
The material provided here has not been prepared in accordance with legal requirements designed to promote the independence of investment research and as such is considered to be a marketing communication. Whilst it is not subject to any prohibition on dealing ahead of the dissemination of investment research we will not seek to take any advantage before providing it to our clients.
Pepperstone doesn’t represent that the material provided here is accurate, current or complete, and therefore shouldn’t be relied upon as such. The information, whether from a third party or not, isn’t to be considered as a recommendation; or an offer to buy or sell; or the solicitation of an offer to buy or sell any security, financial product or instrument; or to participate in any particular trading strategy. It does not take into account readers’ financial situation or investment objectives. We advise any readers of this content to seek their own advice. Without the approval of Pepperstone, reproduction or redistribution of this information isn’t permitted.