- English
- Italiano
- Español
- Français
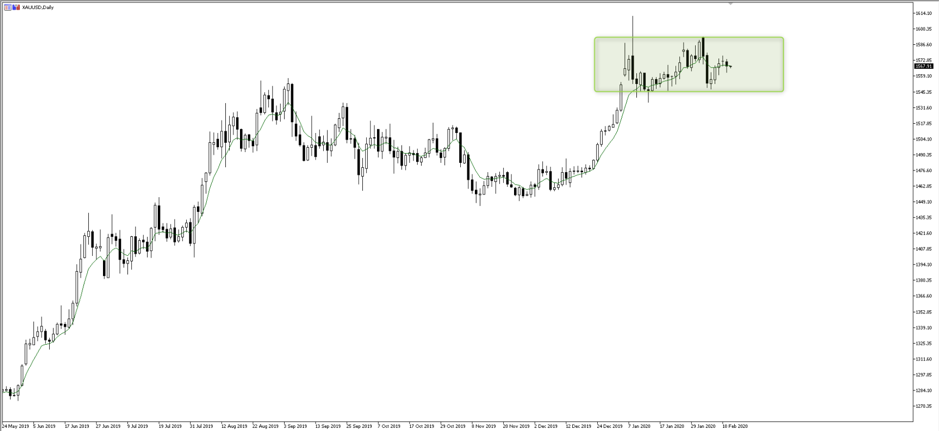
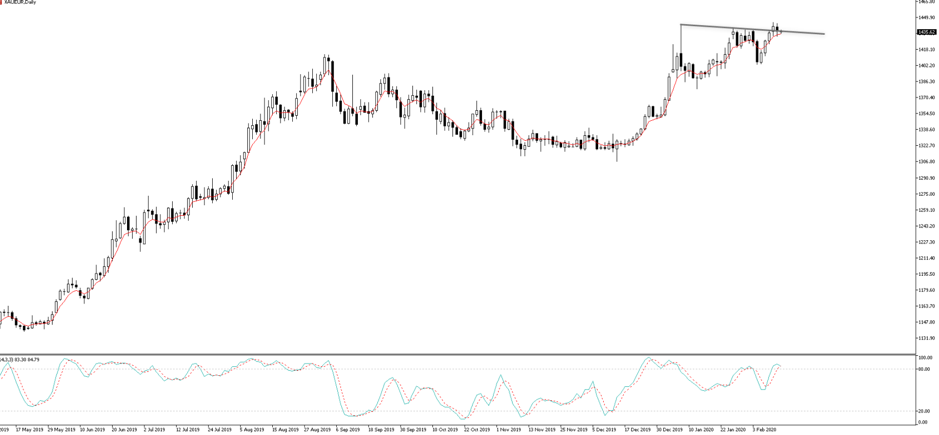
Going long of gold in AUD or EUR terms has been the better trade, as both AUDUSD and EURUSD have pulled back to test multi-year lows – although, we are now seeing better buying creep into these two majors. Any short-covering reversal in the short-term may suggest that gold in USD terms may be a better long this coming week. But, at this juncture we see price oscillating in this $1550 to $1595 range and until price can definitively break in either direction I have gold on the watch list.

Gold in EUR term

Price is always our best guide, as it aggregates all types of flow, and for all the many reasons why people choose to buy and sell gold – as discussed, this suggests holding a neutral bias for now. However, I have also looked at 1-month risk reversals (1m call minus put volatility), volatility spreads and CoT positioning and they are also giving me a neutral stance on the yellow metal – I explain this in greater depth in the video.
The fact we have falling real Treasury yields is helping gold, but the VIX index has also pulled back to 15%, while equity markets march higher – In this messy backdrop, it’s not hard to see why price is moving sideways.
Price aside, for fundamental traders who want to know the cause of an instrument going from A to B I have laid out a correlation matrix, looking at a number of key drivers of the gold price and assessing the influence here. Once again, the combination of moves in the bond markets and USDJPY are where I would be looking as the prominent drivers, with a strong inverse relationship – USDJPY down, gold up.

I hope the video above offers some perspective, and for clients with questions do reach out.
Ready to trade?
It's quick and easy to get started. Apply in minutes with our simple application process.
The material provided here has not been prepared in accordance with legal requirements designed to promote the independence of investment research and as such is considered to be a marketing communication. Whilst it is not subject to any prohibition on dealing ahead of the dissemination of investment research we will not seek to take any advantage before providing it to our clients.
Pepperstone doesn’t represent that the material provided here is accurate, current or complete, and therefore shouldn’t be relied upon as such. The information, whether from a third party or not, isn’t to be considered as a recommendation; or an offer to buy or sell; or the solicitation of an offer to buy or sell any security, financial product or instrument; or to participate in any particular trading strategy. It does not take into account readers’ financial situation or investment objectives. We advise any readers of this content to seek their own advice. Without the approval of Pepperstone, reproduction or redistribution of this information isn’t permitted.
