How to trade the markets during a recession
Navigating a recession requires a strategic approach. This guide provides insights on market indicators, risk management, and effective trading strategies to help make informed decisions and improve chances of profitability despite economic downturns.
The market mostly relies on the guidance of the National Bureau of Economic Research (NBER) to determine when a US recession has occurred. What matters is a combination of factors – depth, duration, diffusion – and readings from a variety of economic indicators, not just GDP. The NBER's traditional definition of a recession is that it is a significant decline in economic activity that is spread across the economy and lasts more than a few months. Early identification involves monitoring the following indicators regularly and analysing trends for deviations from normal patterns:
Declining GDP:
Aside from the NBER a more traditional definition of a recession is typically regarded as two consecutive quarters of negative GDP. Monitor quarterly GDP reports for early signs, although it is often said that in most cases an economy is already coming out of a recession by the time it is actually reported.
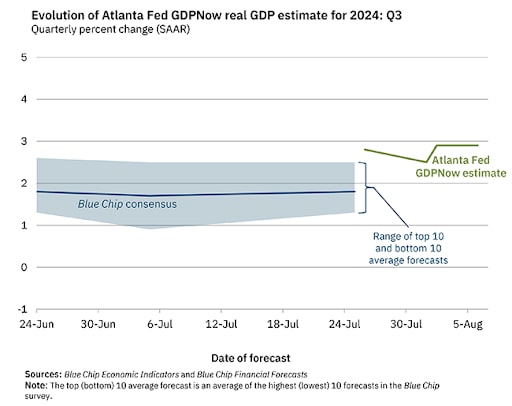
The Atlanta Fed GDPNow is a real-time forecasting tool developed by the Federal Reserve Bank of Atlanta. It provides up-to-date estimates of U.S. GDP growth based on current economic data and trends. This model offers a dynamic projection, frequently updated to reflect the latest economic information and conditions. The estimate tends to be fairly accurate since it relies on techniques to calculate economic growth similar to those used by the official prognosticators at the Bureau of Economic Analysis
Rising Unemployment:
Increasing jobless rates suggest economic trouble. Track monthly unemployment figures for evidence of changes in unemployment levels. See What is the Non-Farm Payrolls (NFP) report as well as The Sahm recession indicator which is based on employment data:
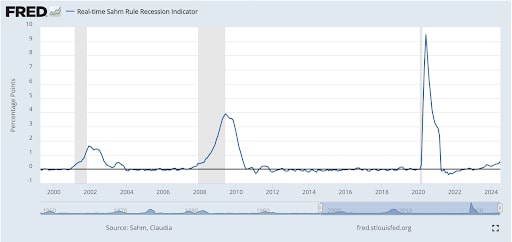
The Sahm Recession Indicator signals the start of a recession when the three-month moving average of the national unemployment rate rises by 0.50 percentage points or more relative to the minimum of the three-month averages from the previous 12 months.
Falling Consumer Confidence:
Reduced consumer spending and confidence indicate economic strain. Watch for drops in consumer sentiment surveys. There are some economists and agencies that consider it a lagging indicator, or one that changes after another related economic variable changes. Other organisations, such as the OECD, consider it to be a leading indicator.
Arguably the best consumer sentiment indicator to monitor for evidence of a downturn in activity is the University of Michigan Consumer Sentiment Index (MCSI). The MCSI reflects consumers' expectations about future economic conditions; it often provides an early signal about the direction in which the economy might be headed. This makes it a leading indicator, as changes in sentiment typically precede changes in actual economic activity.
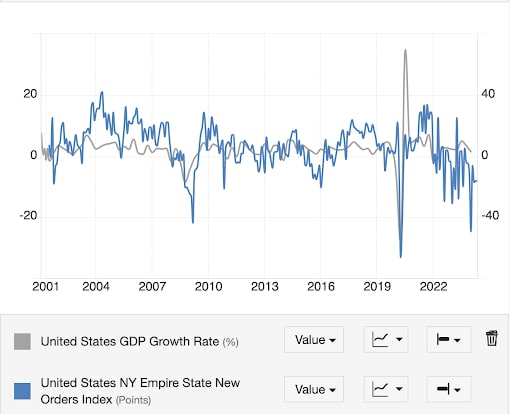
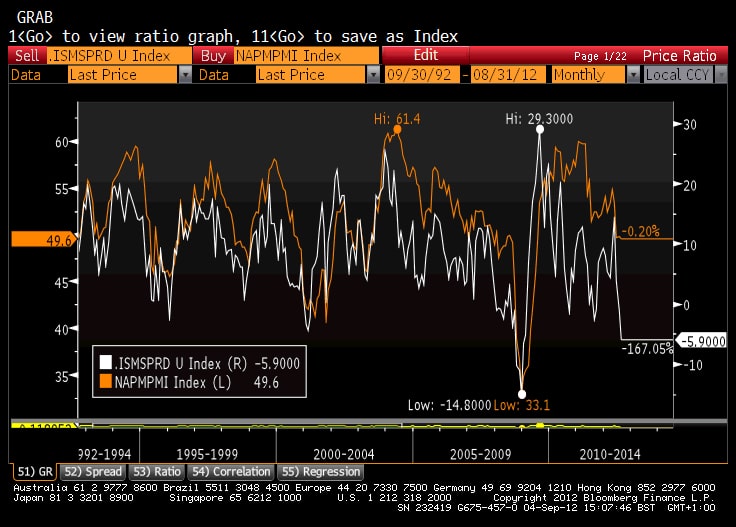
Decreasing Manufacturing Activity - Lower manufacturing output and new orders can signal a slowdown. Some traders follow manufacturing indices like Purchasing Managers’ Indices (PMI), these are diffusion indices based on questionnaires asking whether activity is higher or lower than the prior month. Others prefer the more predictive new orders component of actual activity like Empire Manufacturing New Orders (chart below). Other considerations include the Institute For Supply Management Index. Again, components beneath the headline can offer more of a clue as to the direction of travel. For instance, the ISM sub-component of new order less inventories expressed as a spread can lead the broader index by 3 months.
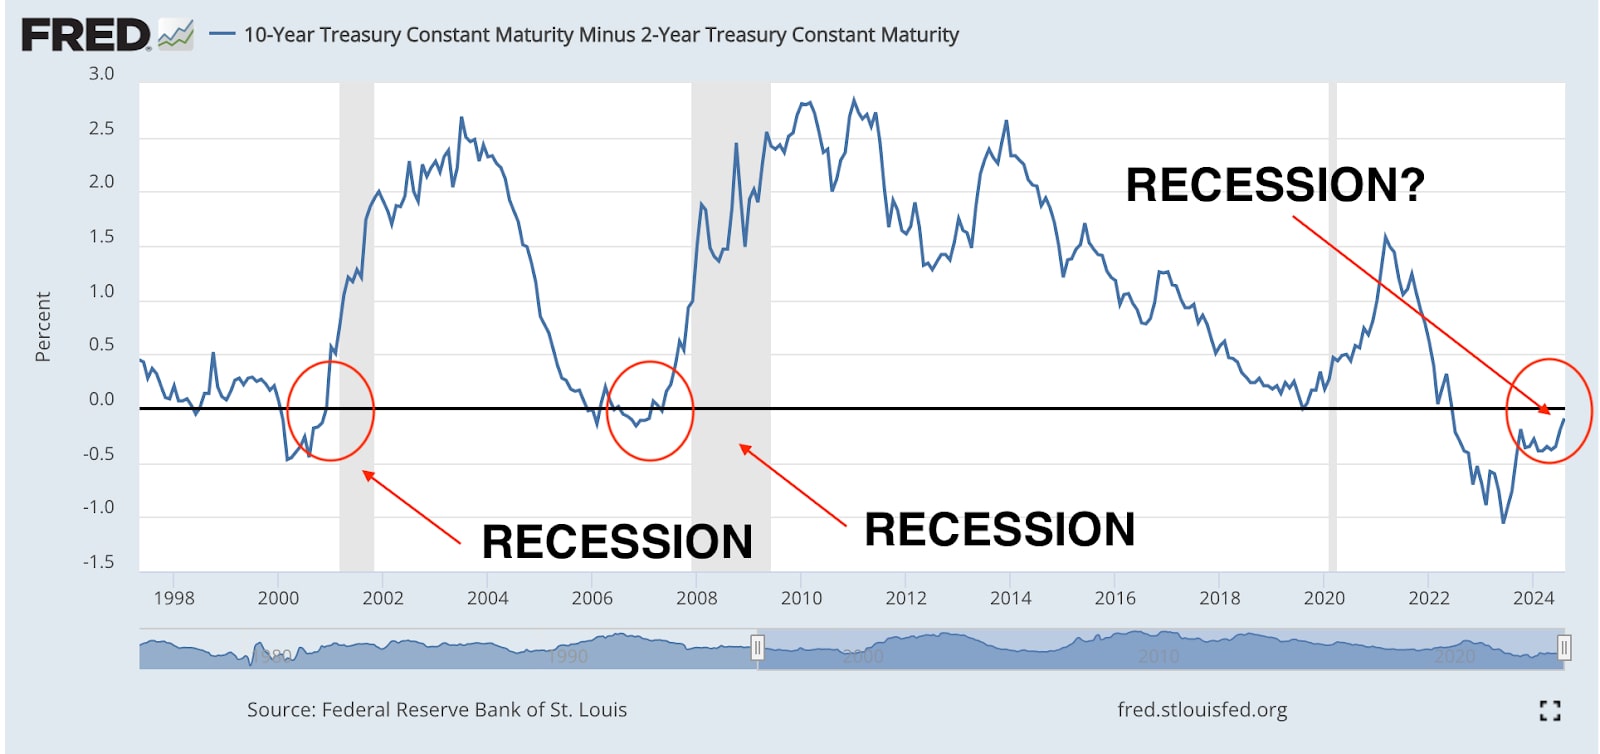
Inverted Yield Curve - Track the yield curve spread between 10- and 2-year Treasury yields. When short-term interest rates exceed long-term rates, it can in most instances be a precursor to a recession. (See chart below)
Reduced Corporate Profits:
Falling corporate earnings can foreshadow economic decline. Keep an eye on earnings reports and profit warnings from major companies. Companies like FactSet provide free Earnings Insights that can help identify slowing trends associated with recessions.
How do different asset classes typically perform during a recession?
Traders have the ability to diversify portfolios to a greater degree than ever before - but understanding how these alternative assets function during times of economic stress is crucial to taking advantage of the full diversification benefits they offer. These patterns are not absolute but reflect general trends that have been observed during past recessions.
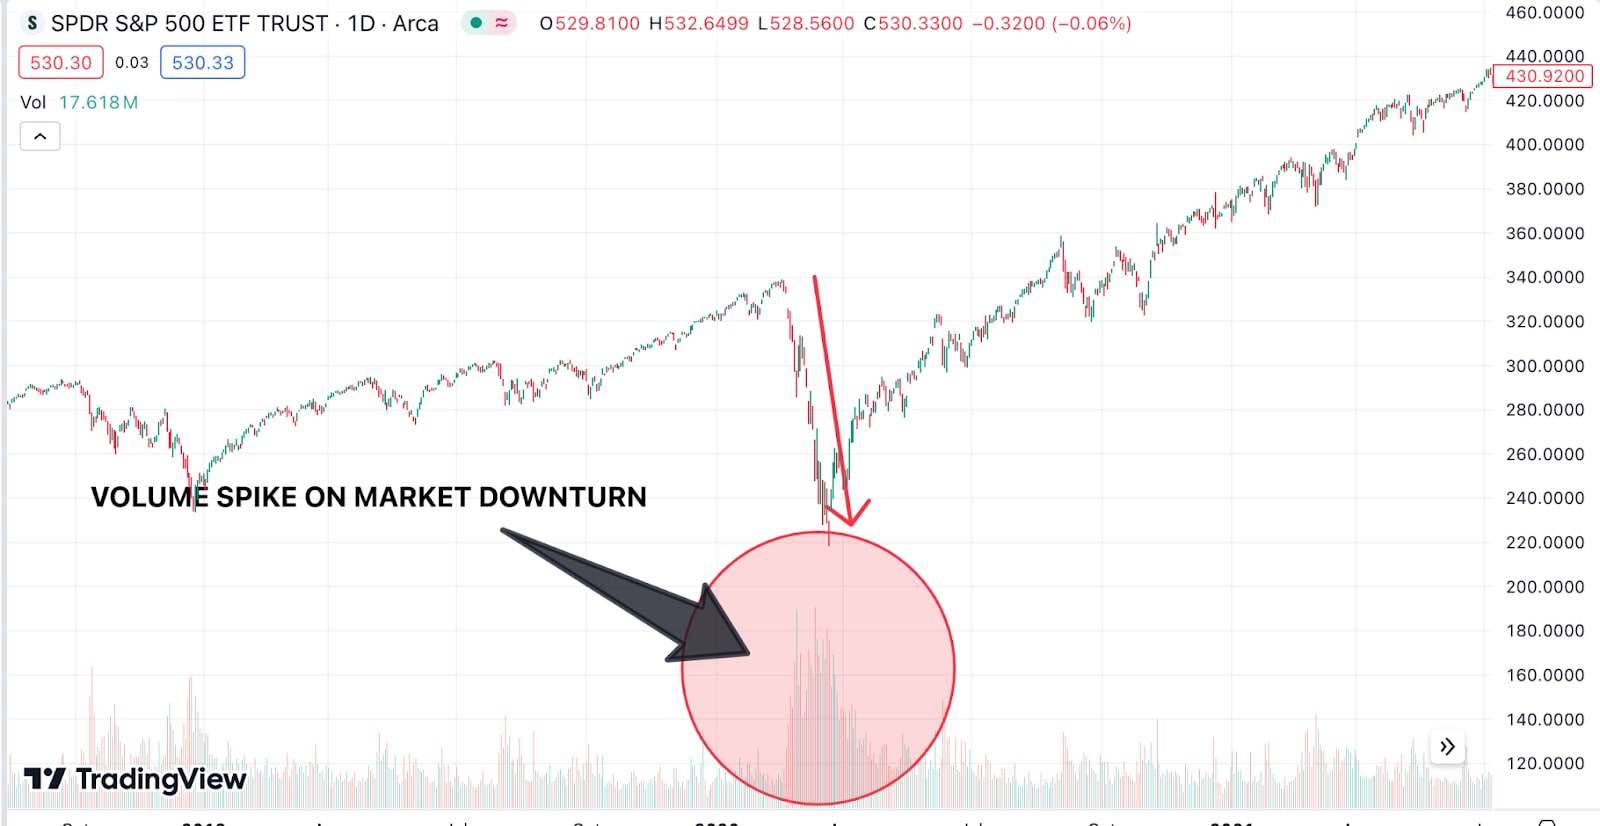
Stocks generally perform poorly during recessions as corporate earnings decline and economic uncertainty rises. Investors often sell off riskier assets, leading to lower stock prices. Historically, the S&P 500 has fallen by an average of between 20-30% during recessions. For example, during the 2008 financial crisis, the S&P 500 fell by approximately 57% from its peak in October 2007 to its trough in March 2009. In the early 2000s dot-com bubble, the S&P 500 declined by around 49% from its peak in March 2000 to its low in October 2002. While the average decline is significant, the exact performance can vary depending on the recession’s severity, duration, and the initial market conditions. Despite these significant declines, the S&P 500 recovered over time, with long-term growth resuming as the economy stabilised and began to expand again.
Bonds:
Government bonds, particularly those from stable economies, tend to perform well as investors seek safe-haven assets. For instance, U.S. Treasury bonds typically see increased demand during recessions, driving prices up and yields down. Corporate bonds, however, can be risky, especially if they are from companies with weak balance sheets, as defaults become more likely. During the 2008 financial crisis, the yield on the 10-year U.S. Treasury fell from about 4.0% in mid-2007 to around 2.0% in early 2009, reflecting a significant rise in bond prices.
Commodities like oil and industrial metals usually decline in value due to reduced demand. However, precious metals like gold often rise as they are viewed as a store of value during economic downturns. The gold price for example saw significant price increases during the 2008 recession.
What economic news and events should I pay the most attention to during a recession?
Aside from the economic data points mentioned above (employment, GDP, Consumer confidence and manufacturing indices) the following should also be continuously monitored to help manage risk and adjust portfolios:
Economic Indicators
- What to Watch: Citi Economic Surprise Index is worth monitoring for a broad overview of market expectations surrounding economic data.
- Why: It helps anticipate market trends, guide investment decisions, assess policy effectiveness, and identify early signs of recovery, enabling better financial planning and risk management during uncertain times.
The Citi Economic Surprise Index attempts to capture how good (or bad) the data is coming in relative to economic expectations. For the market it's not so much about whether the data is good or bad, but whether it's better or worse than they thought it would be. Positive numbers indicate that the data is "beating." Negative numbers show "missing". The index has just turned negative. Keep in mind what is basically happening, as it is usually a cycle. Expectations rise as a result of improving data, and then it becomes more likely that data will disappoint. It doesn’t actually mean the data get worse, only that they disappoint versus expectations. The reverse then happens in order to complete the cycle.
Central Bank Announcements
- What to Watch: Interest rate decisions and monetary policy statements from the Federal Reserve or other central banks.
- Why: Central banks' actions can signal responses to economic conditions and impact market liquidity.
The Federal Reserve for instance publishes its projections four times a year; the “dot plot” can be found in the pages of its Summary of Economic Projections reports, allowing you to track how each Fed member projects future interest rates. Can the dot plot predict future rate decisions? Sort of, but not reliably. That’s because the Fed members will likely shift their projections as new economic data rolls in. But it can be used to better understand what the Fed is currently thinking and what it might do in the next FOMC meeting.
Fed Fund Futures and 2-year Treasury yields are key indicators of market expectations for future Federal Reserve interest rate decisions. Fed Fund Futures reflect the market's consensus on where the Fed Funds target rate will be in the future, with prices adjusting to anticipated changes based on economic data and Fed communications. 2-year Treasury yields are sensitive to short-term interest rate expectations, moving higher when rate hikes are expected. If both indicators suggest rising rates, the Fed may adjust its target rate upward to align with market expectations and prevent market disruptions. Conversely, lower expectations may lead the Fed to pause or cut rates
Inflation Data
- What to Watch: Consumer Price Index (CPI) and Producer Price Index (PPI).
- Why: Inflation trends affect purchasing power and central bank policies. Inflation also tends to fall during a recession due to lower economic demand. Declines in PPI can feed throughout the product chain and eventually bring headline CPI down further in later months, which is why Central Banks will monitor trends.
Corporate Earnings Reports
- What to Watch: Quarterly earnings reports and guidance from major companies.
- Why: Falling corporate profits can indicate broader economic issues. Companies also cut back on investment during periods of economic slowdown.
Over the last four U.S. recessions, corporate profits growth rates have been a relatively consistent lead indicator of trouble. While two quarters separated by more than a year of positive data may be just a glitch, it is worth noting that since 1989 there have been no periods in which a recession was not preceded by decline in corporate profits, sometimes (as in 1991) as far out as 2 years ahead.
Track the Citigroup Earnings Revision Index (ERI) for evidence of analyst revisions to growth rates. The ERI is calculated as the proportion of analysts raising their EPS estimates for listed companies minus the proportion of analysts lowering their EPS estimates for the listed companies. When the index's reading is above zero, it means that analysts on average are optimistic about the outlook for corporate earnings, and the MSCI Europe Index has a higher probability of strengthening. Alternatively, a reading below zero suggests pessimism and possibility for the MSCI Europe Index to weaken.
Government Fiscal Policies
- What to Watch: Stimulus packages, tax changes, and government spending plans.
- Why: Fiscal policies can influence economic recovery and market sentiment. Monitoring provides a comprehensive view of economic health and helps in making informed trading and investment decisions. Government borrowing will rise due to automatic stabilisers and expansionary fiscal policy.
The UK the mini-budget of 23 September, 2022 - included £45bn of unfunded tax cuts - and was followed by days of turmoil on the markets, a fall in the value of the pound and rises in the cost of UK government borrowing and mortgage rates. The general consensus was that the Mini-Budget represented a fiscal expansion that would result in a short-run increase in demand, GDP, inflation and interest rates but that, in the longer run, would lead to an increase in government debt that would require a reversal of the tax cuts if public finances were to remain sustainable. This meant an increase in the risk premia they applied to UK gilts and, so, a dramatic rise in gilt yields, with the 10-year spot rate, for instance, rising by a little over one percentage point between 21 September and 27 September, accompanied by a fall in sterling to its lowest value against the dollar since 1985. The rise in gilt yields led to a crisis for pension funds that had invested in liability-driven investments and so the Bank of England intervened in the bond markets on 28 September. This intervention successfully brought bond rates back down.
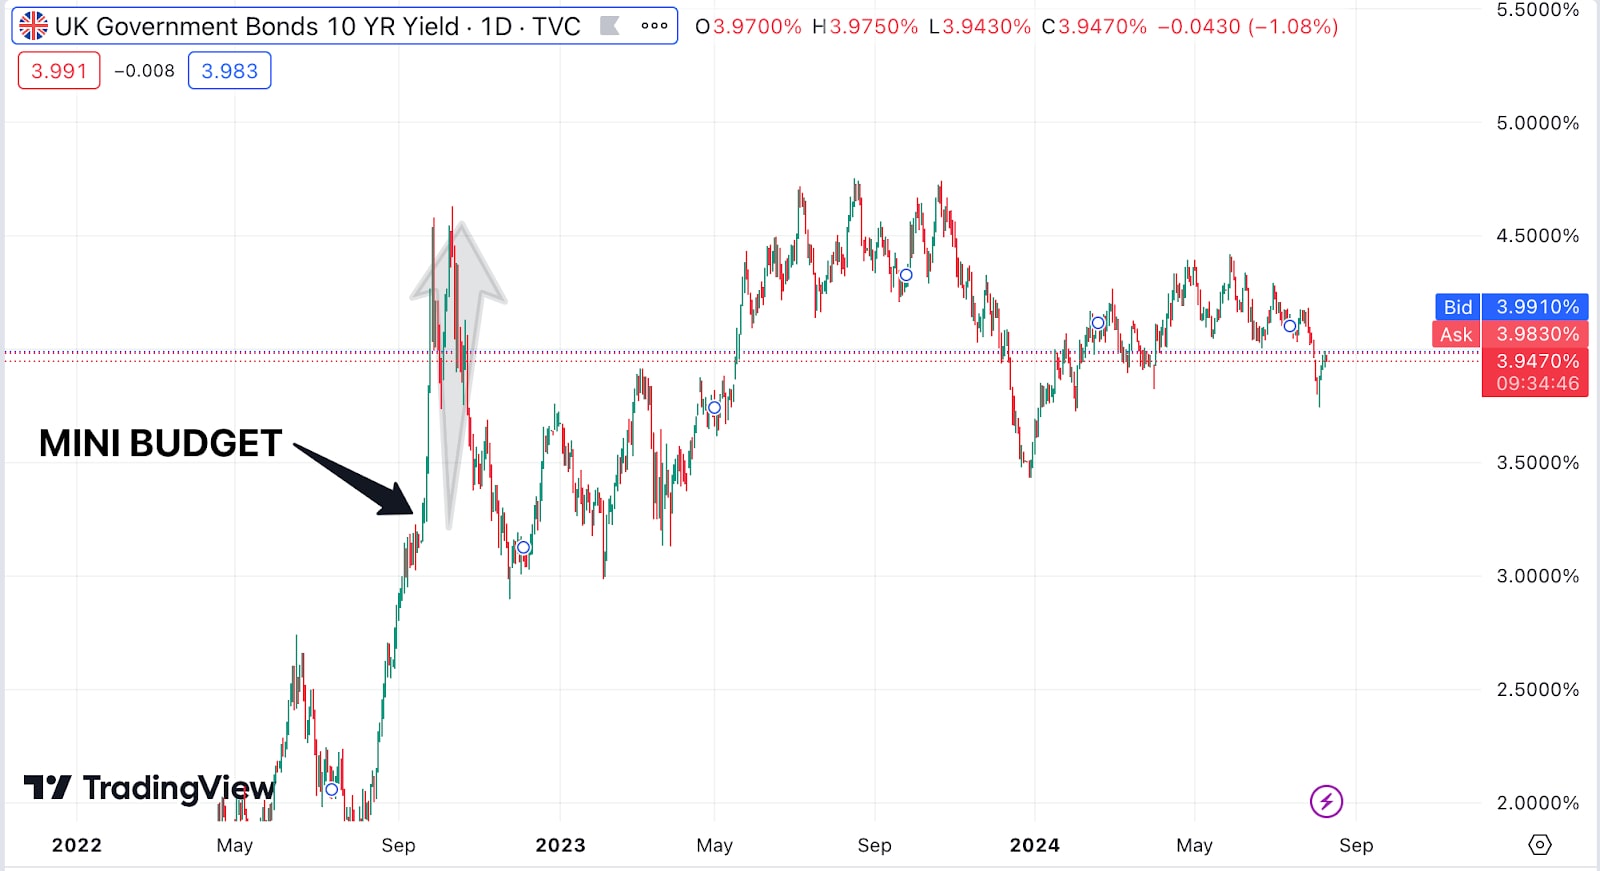
Once the Prime Minister and Chancellor were replaced and the main proposals in the Mini-Budget reversed, risk premia fell back to roughly where they were before the Mini Budget had happened.
Trading strategy and analysis
What trading strategies are most effective during a recession?
During a recession, trading strategies should focus on capital preservation, risk management, and exploiting specific market conditions.
Here are some effective strategies:
Defensive Stocks
- Strategy - Invest in stocks of companies that provide essential goods and services (e.g., utilities, healthcare, consumer staples).
- Reason - These sectors tend to be less sensitive to economic downturns and provide stable returns.
Short Selling
- Strategy - Sell stocks short expected to decline in value and buy them back at a lower price.
- Reason - In a recession, many stocks may experience price declines, presenting opportunities for short selling.
Diversification
- Strategy - Spread investments across different asset classes and sectors.
- Reason - Reduces risk exposure and mitigates the impact of poor performance in any single asset class. Adjust asset allocation according to the cycle.
Bond Investments
- Strategy - Focus on high-quality government bonds, investment-grade corporate bonds or related defensive ETFs.
- Reason - These tend to be more stable and provide steady income during economic downturns.
Gold and Precious Metals
- Strategy - Allocate funds to gold and other precious metals.
- Reason - They are often considered safe havens during periods of economic instability and market volatility.
Cash Reserves
- Strategy - Maintain a significant portion of a portfolio in cash or cash equivalents.
- Reason - Provides flexibility (often referred to as “dry powder”) to capitalise on opportunities and reduces exposure to market downturns.
Long-Term Investing
- Strategy - Focus on companies with strong fundamentals and long-term growth potential.
- Reason - High-quality stocks may recover strongly post-recession, offering good long-term investment opportunities.
Trading Risk Management
- Strategy - Implement strict risk management practices, including setting stop-loss and take-profit orders.
- Reason - Helps protect capital and lock in gains amid market fluctuations.
How can I use technical analysis to make informed decisions in a volatile market?
Using technical analysis in a volatile market can help make informed trading decisions by providing insights into price trends, market sentiment, and potential entry and exit points.
Trends Using Moving Averages
Tools - Use Simple Moving Averages (SMA) and Exponential Moving Averages (EMA).
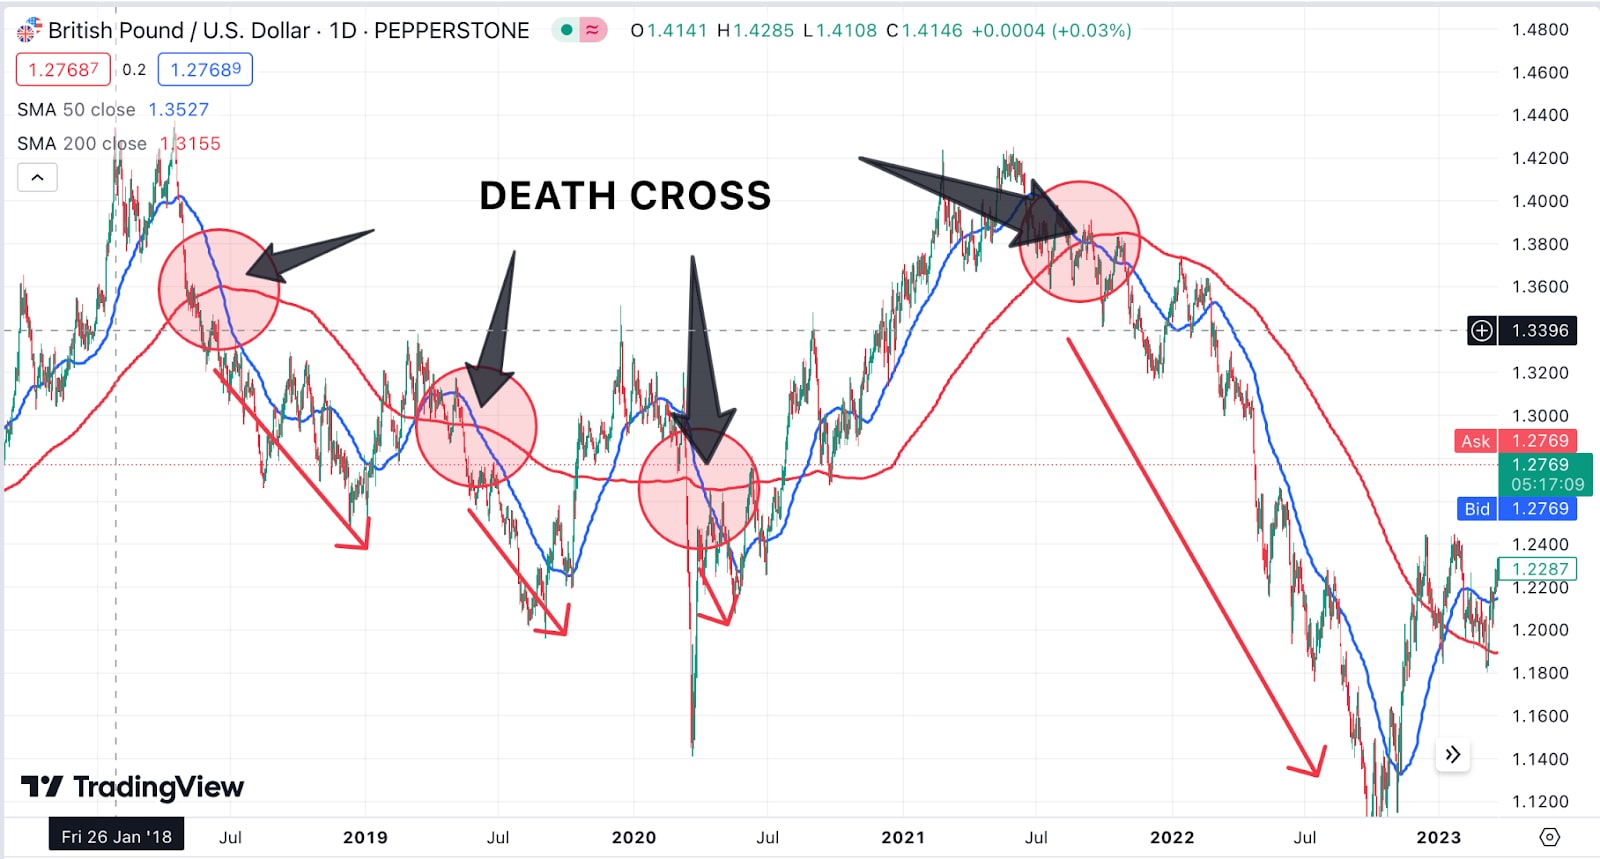
Application - Look for crossovers like the “death cross” (short-term moving average like 50 day SMA drops below a longer-term 200 day SMA) to identify downtrend changes. During volatility, shorter-term MAs can help spot more immediate trends.
Support and Resistance Levels
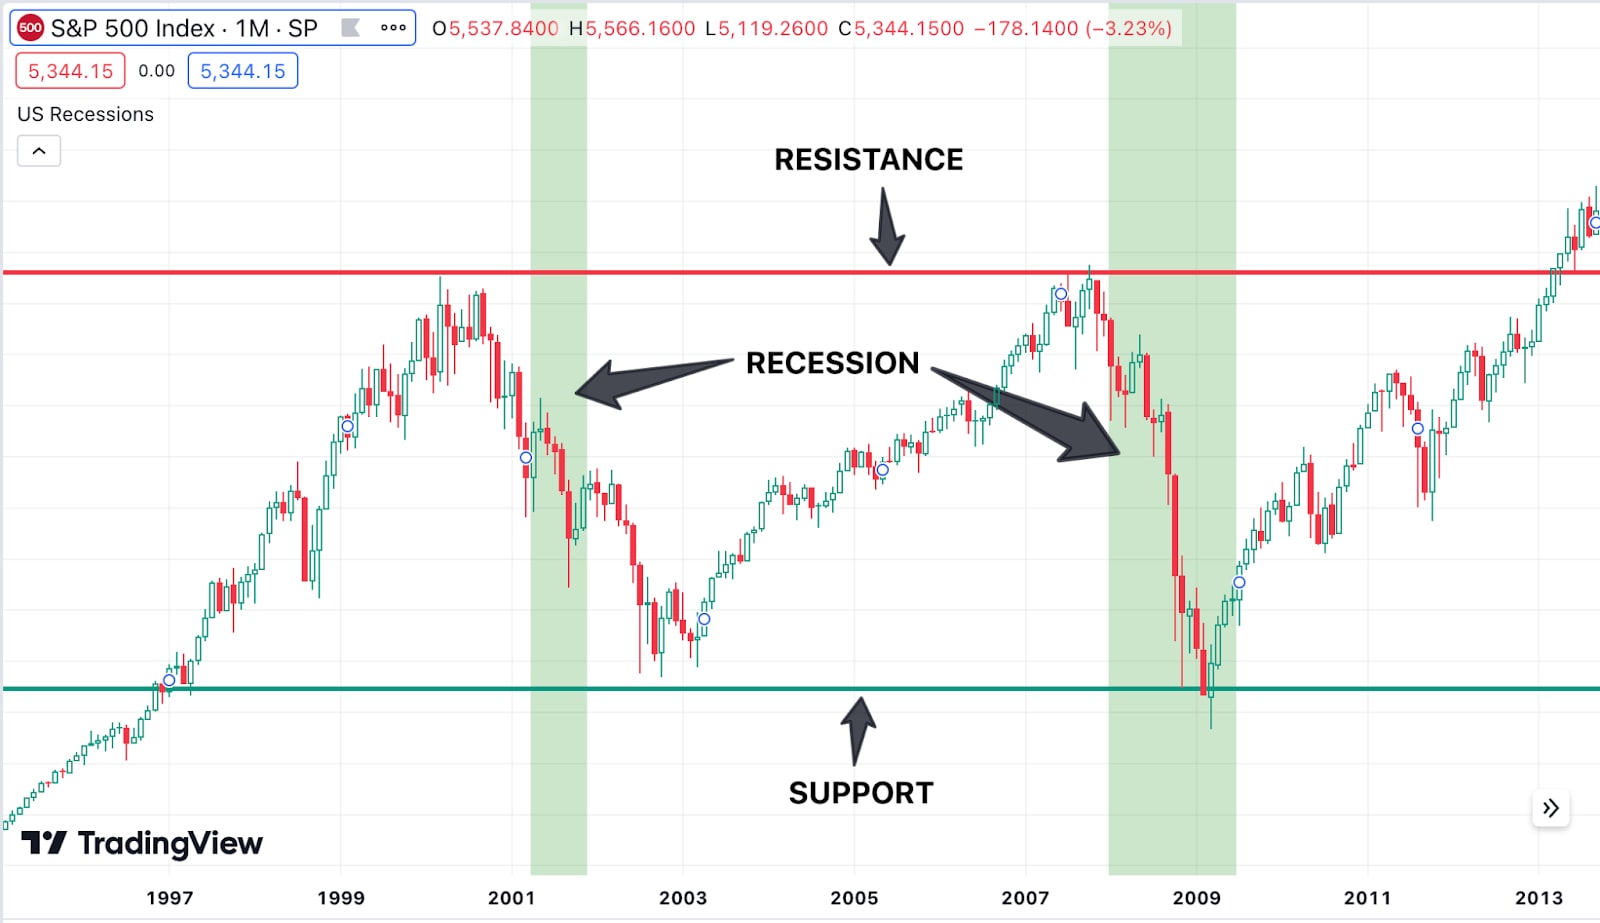
Tools - Chart patterns, horizontal lines.
Application - Identify key support and resistance levels to gauge potential reversal points or breakout areas. These levels help in setting stop-loss and take-profit orders.
Volatility Indicators
Tools - Average True Range (ATR), Bollinger Bands.
Application - ATR measures market volatility, helping to adjust stop-loss levels. Bollinger Bands expand and contract with volatility, indicating potential overbought or oversold conditions. Higher ATR values indicate increased volatility, while lower values suggest calmer, less volatile market conditions.
Oscillators for Overbought/Oversold Conditions
Tools - Relative Strength Index (RSI), Stochastic Oscillator.
Application - RSI and Stochastic Oscillator can help identify overbought or oversold conditions, suggesting potential reversal points or confirmation of trends.
Chart Patterns
Tools - Patterns like Head and Shoulders, Double Tops/Bottoms, Flags, and Pennants.
Application - Chart patterns can potentially predict future price movements based on historical behaviour. Patterns can provide insight into potential breakouts or reversals.
Monitor Volume Trends
Tools - Volume indicators, On-Balance Volume (OBV).
Application - Volume can confirm trends. For example, increasing volume during an uptrend can indicate strength, while declining volume might signal a weakening trend.
What are the best practices for using fundamental analysis during a recession?
Using fundamental analysis during a recession involves adopting an approach to account for the challenging economic environment. By focusing on the following areas, fundamental analysis can be useful in identifying robust investment opportunities and mitigate risks during a recession:
Financial Health
Companies with strong balance sheets, low debt levels, and substantial cash reserves tend to perform better during a recession. Businesses with solid financial fundamentals are better positioned to weather economic downturns and recover faster. Use free stock screeners like Market Screener to identify stocks with low valuations.
Earnings Stability
Look for companies with consistent earnings and stable revenue streams. Businesses in essential industries or those with diversified income sources tend to be more resilient during economic slowdowns.
Assess Valuation Metrics
Consider valuation metrics like Price-to-Earnings (P/E) ratios, Price-to-Book (P/B) ratios, and Dividend Yields to identify undervalued stocks. Recessions can create opportunities to buy quality stocks at lower prices, but be cautious of value traps.
Analyse Sector Performance
Focus on sectors historically less sensitive to economic cycles, such as utilities, healthcare, and consumer staples. These sectors often maintain stable demand during recessions, providing more reliable investment opportunities.
Monitor Cash Flow
Evaluate companies' cash flow statements to ensure they generate positive cash flow from operations. Reliable cash flow is critical for maintaining operations and paying down debt during economic contractions.
Consider Management Quality
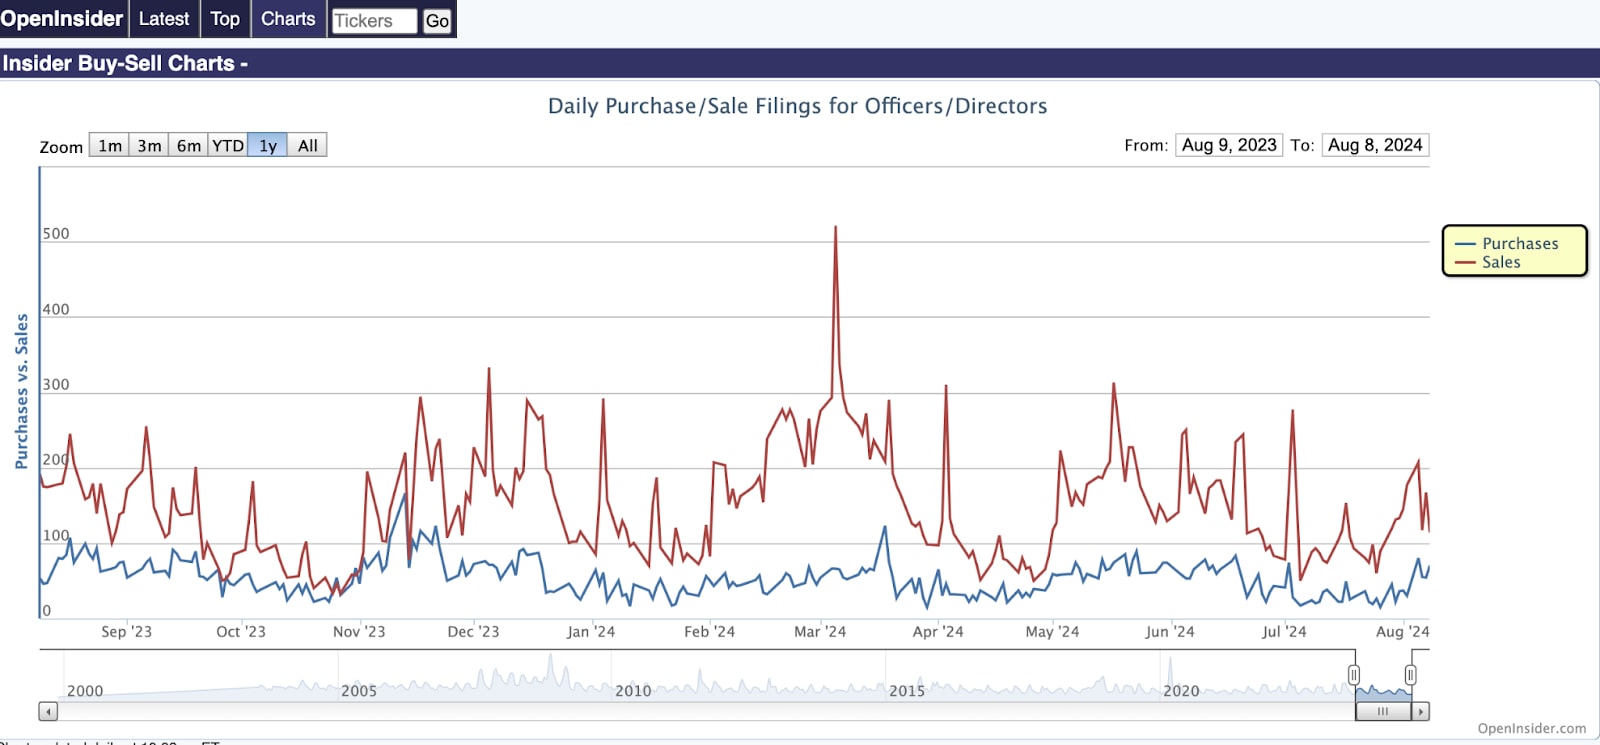
Assess the quality and track record of a company's management team. Effective leadership is crucial for navigating a recession and implementing strategies to adapt and recover. Also consider insider selling/buying using Open Insider. Insider selling is often construed as a negative signal, but it's insider buying that actually tells us a lot more than insider selling. There are many reasons why insiders might sell, but there is only one major reason why insiders would buy. They buy because they believe the stock is undervalued. A new member of the board of directors might be encouraged to buy some stock just for appearance's sake, but that's an exception to the rule.
Practical considerations
How should I adjust my trading plan and goals in response to a recessionary environment?
Adjusting a trading plan and goals during a recessionary environment involves recalibrating strategies to manage increased risk and capitalise on opportunities effectively. By implementing the following adjustments can help maintain a strategic approach to trading and investment:
Reevaluate Risk Tolerance
Adjust Risk Limits - Lower overall risk exposure by reducing position sizes and using lower leverage.
Focus on Capital Preservation - Prioritise protecting capital over seeking high returns.
Revise Trading Goals
Set Realistic Targets - Modify profit targets to reflect current market conditions and increased volatility.
Emphasise Stability - Aim for steady gains rather than high-risk, high-reward trades.
Increase Focus on Fundamentals
Analyse Financial Health - Prioritise companies with strong balance sheets, stable earnings, and low debt.
Monitor Economic Indicators - Pay close attention to key economic data and trends that impact market conditions highlighted above.
Adjust Technical Analysis Techniques
Shorter Time Frames - Use shorter time frames for technical analysis to capture quicker, more immediate trends.
Adapt Indicators - Adjust technical indicator settings (moving averages etc.) to account for changing volatility.
Enhance Risk Management
Set Tighter Stop-Losses - Implement tighter stop-loss orders to limit potential losses.
Monitor Margin Levels - Keep a close eye on margin levels and adjust to avoid margin calls and forced liquidations.
Increase Liquidity
Hold Higher Cash Reserves - Maintain higher cash levels to take advantage of future opportunities and protect against volatility.
Diversify Investments
Spread Risk - Diversify across different asset classes and sectors to reduce exposure to any single market.
Consider Safe Havens - Allocate funds to safe-haven assets like gold or high-quality government bonds.
If you’re keen to find out more, see Pepperstone’s guide on the risks and benefits associated with trading during a recession.
Tools and resources
Which tools and platforms are best for trading CFDs during a recession?
When trading CFDs (Contracts for Difference) during a recession, choosing the right tools and platforms can enhance your trading efficiency, risk management, and market analysis. Here are some of the best tools and platforms to consider:
Trading Platforms
MetaTrader 4 (MT4) / MetaTrader 5 (MT5)
Features - Advanced charting tools, technical indicators, and automated trading capabilities.
Benefits - Popular for its extensive customization options and robust performance analysis tools.
cTrader
Features - High-speed execution, advanced charting, and trading tools.
Benefits - Offers a range of technical indicators, chart patterns, and is known for its user-friendly interface.
Features - Web-based platform with powerful charting tools, social trading features, and a wide range of technical indicators.
Benefits - Excellent for real-time analysis and sharing trading ideas with a community of traders.
Technical Analysis Tools
Trading Indicators
Tools - Moving Averages, Relative Strength Index (RSI), Bollinger Bands, Average True Range (ATR).
Benefits - Helps in identifying trends, volatility, and potential entry/exit points.
Volatility Indicators
Tools - Bollinger Bands, Volatility Index (VIX), TRIN Index, MOVE Index
Benefits - Helps in understanding market volatility and adjusting trading strategies accordingly.
Risk Management Tools
Stop-Loss and Take-Profit Orders
Features - Automated orders to close trades at predefined levels.
Benefits - Protects against large losses and secures profits.
Margin Calculators
Tools - Online margin calculators or built-in platform tools.
Benefits - Helps in calculating required margin and assessing risk exposure.
Automation and Alerts
Automated Trading Systems
Tools - Expert Advisors (EAs) for MT4/MT5 or trading bots.
Benefits - Automates trading strategies and executes trades based on predefined criteria.
Price Alerts
Tools - Alerts for specific price levels or technical indicator triggers.
Benefits - Keeps you informed of market conditions without constant monitoring.
Educational Resources
Webinars and Tutorials
Platforms - Many trading platforms offer educational resources and webinars.
Benefits - Helps in staying updated on market trends and improving trading
Demo Accounts
Features - Practice trading without financial risk.
Benefits - Allows strategies to be tested and tools in a simulated environment.
Where can I find reliable research and analysis on market conditions during a recession?
Finding reliable research and analysis on market conditions during a recession is crucial for making informed trading and investment decisions. Here are some top sources to consider:
Financial News Websites
- Bloomberg - Offers comprehensive coverage of market news, economic data, and in-depth analysis.
- Reuters - Provides real-time updates and analysis on global markets and economic conditions.
- PiQ - Access to news feeds with timely data releases. Free aggregation platforms like PiQ offer over 100 sources of information from the likes of Reuters and Bloomberg
Economic Research Institutions
- Federal Reserve Economic Data (FRED) - Provides a vast database of economic indicators and historical data.
- Bureau of Economic Analysis - Offers official data on GDP, personal income, and other economic indicators.
- National Bureau of Economic Research (NBER) - Provides research and reports on economic cycles and recessions.
- Office of National Statistics - The ONS is the UK's official statistical authority, providing data on the economy, population, and society.
- Eurostat - The European Union's statistical office, providing statistical information to support
EU policies and decision-making.
Destatis - The Federal Statistical Office of Germany, provides comprehensive statistical data on Germany’s economy, society, and environment for policy-making.
Financial Research Platforms
- Morningstar - Offers detailed analysis and ratings on stocks, mutual funds, and other investments.
- S&P Global - Provides research reports, ratings, and data on global markets and sectors.
- FactSet - Offers financial data and analytics, including economic forecasts and market analysis.
Economic and Market Data Providers
- Economic Calendars - Sites like Pepperstone provide schedules of upcoming economic events and forecasts.
- Consensus Economics - Offers forecasts and surveys from economists on economic indicators and market conditions.
Social Media and Financial Forums
LinkedIn - Follow industry experts and financial analysts who often share insights and updates.
Twitter - Follow reputable financial analysts and economists for real-time updates and opinions. Follow Pepperstone’s senior analysts Chris Weston (@ChrisWeston_PS) and Michael Brown (@MrMBrown) on X (Twitter) for insight into the various caveats to look out for in the releases.
Psychological considerations
How can I manage the psychological stress of trading in a highly volatile and uncertain market?
Trading psychology is key to navigating the complexities of markets, and mastering it involves six fundamental aspects:
Understanding Market Behaviour - Markets are influenced by a range of factors, including economic indicators, investor sentiment, and geopolitical events. Recognising that markets can be irrational and unpredictable helps traders avoid overreacting to short-term fluctuations.
Overcoming Biases - Common cognitive biases, such as confirmation bias (favouring information that confirms pre-existing beliefs) and loss aversion (fearing losses more than valuing gains), can lead to poor decision-making. Successful traders learn to identify and counter these biases, relying on objective analysis rather than emotion-driven decisions.
Developing A Trading Plan - Provides structure and clarity. A well-defined plan includes specific criteria for entering and exiting trades, risk management rules, and clear goals. This plan serves as a roadmap, helping traders stay focused and avoid impulsive actions driven by market volatility.
Maintaining discipline - Ensures adherence to the trading plan. Discipline involves sticking to a strategy even when the market tempts deviation. It helps prevent emotional decisions, such as chasing losses or holding onto losing positions out of hope.
Managing Emotions - Emotions like fear and greed can cloud judgement and lead to mistakes. Traders who can control their emotions, remaining calm and objective, are more likely to make rational decisions.
Long-term perspective - Helps traders stay resilient. Instead of getting caught up in daily market swings, focusing on long-term goals and the bigger picture allows traders to withstand short-term setbacks and stay committed to their overall strategy.
Trading in a recession FAQs
Is trading good in a recession?
Trading during a recession can be challenging due to increased volatility and uncertainty. However, it can also present opportunities for those who are well-prepared. Traders can benefit from market corrections, focus on defensive sectors, and use strategies like short selling or hedging. Success depends on strong risk management, adaptability, and thorough analysis. While trading can be profitable, it requires careful planning and a high tolerance for risk, as unpredictable market movements can lead to significant losses if not managed properly.
Is a recession good for the stock market?
A recession is generally not good for the stock market, as economic downturns often lead to reduced corporate earnings, lower consumer spending, and increased uncertainty. Stocks typically decline due to these negative factors. However, recessions can create opportunities for long-term investors who can identify undervalued assets and companies with strong fundamentals. While the market may struggle initially, it can eventually recover as the economy stabilises and growth resumes.
The material provided here has not been prepared in accordance with legal requirements designed to promote the independence of investment research and as such is considered to be a marketing communication. Whilst it is not subject to any prohibition on dealing ahead of the dissemination of investment research we will not seek to take any advantage before providing it to our clients.
Pepperstone doesn’t represent that the material provided here is accurate, current or complete, and therefore shouldn’t be relied upon as such. The information, whether from a third party or not, isn’t to be considered as a recommendation; or an offer to buy or sell; or the solicitation of an offer to buy or sell any security, financial product or instrument; or to participate in any particular trading strategy. It does not take into account readers’ financial situation or investment objectives. We advise any readers of this content to seek their own advice. Without the approval of Pepperstone, reproduction or redistribution of this information isn’t permitted.