• Home
  • Pro
  • Partners
  • Help and support
  • English
  • Italiano
  • Español
  • Français
Pepperstone logo
Pepperstone logo
  • Ways to trade
    • Trading accounts

      Choose from two account types depending on your strategy

    • 24-hour trading

      Trade CFDs on key US shares 24/5.

    • Pricing

      Discover our tight spreads, plus all other possble fees

    • Trading hours
    • Maintenance schedule
    • Risk management
    • Funding and withdrawals
  • Markets
    • Forex

      Get great rates on majors like EUR/USD, plus minors and exotics

    • Commodities

      Trade on metals, energies & softs, with oil spreads from 2 cents

    • Cryptocurrencies

      Speculate on Bitcoin, Ether and more, with a trusted broker

    • Shares
    • ETF
    • Indices
    • Currency indices
    • Dividends for index CFDs
    • Dividends for share CFDs
    • CFD forwards
  • Trading platforms
    • TradingView

      Trade through supercharts with tight spreads

    • MetaTrader 5

      Explore the apex in trading automation with our execution tech

    • The Pepperstone platform
    • MetaTrader 4
    • cTrader
    • Trading tools
  • Market analysis
    • Navigating markets

      Latest news and analysis from our experts

    • The Daily Fix

      Your regular round-up of key events

    • Meet the analysts

      Our global team giving your trading the edge

  • About us
    • Who we are

      Pepperstone was born from the dream of making trading better

    • Company news
    • Company awards
    • Protecting clients online
    • Trading accounts

      Choose from two account types depending on your strategy

    • 24-hour trading

      Trade CFDs on key US shares 24/5.

    • Pricing

      Discover our tight spreads, plus all other possble fees

    • Trading hours
    • Maintenance schedule
    • Risk management
    • Funding and withdrawals
    • Forex

      Get great rates on majors like EUR/USD, plus minors and exotics

    • Commodities

      Trade on metals, energies & softs, with oil spreads from 2 cents

    • Cryptocurrencies

      Speculate on Bitcoin, Ether and more, with a trusted broker

    • Shares
    • ETF
    • Indices
    • Currency indices
    • Dividends for index CFDs
    • Dividends for share CFDs
    • CFD forwards
    • TradingView

      Trade through supercharts with tight spreads

    • MetaTrader 5

      Explore the apex in trading automation with our execution tech

    • The Pepperstone platform
    • MetaTrader 4
    • cTrader
    • Trading tools
    • Navigating markets

      Latest news and analysis from our experts

    • The Daily Fix

      Your regular round-up of key events

    • Meet the analysts

      Our global team giving your trading the edge

    • Who we are

      Pepperstone was born from the dream of making trading better

    • Company news
    • Company awards
    • Protecting clients online
Share
Beginner

A home for commodity traders

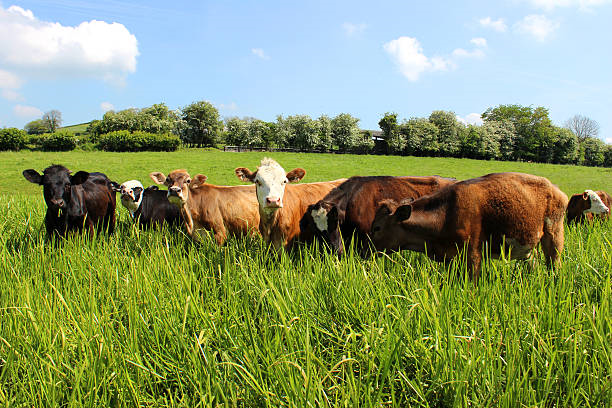
You may have noticed our range of Share CFDs expanding recently, and we’re not stopping there. We’ve just released a brand new range of commodities to add to our already solid array of precious metals, energies, agricultural and other soft commodities. Now you can trade momentum swings in Lumber, Live Cattle, Lean Hogs, Gasoline, Corn and more on our MT4, MT5 and cTrader platforms.

image.png

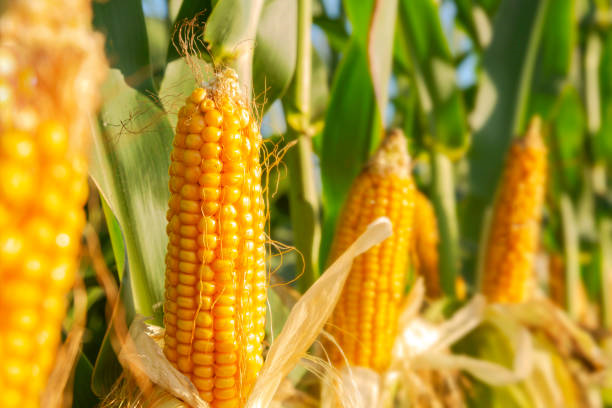
As a trader, the range of instruments you have available to trade directly correlates with the range of opportunities you can explore. That’s why we’re introducing 9 new commodity CFD products so you can take advantage of more instruments that are topical and cyclical in nature. 

They’re also relatively devoid of central bank influence, unlike FX and Equities markets, so pure supply and demand are the primary forces that drive fluctuations in price.

Trading agricultural commodities are most suitable for momentum traders. If you like to get behind a trend and are prepared to wait it out for some volatility, then there will almost certainly be a market that Pepperstone offers where you can trade into the trend.

Remember that supply is a crucial driver of commodity prices. Look for producers controlling output, as well as barriers to production and transport like major weather events and global lockdowns as a sign of potential appreciation in price. Supply gluts and deliberate increases in output (such as what we see in oil markets) generally lead to depreciations.

Why should you trade commodity CFDs with Pepperstone?

1) No ownership interest

Contracts for difference (CFDs) are OTC derivative contracts, you aren’t buying or selling physical commodities. This means you don’t need to worry about delivering or storing the commodities products you’re trading. You simply take a position on price and long or short the instrument depending on your view of price action in the short term.

2) Cash contracts - no contract roll fees

The commodity CFDs we offer are cash products derived from the front month futures contracts on the underlying commodity. That means that there’s no need to close out your positions and roll into the next month’s futures contract, and that means no contract roll fees!

CFD cash contracts are indefinite, so overnight funding rates are the only revolving fees/payments that apply. You may be required to pay overnight funding costs on certain positions, but you may also receive payments if you are holding a position in an instrument with positive overnight funding rates.

3) Trade with leverage

Enter positions with less capital, increase your exposures to market movements, and take advantage of more opportunities simultaneously. Check the platforms for the leverage that applies to you.

4) No commissions & competitive spreads

Our Commodity CFDs are spread based products, so you don’t pay an additional commission for order entry and exit. You may be required to pay overnight funding costs if you’re holding positions over consecutive days, however.

5) Continuous charting - better technical analysis

Our commodity CFD contracts are cash contracts, not futures, so the charts continue in perpetuity. This means you can conduct technical analysis and backtest your strategies on 1 chart across many different timeframes. Whereas, futures contracts continuously expire, and so you will have consistent changes in charts which reduces the efficiency and effectiveness of analysis and backtesting.

6) All-in-one access

Trade all of the markets we offer, including FX, Indices, Share CFDs and more from the same account that you trade commodities. No need for transferring between multiple accounts, trade it all in one place on the MT5 platform.

image.png

More commodities - more opportunity

Here’s a bit of information about each of the new commodity CFD products we offer.

Lumber

Traded in units of 1000 board feet, Lumber experienced a surge in price over the second half of 2020 and into May 2021, rising from $450 per thousand board feet to record high of over $1900 at its peak in May. This was largely fueled by an increase in new home constructions and DIY home renovations at the peak of the COVID pandemic. With Lumber output unable to be ramped up in the short term (requires new mills to be built and sufficient skilled labour), demand overpowered supply and the rest is history.

It’s since come off considerably and is trading at less than half its peak price, around $770 per thousand board feet at the time of writing (July 2021).

What drives lumber prices?

  • New home construction demand - watch for significant differences between expectations and actual figures in key economic indicators, like US and Canadian housing starts. If the numbers beat or fall below expectations by a considerable margin, this can lead to volatility in Lumber prices.
  • Renovation trends - more renovations means greater demand for Lumber.
  • Production capacity - increasing supply isn’t so easy in forestry. Lead time on new mill production can be 2 years or more, and the manual labour market is shrinking.
  • Substitutes for lumber products - paper, for example, is experiencing declines in use across the board, so demand for alternative uses of lumber will likely remain stagnant or decline over time as the world moves to more eco-friendly alternatives.
  • Cost of shipping - fluctuations in the transportation of lumber will of course have a major impact on producer bottom lines and in turn the price of lumber futures, which drive the cash product price.
  • Speculation - given its recent stellar run, Lumber has become a keenly traded commodity by traders and speculators, leading to even greater volatility in its price.
Gasoline

Gasoline is a by-product of crude oil and is the world’s primary source of automotive fuel. It’s that pungent black liquid you get at the petrol station every time you fill up, whose price you roll your eyes at when it inevitably goes up by 30-40% without warning. While it can be more volatile during regional weather events and has a seasonality effect (higher prices in the summer when people go on vacations), it largely mirrors moves in the crude oil market. But it does have its differences.

Quoted in price per gallon (generally hovers between $1.2 - $2.3) and traded in contracts of 1000 gallons, its price is driven by:

  • The cost of crude production and supply dynamics (whether OPEC is restricting supply or flooding the market, for example)
  • Refinement costs
  • Shipping and distribution costs and issues - if there’s a major event that's hindering delivery & distribution, or transportation costs are on the rise, expect that to be further built into the price
  • Major geopolitical events - drone attacks by warring nations on key oil supplies, such as the one in September 2021 which caused destruction to Saudi oil facilities, cause significant volatility in crude and gasoline prices. This can see fast price fluctuations in the short term for gasoline.
  • Taxes - there is a taxation component built into the price of gasoline, which all nations impose (head to Luxembourg if you want to pay the same amount at the pump at every station - the government fixes prices and charges very little tax by its neighbours standards). As taxes change, likely driven by the movement toward lowering consumption of greenhouse gas emissions, so too will the overall price of gasoline.
  • Daily demand for gasoline - overall trends regarding the number of new cars and trucks on the road, the frequency by which people are venturing out in their cars, as well as the uptake in alternative fuel vehicles (electric, hydrogen, hybrids) will impact trends in the price of gasoline.
Corn

For the past 7-8 years, Corn prices have remained reasonably steady, fluctuating between $3 - $4.5 a bushel. Like Lumber, it experienced quite a rise to $7.40 from September 2020 to May 2021, but has since experienced a rather sharp retracement to around $6 in July 2021.

While you might just think about corn as that sweet, juicy vegetable that you buy from the supermarket once in a while, or the main ingredient in your cereal, its primary uses are far from that. Corn is one of the main livestock feed products used in the US, is the primary feedstock used in the production of ethanol (which is key to producing gasoline), and it's essential for the production of many food products like candy, soft drinks and other condiments due to their reliance on corn syrup and corn starch.

Drivers of corn prices:

  • Demand for ethanol
  • Crude oil prices - since it plays a pivotal role in the production of ethanol, which is in turn used to create gasoline, changes in the price of oil have a high correlation with corn and other agricultural commodities that are used in fuel production.
  • Weather and yields - climatic conditions are the primary determinant of agricultural yields. Good years weather wise will see more abundant supply, and therefore potentially lower prices, whereas poor yields as a result of major weather events or other environmental factors would likely see increases in corn prices
  • US & Chinese demand - these are the major markets for corn and corn by-products. Major shifts in the use of biofuels and consumption of corn products in these 2 markets will drive trends in the market for corn.
  • USDA crop reports - released throughout the year, these can move the corn market considerably as information pertaining to expected yields and supply is released
Oats

Over the past 10 years we’ve seen Oats trade between $1.50 and $5.40, but it typically trades between $2 and $4 per bushel. It’s had a pretty steady rise from that lower $1.50 price band it set in 2016 to its current price of approximately $4 in July 2021. Unlike Corn and Lumber, Oats had a less dramatic price rise and calmer subsequent fluctuations from September 2020 to May 2021, increasing by about 35% over the period and settling at $4 for now.

Oats have less by-products and so are therefore relied on to a lesser extent as an ingredient or component in production than corn. They are also grown across the world and favour cooler climates, so there is no major geographical effect of production unlike what you would see in the markets for Coffee and Cocoa where there is concentration of global production. This means Oat prices fluctuate much less than other agricultural products, and are generally more stable in the short term. The following factors drive Corn prices:

  • Weather and yields - climatic conditions are the primary determinant of agricultural yields. Good years weather wise will see more abundant supply, and therefore potentially lower prices, whereas poor yields as a result of major weather events or other environmental factors would likely see increases in corn prices
  • Demand for oats - both for human consumption and animal feeds
  • USDA crop reports - can move the Oat market when figures vary significantly from estimates
  • Price of corn - Oats are a substitute as feed grain for Corn. If Corn prices rise and Oats are cheaper, then they are more likely to be used as feed grain for livestock, which will see demand pressures increase. The prices of these 2 agricultural commodities are highly correlated, and commodity traders often trade the spread between them. One possible strategy to implement is to purchase the historically lower priced commodity and sell the historically higher price commodity.
Live Cattle

Live Cattle is another relatively steady commodity that typically trades, over the past 5 years at least, between $0.95 - $1.35 per pound. Like most commodity and other markets, Live Cattle saw a significant sell off in early 2020 as the world went into lockdown and meat production and sales ground to a halt, eking out a low of about $0.78 per pound. It’s since rebounded to a range of about $1.10-1.20 as of mid 2021, which is where it was trading pre-pandemic.

The Live Cattle industry is worth trillions of dollars a year, with beef a staple food source in most countries. While its primary use is the beef it produces, Live Cattle also produce a number of other by-products from cow hides, such as leather, felt and even footballs. Beef fat products are even used in soaps, personal care products and other chemicals.

Drivers of Live Cattle prices include:

  • Demand for beef - this is largely affected by consumer incomes and relative changes in discretionary income and spending. In some countries beef is a staple food, whereas in others it’s a nice-to-have, so increases in disposable income levels either lead to substituting beef into diets or to an increase in consumption of beef in those staple countries. In periods of recession, beef would be swapped out by households for cheaper protein sources like chicken or pork.
  • Feed prices - the cost of feed grain is one of the primary costs of cattle production, so naturally any changes in the price of Corn, Cats and other feed grain will impact the profit margins and therefore the final sale price of Live Cattle.
  • USDA ‘Cattle on Feed’ report - a monthly report that details the number of cattle sent to slaughter that month, as well forecasts the number of cattle that are being fed and are expected to be sent for processing in the coming months. Can often move the Live Cattle market as it gives a good indication as to supply-side conditions.
  • Hedging - commodity traders often trade the spread between Live Cattle (ready to be slaughtered) and Feeder Cattle (calves that are set to be sent to feedlots). Their hedges often involve buying or selling Live Cattle futures, which plays into the demand and supply of the market.
Lean Hogs

Pork, the main product of Lean Hogs, is the most popular animal protein globally. While Pork is the primary by-product, Lean Hogs are also essential in the production of a multitude of pharmaceutical products such as cortisone and insulin, as well as in industrial products. China is by far the leading global producer of Lean Hogs, with output of more than 50,000 metric tons annually.

Lean Hogs have traded between $0.5 - $1 per pound other the past 5 years, but after falling to as low as $35 in the April 2020 COVID-induced crash, it’s risen steadily to reach new highs of $1.20 in June 2021 before consolidating at the $1 - $1.05 mark. Like most agricultural and farming commodities of late, they’ve seen a decent drop in price after reaching May-June highs.

The major factors influencing the price of Lean Hogs, similar to Live Cattle, are:

  • Feed prices - unlike with cattle, the Lean Hog market is characterized by greater supply when livestock feed prices (corn especially) are higher, since farmers send the hogs to slaughter earlier in order to avoid paying more for feed to fatten them further. This leads to a lowering of Lean Hog prices given oversupply in the market. At lower feed prices, hogs are fattened further, leading to higher prices per pound. Therefore, an inverse relationship between feed prices and Lean Hogs exists.
  • Weather and births - harsh weather conditions can lead to less births and therefore less Hogs to fatten. Heat can also impact animal appetite which impacts the fattening process.
  • Global demand - as lower socio-economic countries strengthen and disposable incomes rise, Lean Hog values will likely rise with demand. If beef prices rise, expect pork to be substituted, and demand for Lean Hogs to rise as a result.
  • The Chinese effect - with China both producing and consuming a major portion of global Lean Hog output, changes in Chinese consumer behaviour is a major determinant of trends in Lean Hogs. They are also asserting themselves as a major exporter of Lean Hogs, so if they were to ramp up or reduce production, this would impact global supply dynamics and therefore price.
Rough Rice

Rough Rice is the staple commodity which we get brown and white rice from, essentially the untouched version of rice with its hull and other layers intact. It generally trades between 9 - 16 US cents per hundredweight or cwt, which is approximately 50 kilos or 112 pounds. Note that our contracts on Rough Rice, however, are quoted in $/cwt instead of cents, but the quotations are the same.

Rough Rice is predominantly produced in Asia, with China, India, Indonesia, Bangladesh and Vietnam the major producers accounting for 70% of global supply. Unlike many commodities and financial markets, Rough Rice experienced a considerable rise in price as a result of the onset of the global COVID pandemic, jumping above 23 cents per cwt in June 2020 from just 13 cents in February 2020. It didn’t stay there for long, falling back to the 12 - 14 cent per cwt mark. Given it’s a staple food source across Asia and many other parts of the world, demand is relatively consistent and so price does not fluctuate in the same way that some other commodities do.

Main price factors:

  • Demand - consumption in India and China, being both the major producers and consumers of rice globally, often dictates trends in Rough Rice. But the changing landscape of the 2 countries could mean different things for this commodity. Either way, trends regarding the below 2 points are crucial to monitor for Rough Rice traders.
  1. Increasing wealth and disposable incomes may lead to higher consumption of substitute foods such as meat, pasta and bread. This would lead to lower demand and therefore lower longer term Rough Rice prices.
  2. Population growth tends to increase consumption, and so price of Rough Rice may increase long term.
  • Weather and yields - climatic conditions are the primary determinant of agricultural yields. Good years weather wise will see more abundant supply, and therefore potentially lower prices, whereas poor yields as a result of major weather events or other environmental factors would likely see increases in corn prices. Rice requires significant amounts of water, and so sufficient rain is required throughout the year.
  • Global inventories - as inventories increase, especially in China, the impact of supply gluts will likely have a depreciating effect on Rough Rice in future. Declining reserves may lead to rises in Rough Rice, too.
  • Oil prices - rice harvesting is machinery intensive, and so significant amounts of crude oil are required to produce rice (surprising, right!). Material changes in global and local oil prices can impact the price of Rough Rice.
  • Restrictions on exports - some major producers, such as India, have in the past restricted the export of Rough Rice in order to retain supply for their own people and keep local prices low. Any changes to trade policies from the main Rough Rice producing nations can have a significant impact on this commodity.
Soybean Oil & Soybean Meal

Soybeans are legumes that are produced primarily in the US, Brazil and Argentina, accounting for 80% of global supply. The primary by-products are Soybean Oil and Soybean Meal, and we offer cash contract CFDs on both of these. Soybeans grow in the same conditions to Corn, and often farmers will choose between the two commodities based on futures prices at the time for the relevant product (November futures for Soybeans, December for Corn).

Soybean Oil was trading between $0.24 - $0.43 per pound from 2013 through to the beginning of 2020. Since the onset of the coronavirus pandemic in 2020, we’ve seen a dramatic rise in price from $0.25 to as much as $0.75 per pound in June 2021, before retracing to around $0.67 per pound in July 2021. It’s main use is as a cooking ingredient, but it can also be used to make fuel.

Soybean Meal, on the other hand, experienced a short period of decline from March to May 2020, falling from $330 to $277 per tonne. But it then embarked on a bullish trend, increasing by as much as 70% to $470 in January 2021. It’s since fallen back considerably to around the $350 - $360 mark. Soybean Meal is primarily used as feedstock for cattle and other animals.

The main drivers of Soybean Oil & Soybean Meal are:

  • Weather and yields - climatic conditions are the primary determinant of agricultural yields. Particularly in the US (the largest producer), good years weather wise will see more abundant supply, and therefore potentially lower prices, whereas poor yields as a result of major weather events or other environmental factors would likely see increases in corn prices.
  • Demand from abroad - the US exports around 50% of its Soybeans and emerging countries like China import more than they produce, so demand from emerging nations as their economies grow and strengthen, or even weaken, plays a key role in Soybean Oil and Soybean Meal demand.
  • Corn subsidies - there are significant subsidies enticing corn farmers to produce corn instead of soybeans in order to increase ethanol production. This tends to subdue supply for Soybeans in both Oil and Meal markets, so any changes to these subsidies could see future increases to supply which would place downward pressure on prices.
  • Consumption trends - Soy products are often used as substitutes for dairy, and as the associated health benefits of Soybeans are more widely adopted, there could be future increases in demand.

image.png

Ready to trade?

If you're ready to trade our new range of commodity CFDs, simply log in or sign up here. All of our commodity CFDs are available to trade on the MT4, MT5 and cTrader platforms on live and demo. That means you can practise your strategies in a simulated trading environment before using real capital to take advantage of the many trading opportunities that commodity markets present. You can sign up for a new demo account if you're new to trading with Pepperstone. 

Pepperstone doesn’t represent that the material provided here is accurate, current or complete, and therefore shouldn’t be relied upon as such. The information provided here, whether from a third party or not, isn’t to be considered as a recommendation; or an offer to buy or sell; or the solicitation of an offer to buy or sell any security, financial product or instrument; or to participate in any particular trading strategy. We advise any readers of this content to seek their own advice. Without the approval of Pepperstone, reproduction or redistribution of this information isn’t permitted.

Other Sites

  • The Trade Off
  • Partners
  • Group
  • Careers

Ways to Trade

  • Pricing
  • Trading Accounts
  • Pro
  • Active trader Program
  • Trading Hours

Platforms

  • Trading Platforms
  • Trading tools

Markets and Symbols

  • Forex
  • Shares
  • ETFs
  • Indicies
  • Commodities
  • Currency indicies
  • Cryptocurrencies
  • CFD Forwards

Analysis

  • Navigating Markets
  • The Daily Fix
  • Meet the Analysts

Learn to Trade

  • Trading Guides
  • Videos
  • Webinars
Pepperstone logo
support@pepperstone.com
0035725030573
195, Makarios III Avenue, Neocleous House,
3030, Limassol Cyprus
  • Legal documents
  • Privacy policy
  • Website terms and conditions
  • Cookie policy
  • Sitemap

© 2025 Pepperstone EU Limited
Company Number ΗΕ 398429 | Cyprus Securities and Exchange Commission Licence Number 388/20

Risk warning: CFDs are complex instruments and come with a high risk of losing money rapidly due to leverage. 75.1% of retail investor accounts lose money when trading CFDs with this provider. You should consider whether you understand how CFDs work and whether you can afford to take the high risk of losing your money.

Trading derivatives is risky. It isn't suitable for everyone and, in the case of Professional clients, you could lose substantially more than your initial investment. You don't own or have rights in the underlying assets. Past performance is no indication of future performance and tax laws are subject to change. The information on this website is general in nature and doesn't take into account your or your client's personal objectives, financial circumstances, or needs. Please read our legal documents and ensure you fully understand the risks before you make any trading decisions. We encourage you to seek independent advice.

Pepperstone EU Limited is a limited company registered in Cyprus under Company Number ΗΕ 398429 and is authorised and regulated by the Cyprus Securities and Exchange Commission (Licence Number 388/20). Registered office: 195, Makarios III Avenue, Neocleous House, 3030, Limassol Cyprus.

The information on this site is not intended for residents of Belgium, Spain or the United States, or use by any person in any country or jurisdiction where such distribution or use would be contrary to local law or regulation.